9 Jul, 2026

Stocks in Focus – 2 Winners & 1 Loser for FY26

Stock in Focus • 9 mins read

Back to Insights Back to Insights

Reflections – Winners and a Loser

PDF

A year of getting some right, and getting some wrong

We’ve closed out the financial year. So we thought we’d revisit three holdings we wrote about during the year. Two are standout winners; the other is yet to deliver the returns we were expecting.

The two winners are Marex (NASDAQ: MRX) and Silicon Motion (NASDAQ: SIMO). The loser is Artivion (NYSE: AORT).

Each has something to teach us.


Marex – When the market gets it structurally wrong

Clearing broker Marex, which we had started buying in October 2025, was our most recent Global stock write-up in May 2026 (link).

In May, the stock was trading at less than 10x earnings. The market was pricing Marex like a lower-PE-rating cyclical commodities broker. The shares had also been hurt by a short report from investigative research company, NINGI Research, that alleged accounting irregularities and off-balance-sheet entities.

We, however, had a different view.

Marex, as one of ~60 Futures Commission Merchants (FCMs) globally, sits in the middle of one of the most protected pieces of financial market infrastructure in the world: soliciting and accepting buy and sell orders for futures and options contracts and holding customer funds to facilitate the trade.

Rather than a questionable commodity, we saw a structurally protected compounder benefiting from three tailwinds, all working in the same direction:

  • Growth in exchange-traded volumes, which have been growing at high single digits for years.
  • Share gain from banks retreating after international banking regulations Basel III and IV made clearing structurally uneconomic for large bank incumbents.
  • Consolidation of the fragmented non-bank tail, which is seeing larger specialists, such as Marex, consolidate the smaller end of the FCM market.

We met with the executive vice chair of one of their biggest peers. He personally explained why this is such an attractive market and why they would benefit. However, what was most instructive was how complimentary he was of Marex as a high quality peer that would also benefit.

This was the key reason why we did more work.

We then went through the short report ourselves and with sell-side analysts. On the day of Marex’s March investor day, we caught the red eye from Denver to New York. We arrived early enough to spend time one-on-one with senior management. From these conversations, we concluded the short thesis lacked substance.

Since we wrote about Marex in May, the stock has increased from around $58 to $63. Since we started buying in October last year, it has roughly doubled.

That’s been helped by strong recent financial results. Marex’s Q1 2026 revenue was up 48%, and adjusted profit before tax was up 59% year-on-year. That’s comfortably ahead of the guidance the company had provided at its investor day just six weeks earlier.

Why we still own it: At 10-11x forward earnings, we continue to see plenty of value in a business generating EBIT growth in the teens, and with a long runway for both organic and inorganic market share growth.

Peers like Interactive Brokers and CME are still trading at 20-30x. StoneX, the closest listed comparable to Marex, now trades at ~19x. The gap between those companies and Marex is closing, but it is still quite wide.

Marex also plays a unique role in our portfolio. It is one of the few positions that actively benefits from periods of elevated market volatility rather than being threatened by it.

What we take from this: Our ability to talk with industry leaders in global markets is a key edge. When the market is punishing a stock for something specific and testable – accounting allegations, a short thesis, a temporary earnings miss – the value in doing the work is high, but having our thesis supported and validated by trustworth and aligned industry leaders often limits our downside and ensures our efforts and energy is well directed. Structural business quality is the anchor. If the anchor is sound, the noise is an opportunity.


Silicon Motion – When conviction is rewarded, and then some

Silicon Motion was a name we highlighted in our SaaSpocalypse Now? strategy note in February 2026 (link).

Our core argument was that the AI dispersion between semiconductor stocks and software stocks was going to keep widening. That is, the market would continue to reward infrastructure stocks because of their earnings visibility. And it would continue to punish application-layer software companies because of the threat AI agents posed to their seat-based (per-user subscription fees) revenue.

We were expressing that view in the storage space by holding Silicon Motion, which we bought in June 2025.

Silicon Motion is a fabless designer of NAND flash controllers – the small processors that manage how data is stored, retrieved, and protected inside smartphones as well as the solid-state drives (SSDs) that are crucial for AI.

Our thesis was straightforward: as AI capex ballooned, memory and storage, of which Silicon Motion provides a vital component, were emerging as the next bottleneck. Nvidia’s Jensen Huang had said just as much at the Consumer Electronics Show (CES) on January 5 this year. Samsung and Micron were pushing through 40-50% price rises because demand was outstripping supply. And TSMC’s capex guidance, a bid to meet this relentless demand, was well above expectations.

We didn’t need to predict every twist in the AI cycle. We just needed exposure to the ‘picks-and-shovels’ (infrastructure layer) end of it, at reasonable multiples, with a business that stood to benefit from the memory upcycle.

Silicon Motion has since delivered.

The company’s Q1 2026 revenue was up 105% year-on-year; EPS beat consensus by nearly 25%; and the stock has been one of the best performers in the storage complex.

It is currently trading around $320, up from about $70 a year ago.

Why we still own it: The company’s underlying earnings growth is not a one-quarter phenomenon. Silicon Motion is riding a multi-year product-led growth cycle. Its expensive, high-performance chips – PCIe Gen5 controllers, enterprise SSD solutions, and new AI-optimised products – are all coming into a market where demand is outstripping supply on a structural basis.

We continue to see outsized earnings growth ahead for the company. While some of that is now in the price, we see further upside from current levels.

What we take from this: When you get a thematic call right we don’t want to let our sector exposure continue to grow aggressively. When the market is crowding into a thematic, discipline requires taking money off the table – but the key is to identify which stock has more to run compared with the one where more of the upside has been realised. The hardest trades to make are often the ones after you’ve been right.


Artivion – When the market derates faster than the earnings

We wrote up specialised aortic device business Artivion in April 2026 (link here).

Our thesis was that this was a high-quality medtech compounder. It is run by a management team we have known and trusted for years. And it has a product pipeline that could sustain double-digit growth to the end of the decade.

We bought it pre-COVID, sold at the 2025 highs, and re-entered in February 2026on a pullback that was overdone.

Since then, the stock has continued lower. It is now trading around $US22. It’s down from its November 2025 high of around $48 and down from ~$35 at the time of our write-up. A disappointing result in May contributed to the share price decline.

Here is the key point, though: Even though the stock has fallen close to 40%, the company only reduced its FY26 earnings expectations by mid-single digits. That multiple de-rating is difficult to reconcile with the fact that the issues driving the guidance softening were non-structural:

  • Elevated capex in FY26 to fund the closing of the Endospan acquisition earn-out.
  • Some conservatism on new product timing.
  • A broader derating of medtech companies in an environment that has been driven by momentum rather than fundamentals.

None of this changes the shape of Artivion’s earnings power in 2027 and beyond, which should be accelerated by the launch of new products, AMDS and NEXUS.

We tested our thesis directly.

After the pullback, we met with two separate US cardiologists and a European competitor to check whether anything had changed at the customer, clinical, or competitive level. It hadn’t. Product adoption remained strong. Cardiologist sentiment toward Artivion continued to be positive. There was no material change in the competitive landscape.

Why we still own it: Our valuation of the business has not changed. Our confidence in Pat Mackin and the management team remains. The earnings power we are confident in for 2027 and beyond is still in front of us, and the channel checks confirm the recent issues are not structural.

What we take from this: When a stock derates by 30-40% on a mid-single-digit earnings revision, the market is expressing a view about the business’s long-term earnings power, not just the current year’s number.

The discipline in those moments is to check whether the market is right – to test the thesis with the customers, the competitors, and the clinical data – rather than either doubling down reflexively or capitulating. When the channel checks come back clean, as they did with Artivion, that gives us the confidence to stay invested.

Looking forward: Three vital characteristics of our holdings

We enter the second half of 2026 with the portfolio positioned around businesses we believe combine three characteristics:

  1. Structural tailwinds that don’t depend on any single macro outcome.
  2. Valuations that leave room for re-rating as well as earnings growth.
  3. And management teams we have known through multiple cycles.

Marex remains one of our largest positions. Silicon Motion has been trimmed, but we retain meaningful exposure. And we continue to hold Artivion hold with conviction – its earnings power has not changed, and the recent share price weakness has made it more attractive on our numbers, not less.


Previous

9 Jul, 2026 Letter to Investors - June 2026

Next

24 Jul, 2026 FY26 Final Distributions
16 Jun, 2026

Stock in Focus – Service Stream (ASX: SSM)

Stock in Focus • 9 mins read

Back to Insights Back to Insights

PDF


The quiet half of the infrastructure trade

When investors think about infrastructure, they usually think about the building of it – the cranes, the ribbon cuttings, the multi-billion-dollar contracts to construct new highways, fibre networks, and water treatment plants.

What is often overlooked is the quieter, less glamorous component: maintenance. Someone has to inspect the pipes, fix the leaks, upgrade the substations and respond when a storm takes down a network. None of it is headline-grabbing. All of it keeps the country running.

Service Stream (ASX: SSM) is one of Australia’s largest essential network services companies, delivering operations and maintenance work across telecommunications, utilities, transport, and (as of February 2026) defence.

We have owned Service Stream at various points of different cycles. Today, Service Stream is in an absolute sweet spot. It has significant earnings upside over the next three years, a valuation that does not appropriately reflect this, and, on top of this, a net cash balance sheet that gives it optionality to take acquisition opportunities that arise.


Not just another ‘bad contractor’

We initially bought into Service Stream in 2023. At the time, the company had taken on several utilities contracts that were poorly priced and poorly risk-managed. Margins collapsed, the stock derated heavily, and the market wrote the business off as a typical ‘bad contractor’ story.
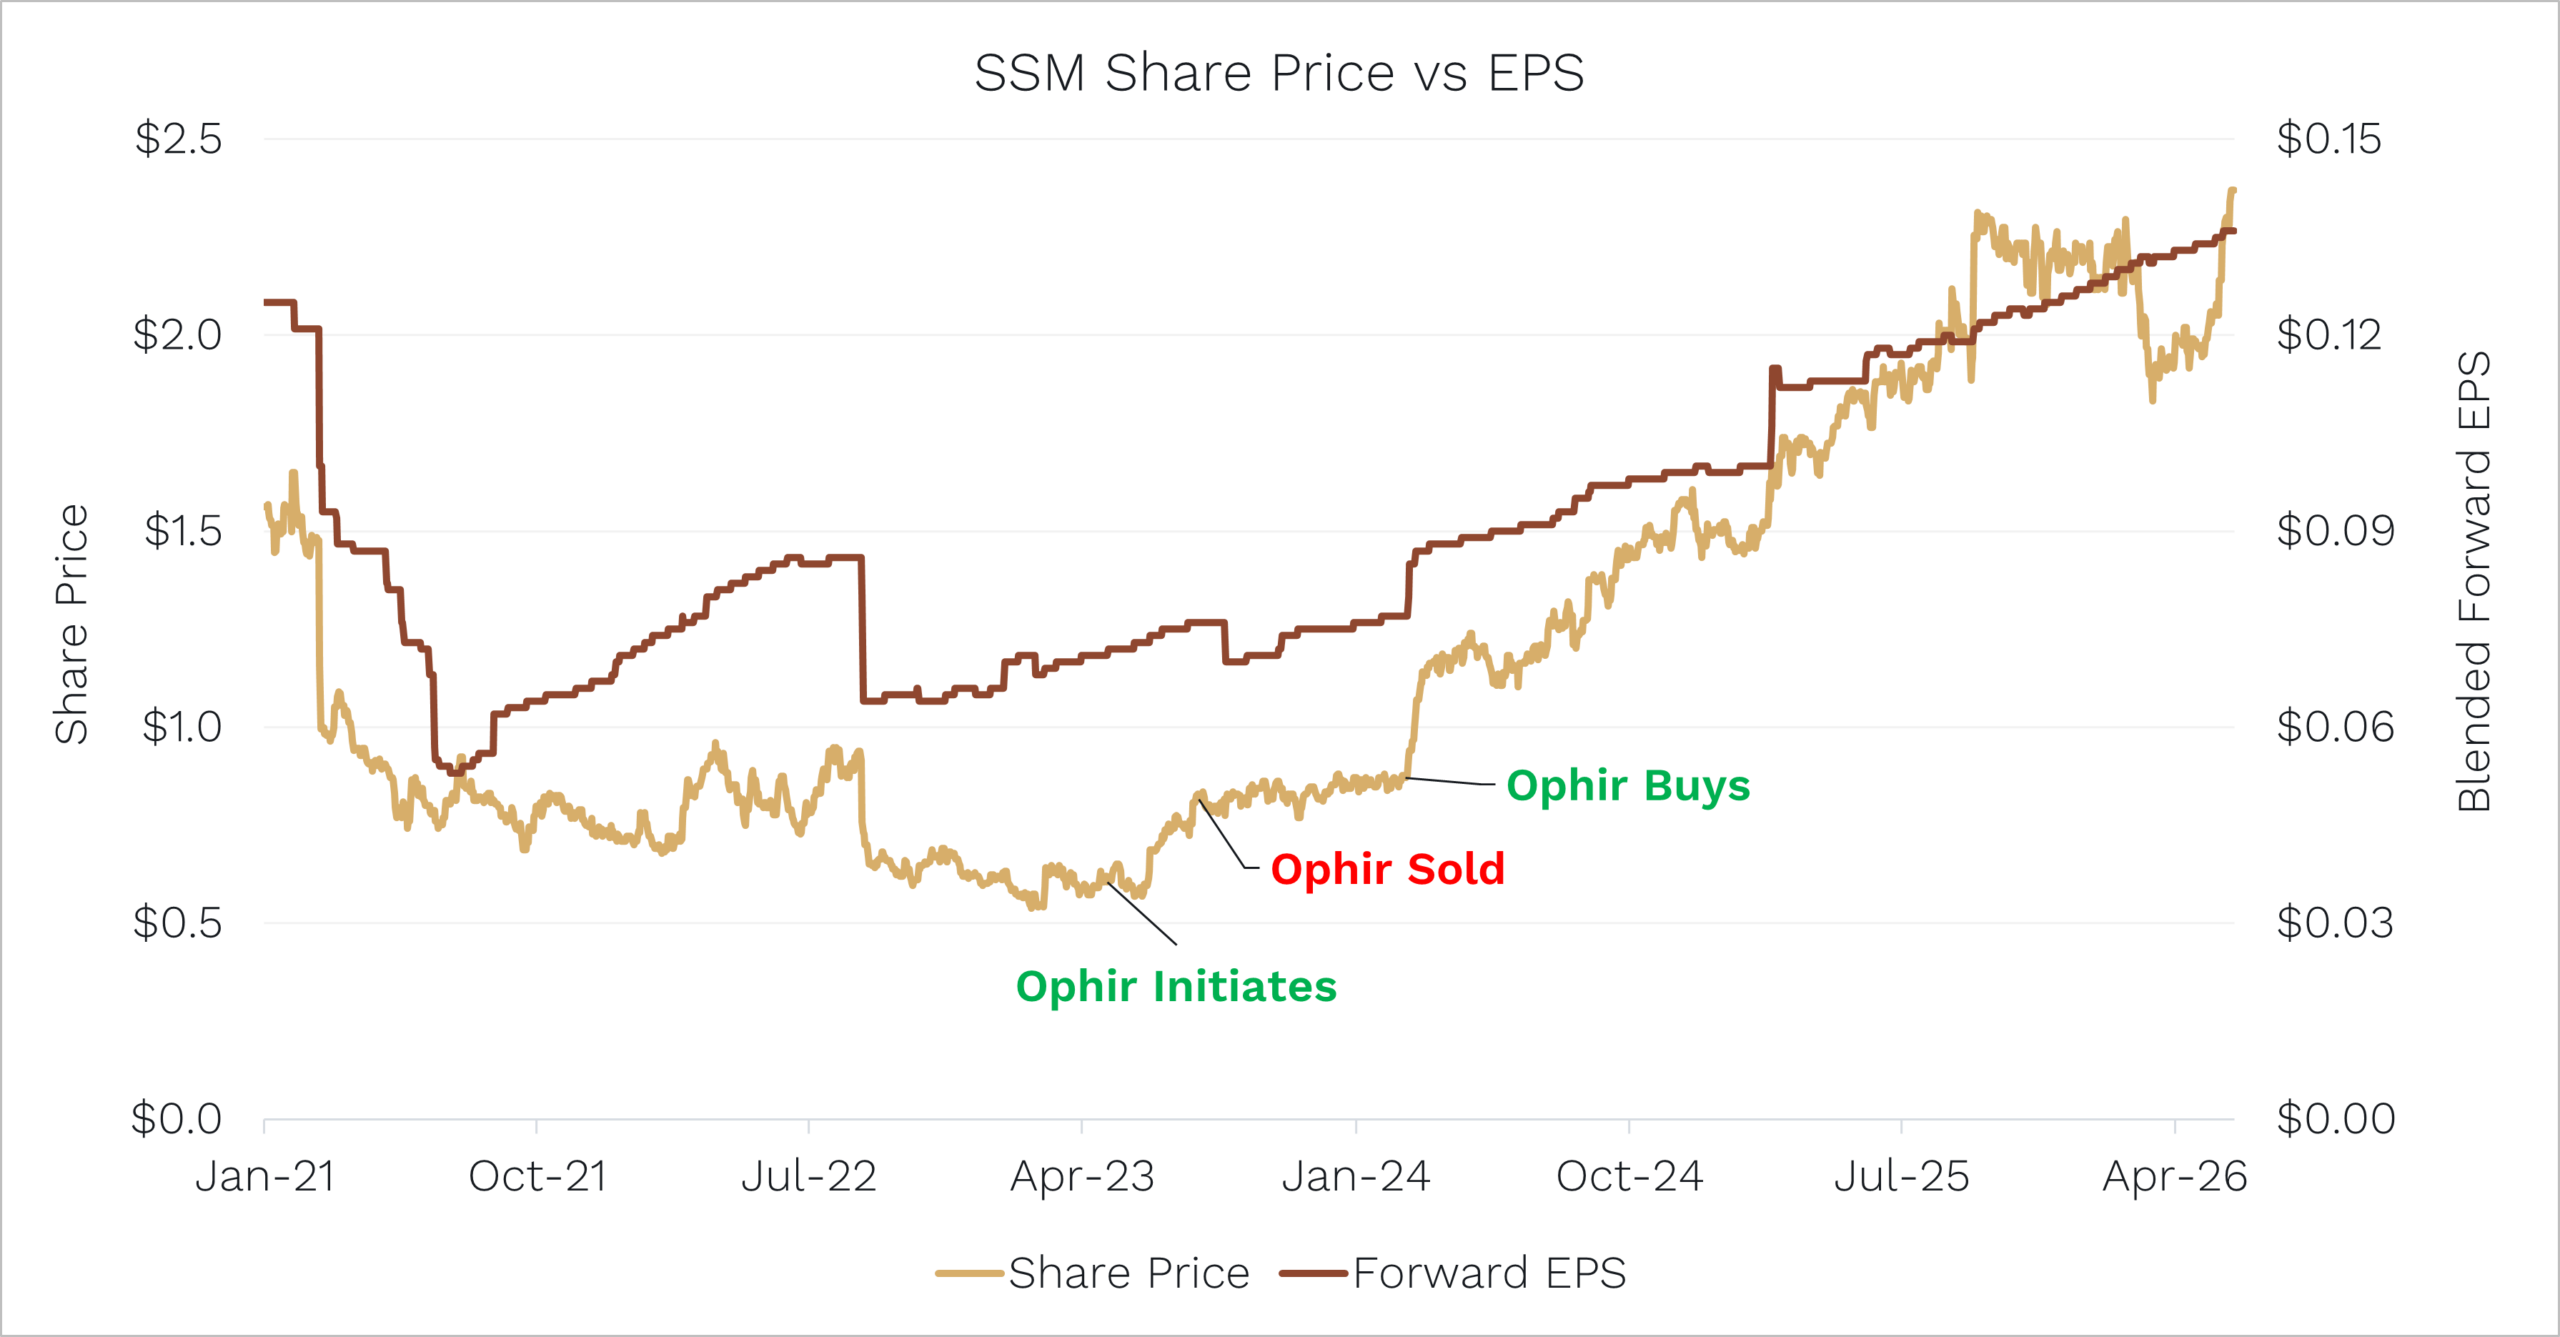
Source: Ophir, Bloomberg. Data as at 31 May 2026.

However, we could see the opposite was true. The contracts in question were finite. The management team had evolved. Pricing discipline was being restored. And the underlying franchise, multi-year operations and maintenance (O&M) contracts with blue-chip utilities and telcos, was inherently a high-quality annuity business once the legacy issues were worked through.

The share price has obviously increased a long way since then. But we believe the market is still underestimating the upside of the company.

There are three reasons we have been adding to the position over the past year, and all point to the same thing: earnings upside.

  1. The utilities margin recovery has further to run

Service Stream’s utilities division was the heart of the original problem back in 2022. Over the past 24 months, the team has methodically restructured pricing, exited unprofitable scopes, and rebuilt the discipline around contract risk.

The result is now becoming visible in the numbers. The 1H26 result showed a step-change in utility EBITDA margins to 5.5%, up 130 basis points on the prior corresponding period and ahead of the segment repositioning target of 5.0%. Management has indicated that it is targeting further incremental margin expansion.

We think this is achievable. The company is now in a position to selectively pursue minor capital works at higher margins, and the broader contracting environment is supportive. As a result, utilities can continue to grow organically at high single digits, with EBITDA margins expanding towards 6.5% over the next two years.
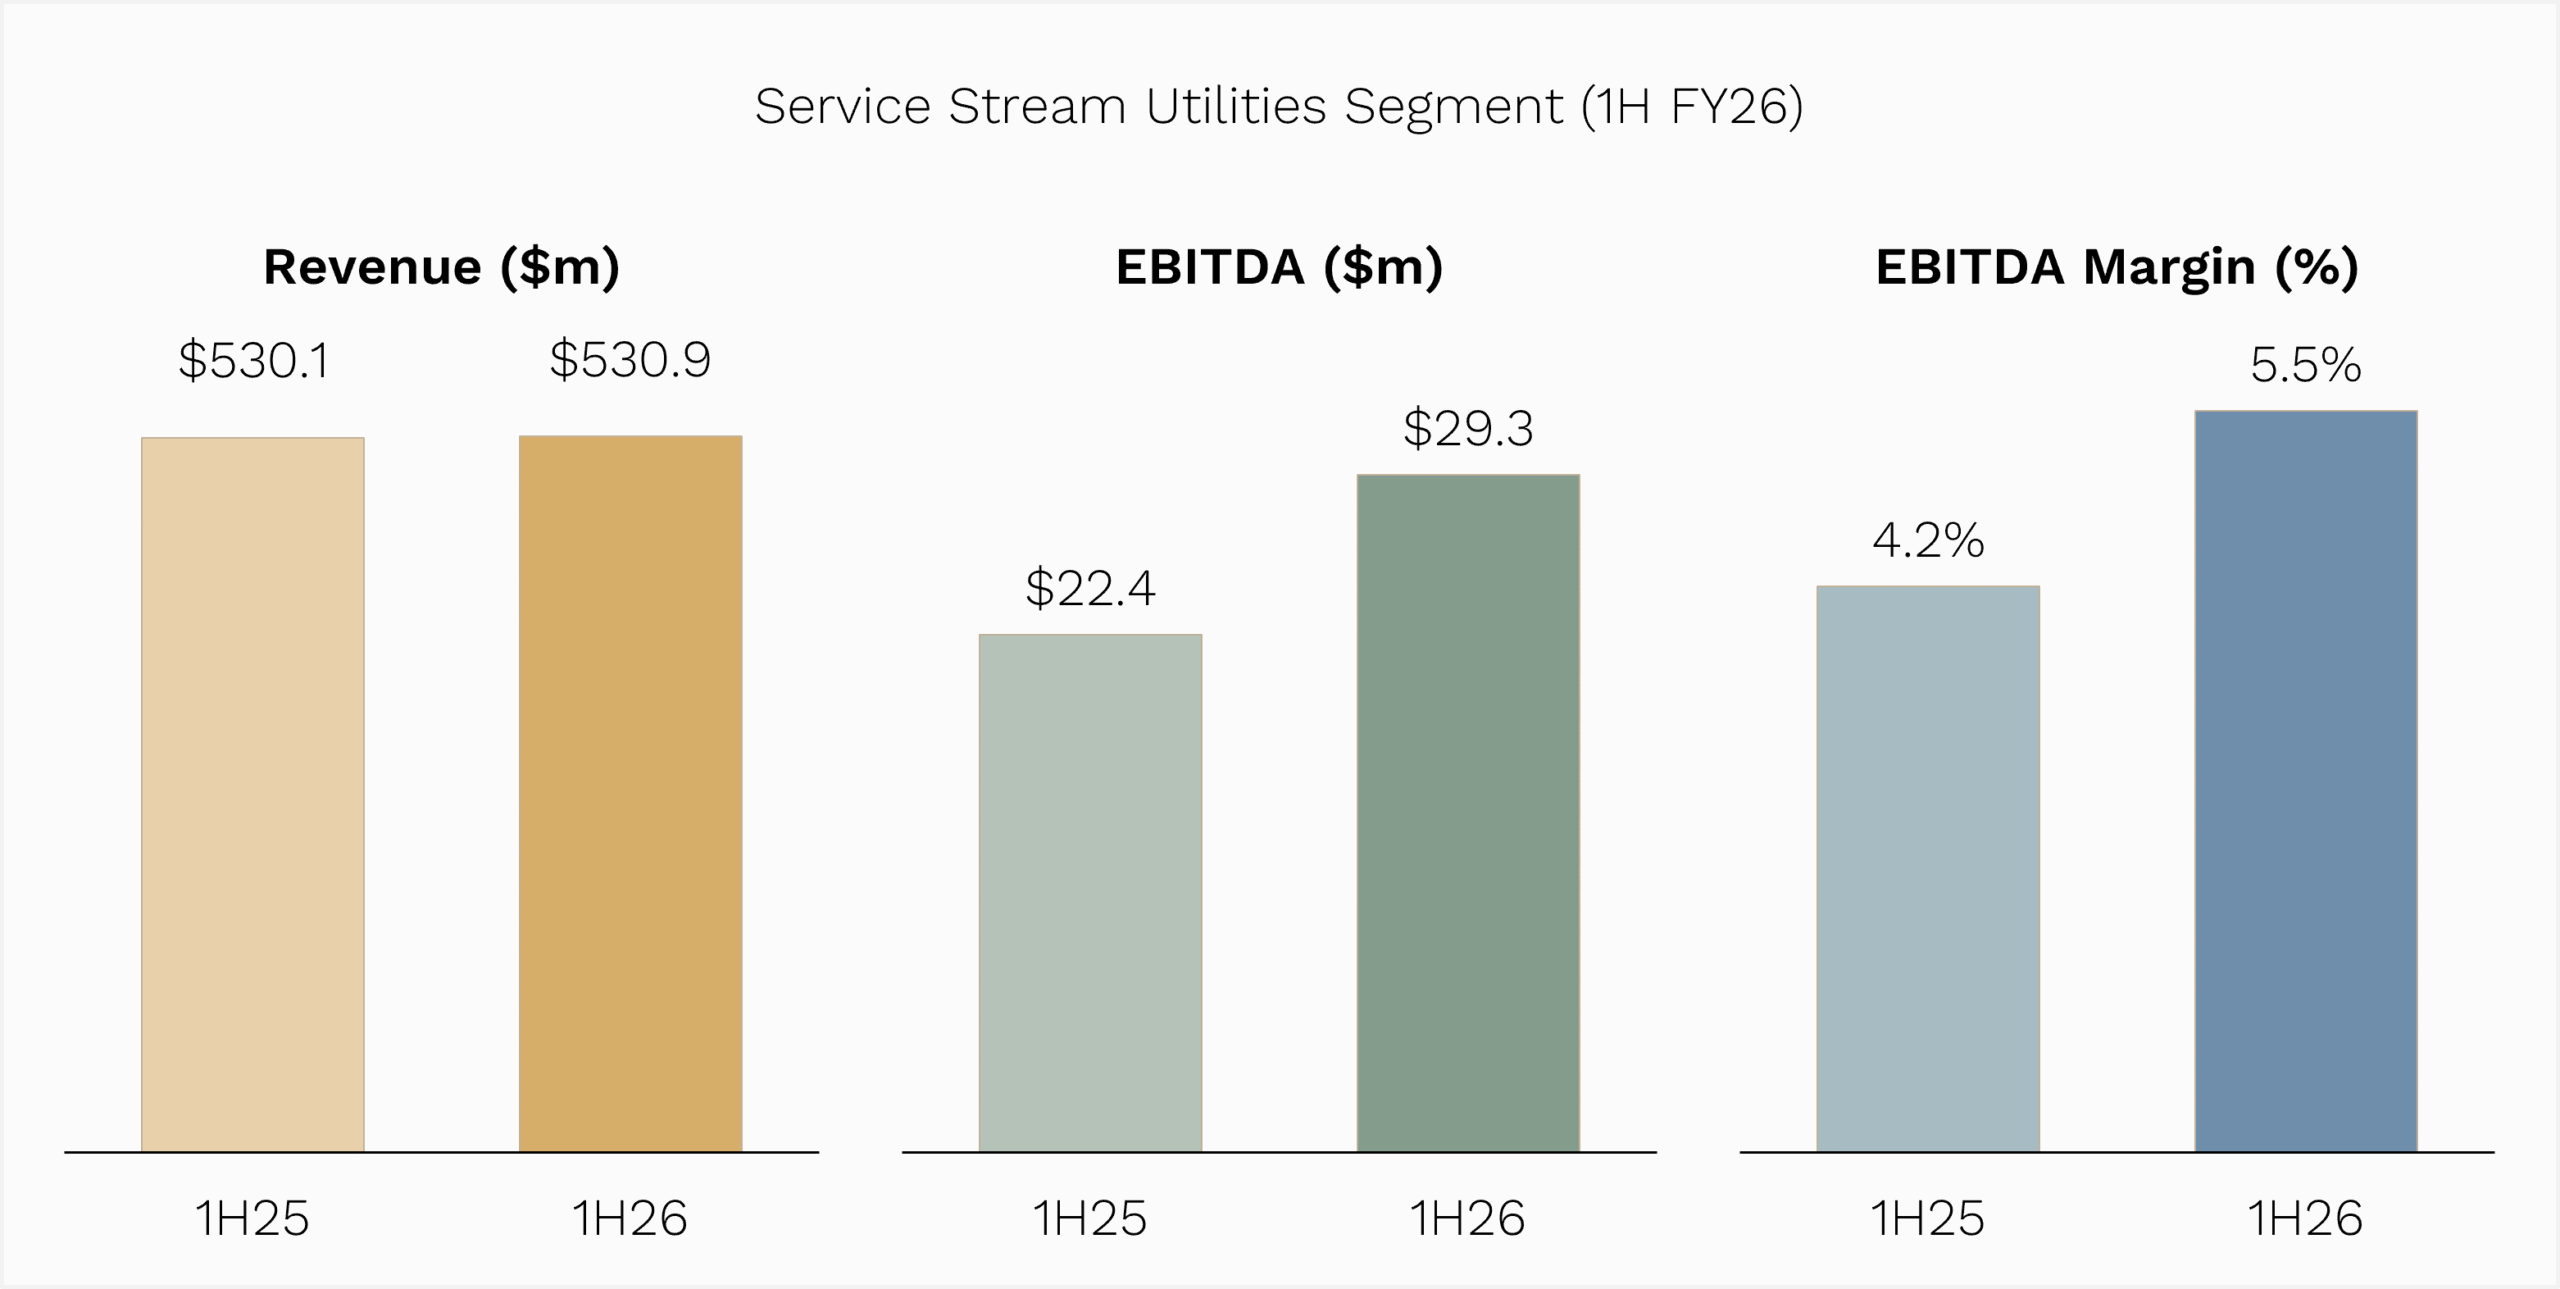
Source: Service Stream FY26 Half Year Results Presentation.

  1. Defence is a genuine step-change in the addressable market

In FY26, Service Stream achieved a long-term strategic objective when it was appointed as a Tier 1 Defence contractor. The win was a six-year Property & Asset Services agreement with the Department of Defence covering the Northern Territory and South Australia, with two 1- to 3-year extension options. Initial contract value is $1.6 billion over the first six years.
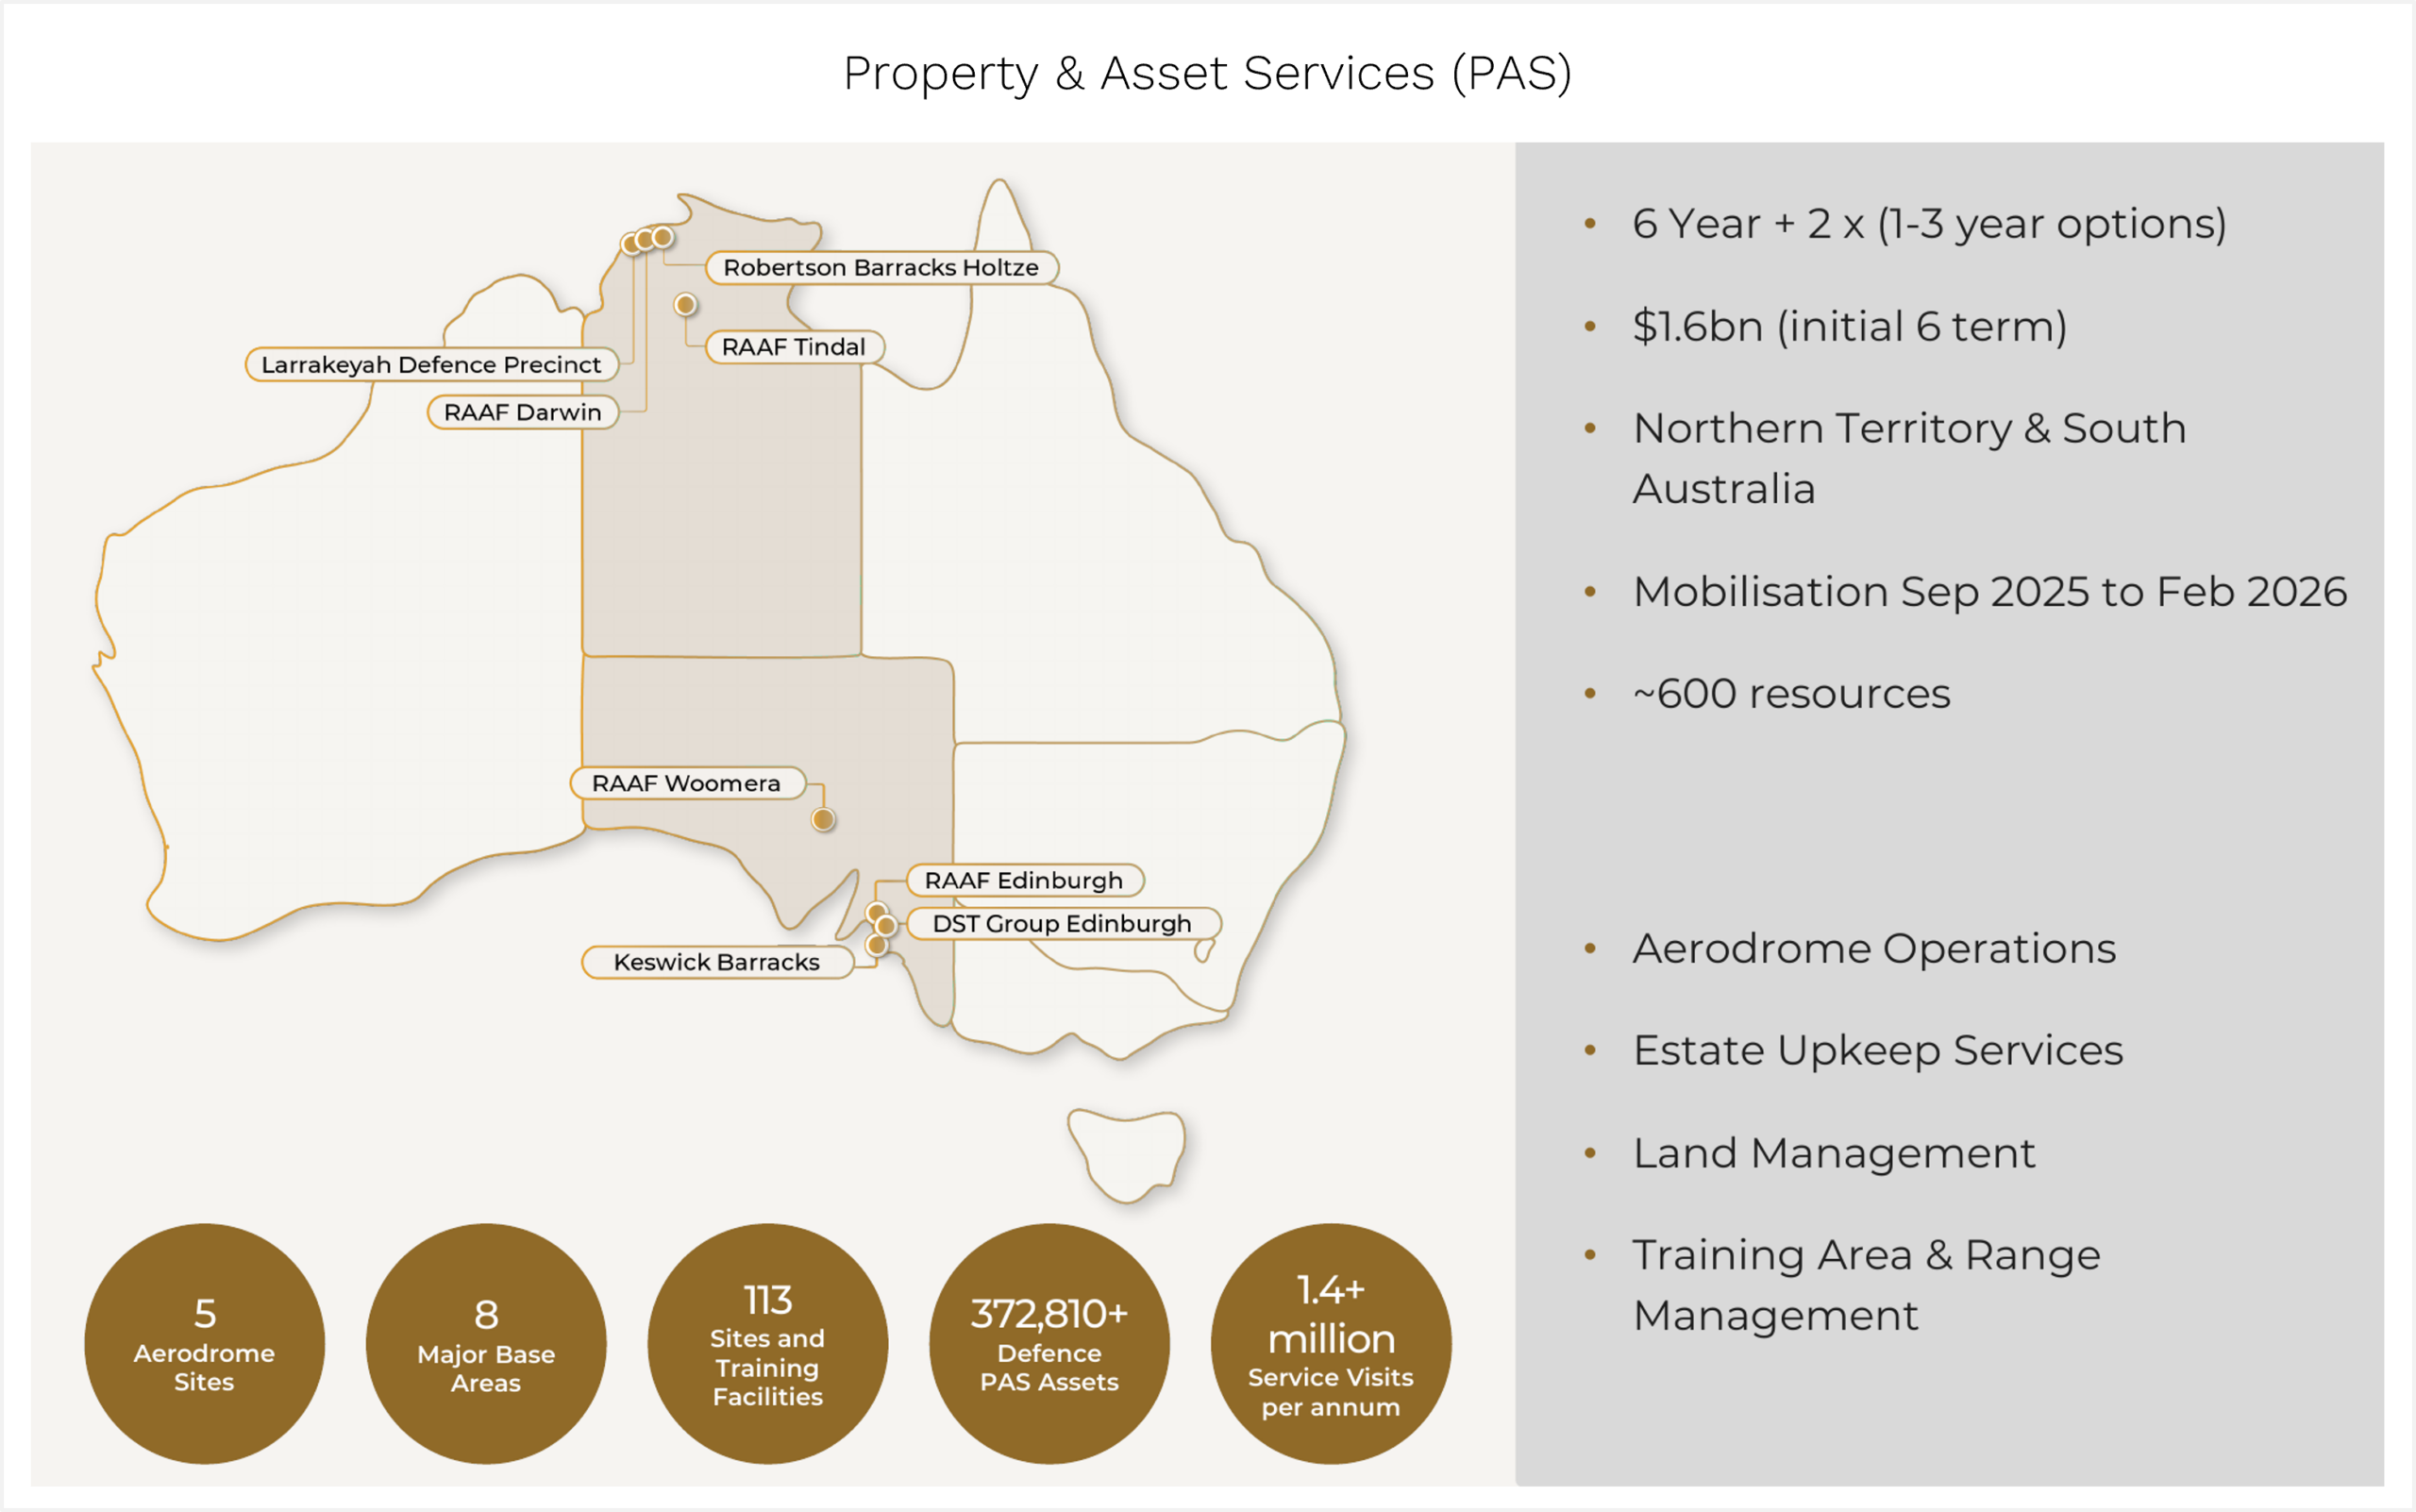
Source: Service Stream FY26 Half Year Results Presentation.

This is genuinely significant for two reasons. First, it represents a major expansion of the Group’s addressable market – Defence facilities maintenance has historically been a duopoly dominated by Ventia and Downer. Service Stream is now part of that conversation. Second, the contract mobilised on 1 February 2026 and is expected to contribute meaningfully to earnings from FY27 onwards.

The market is currently using a ~5% margin assumption for this work, which we think is conservative. In time, the team will scale, optimise operations, and start winning the minor capital works that typically accompany the incumbent facilities maintenance contractor. We believe Defence could generate over $250 million of annual revenue for Service Stream at margins north of 5%.
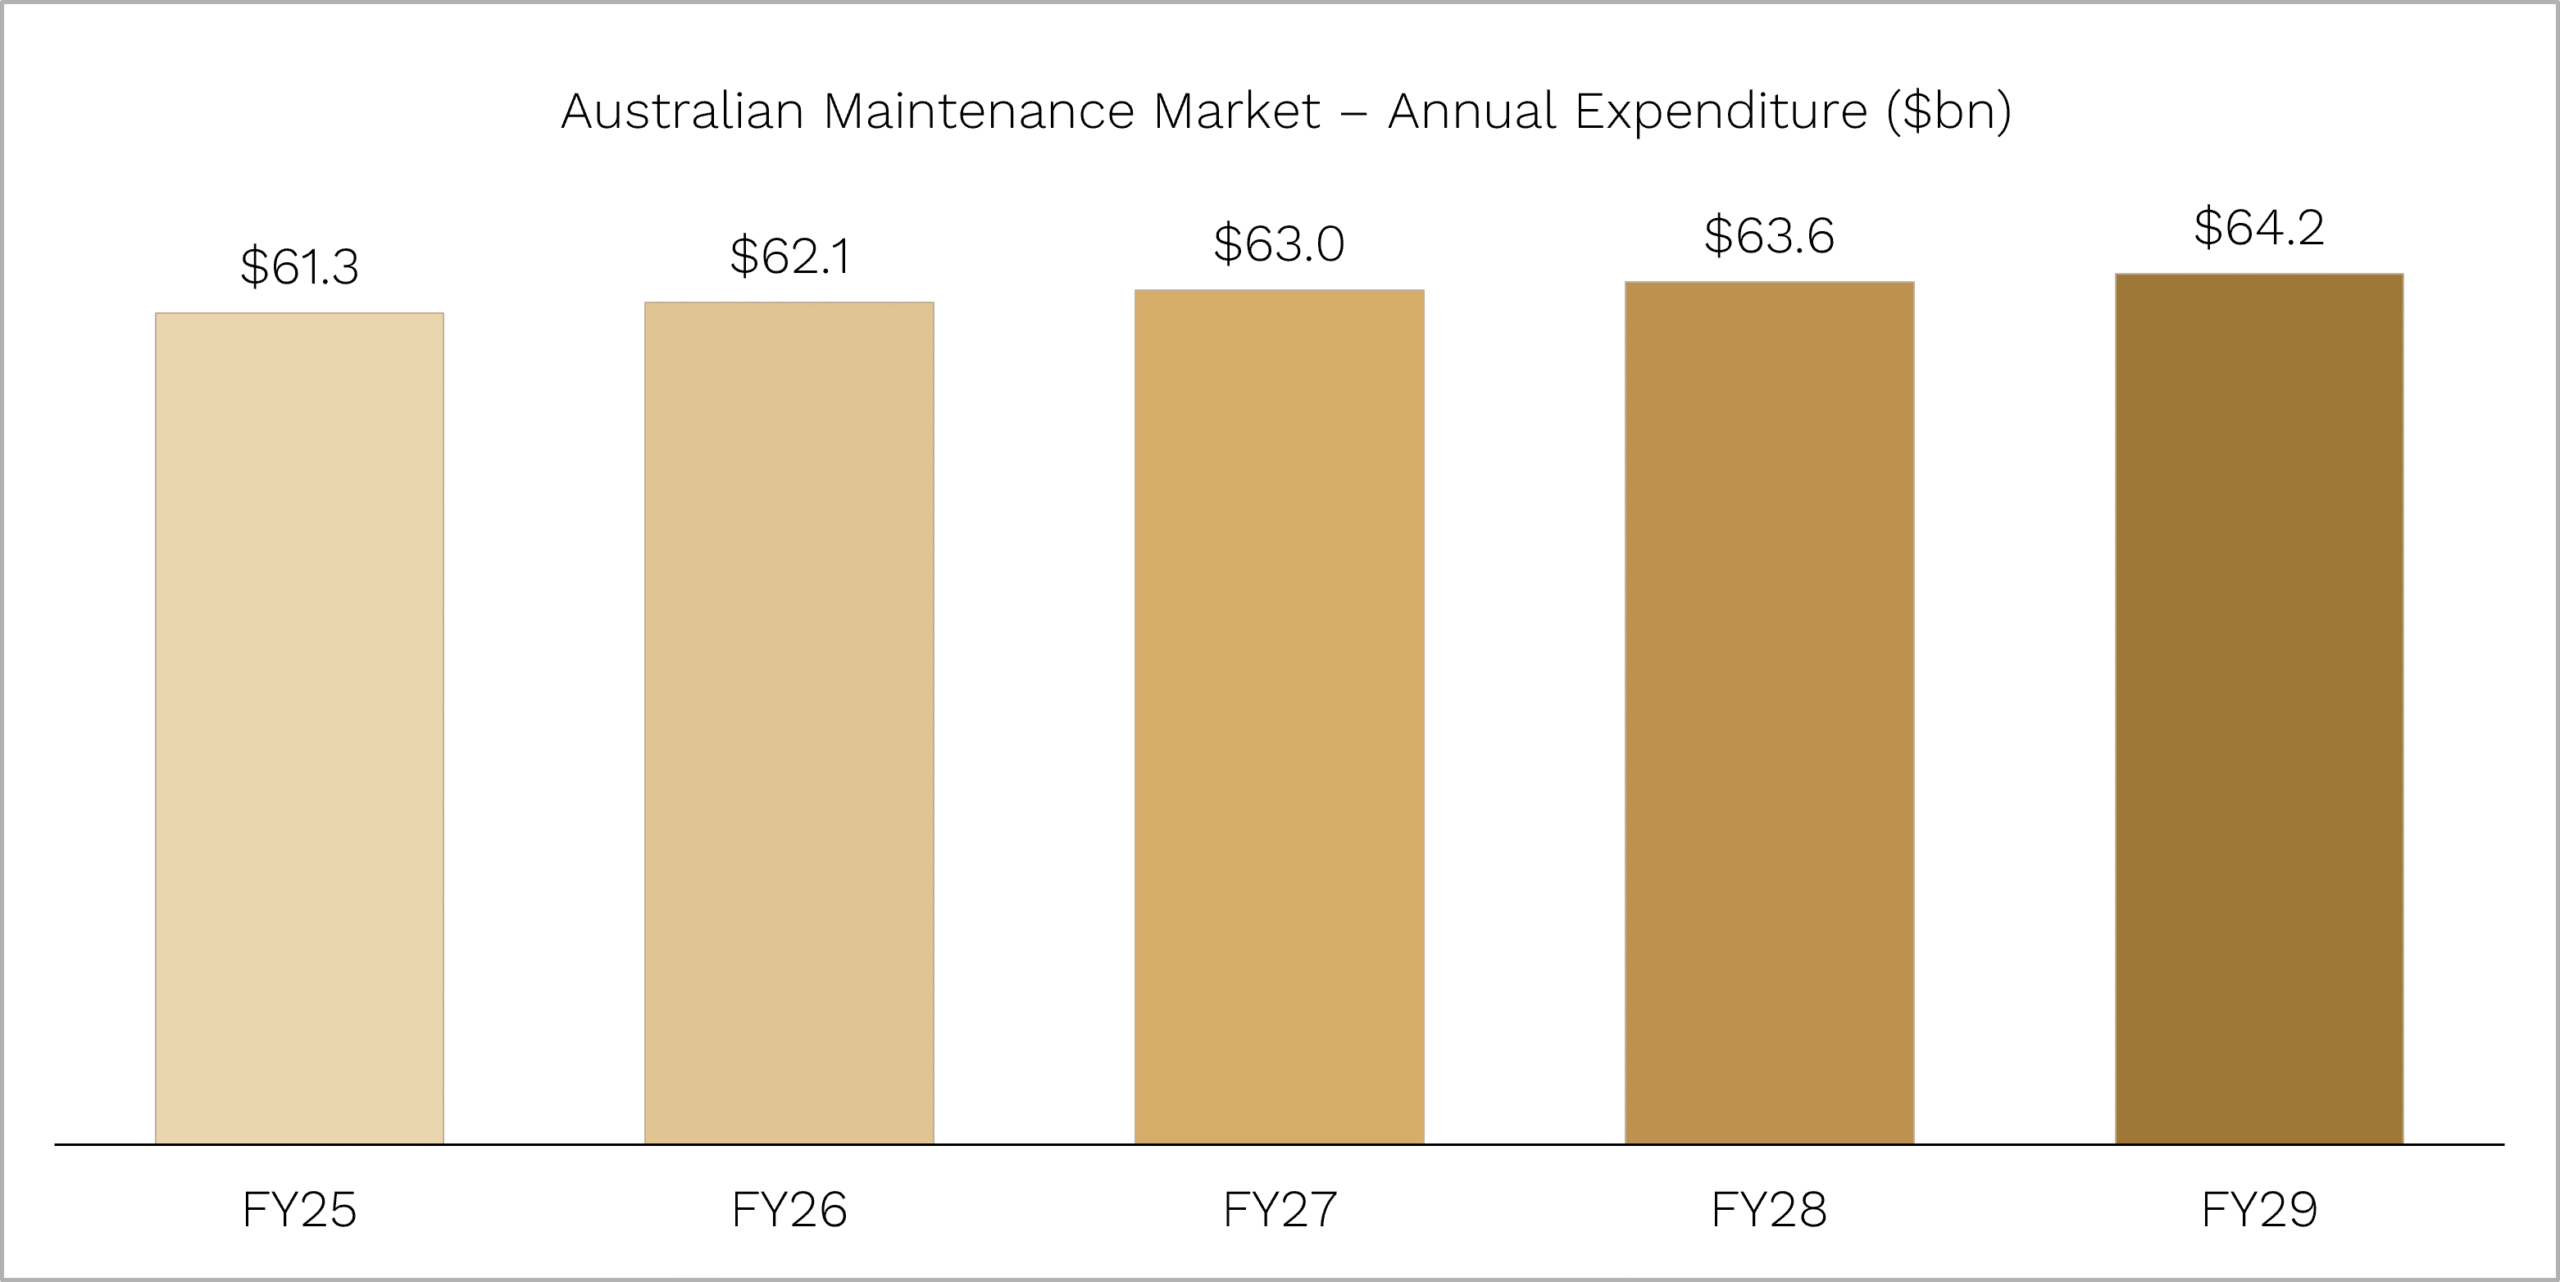
Source: Service Stream FY26 Half Year Results Presentation.

  1. Telecommunications remains a steady earner with embedded growth

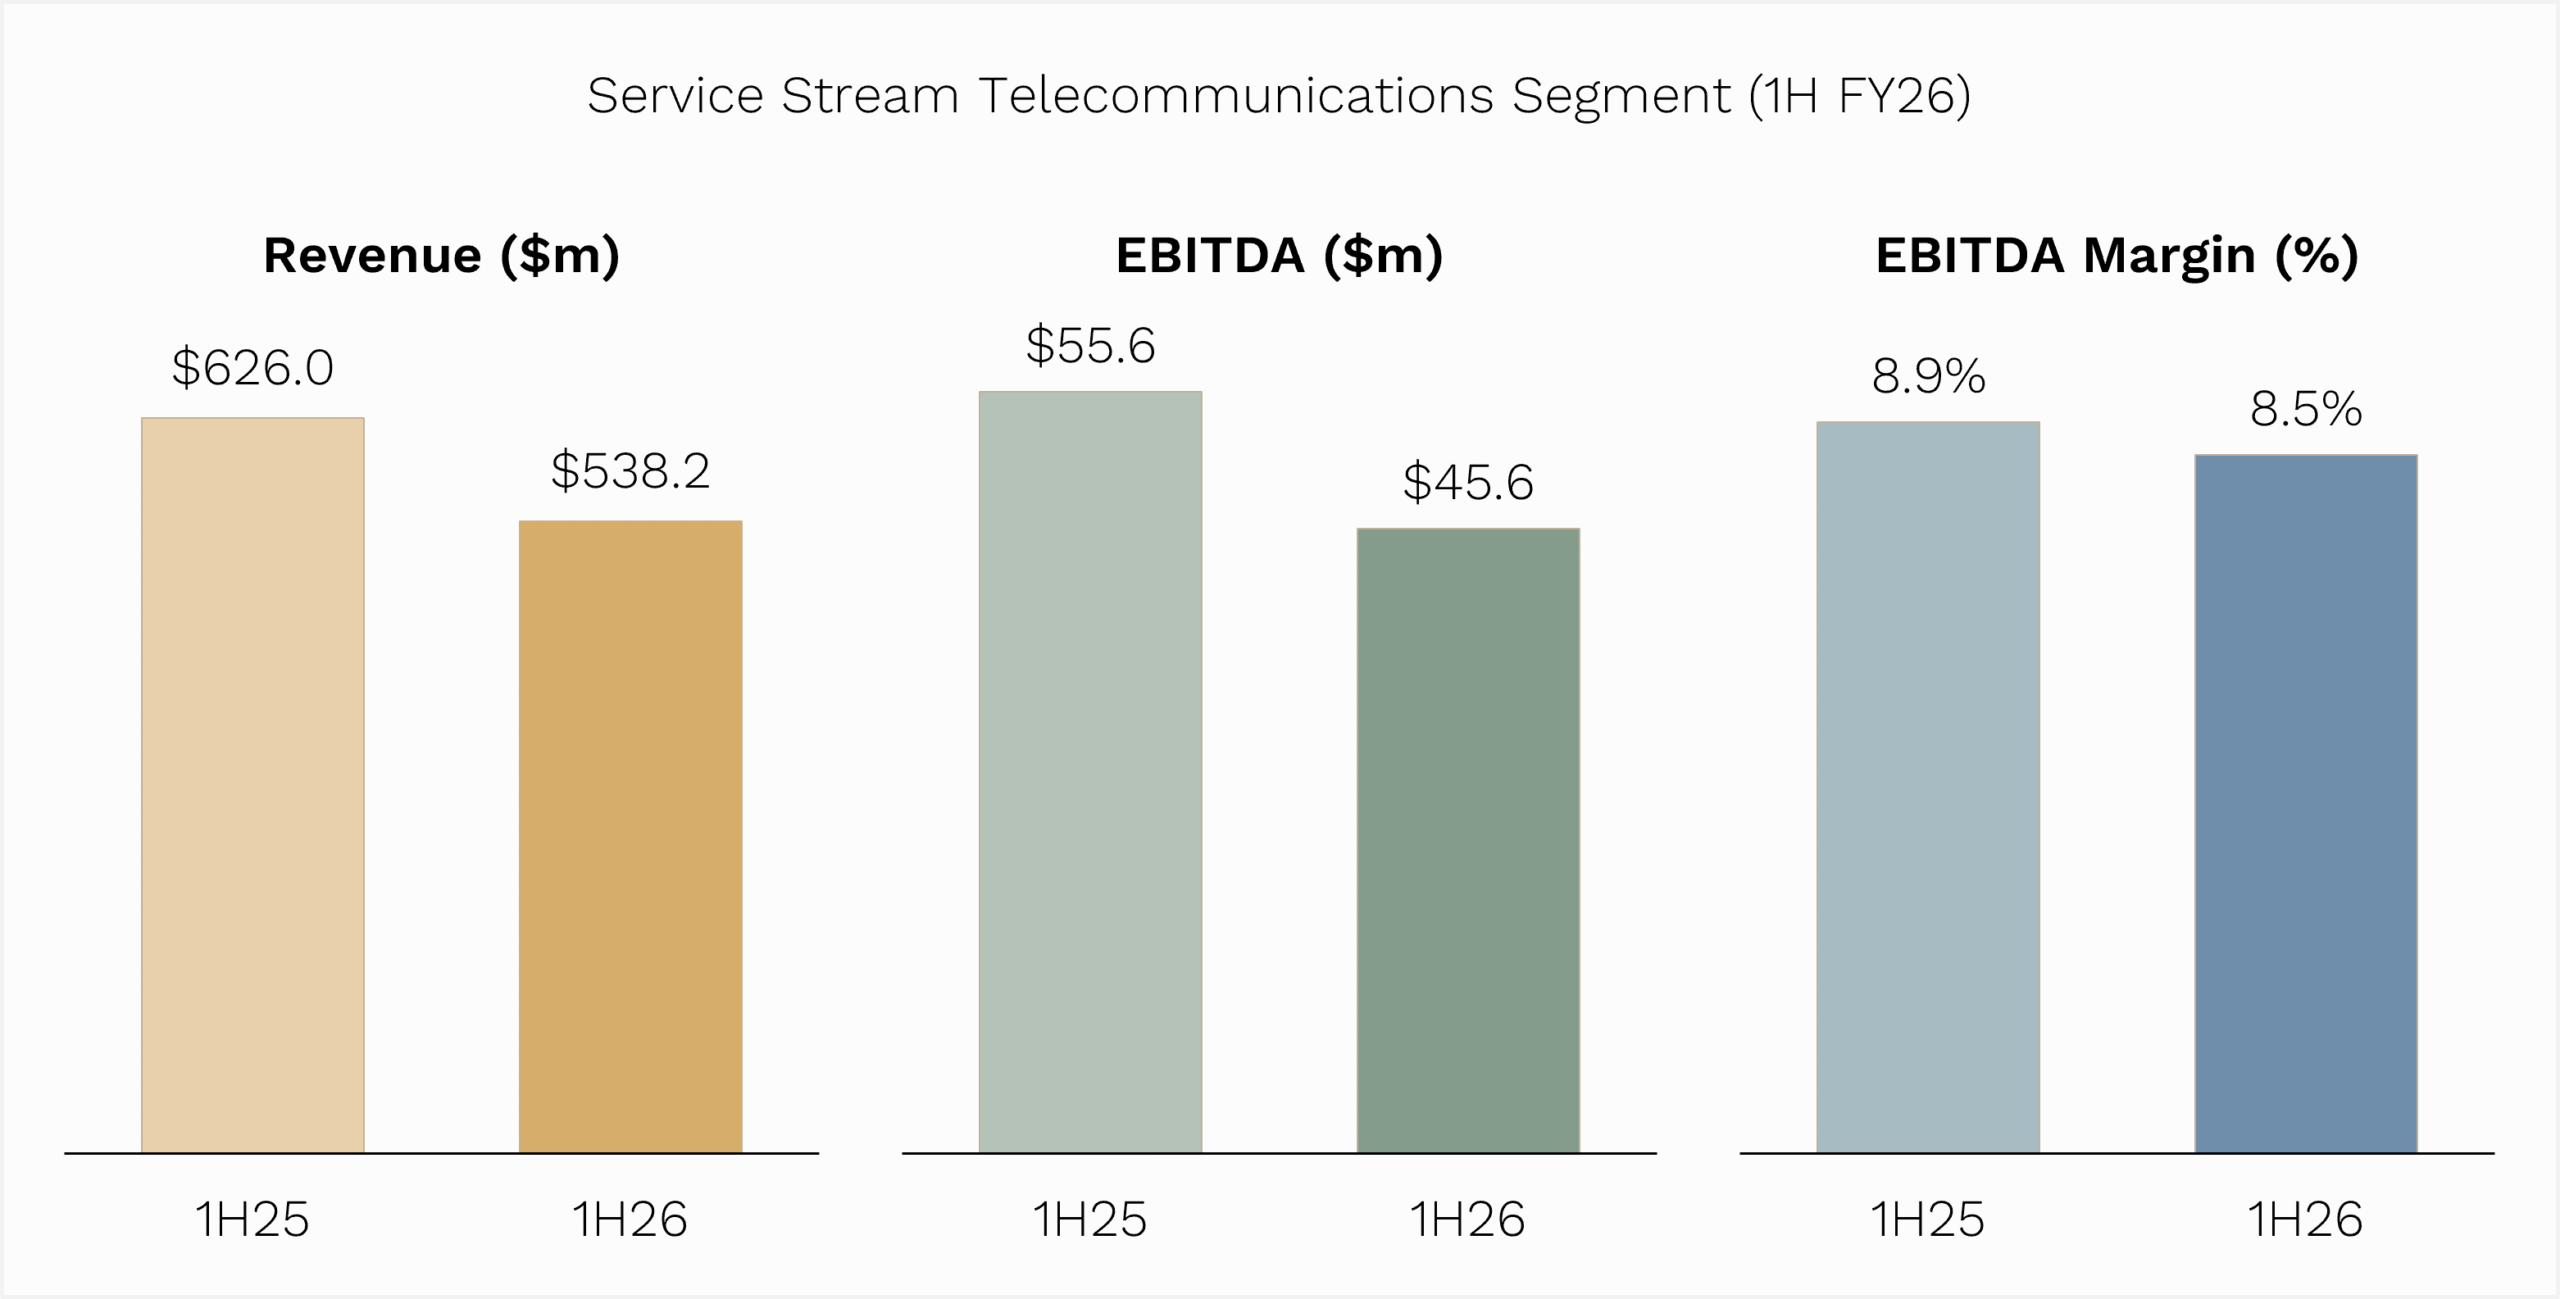
The telco segment has cycled off a strong period (the 1H25 comparable was inflated by programs that have since rolled off), but the underlying franchise is in good shape. Most notably, Service Stream has:

  • Successfully transitioned to a new NBN Field Services contract with exclusive coverage of VIC, SA, WA & NT.
  • Commenced initial mobilisation on the new NBN fibre upgrade in QLD, NSW and ACT.
  • Signed a new five-year strategic partnership with Telstra.
  • Secured a new program supporting Optus HFC decommissioning.

These are all multi-year, annuity-style contracts that underpin the segment for the next 3-5 years. We believe Service Stream’s telco segment can grow revenue 3-5% next year at margins of around 9%.
Source: Service Stream FY26 Half Year Results Presentation.


A hidden order book

What gives us particular confidence in the company’s earnings trajectory is the rate at which Service Stream has been securing new work.

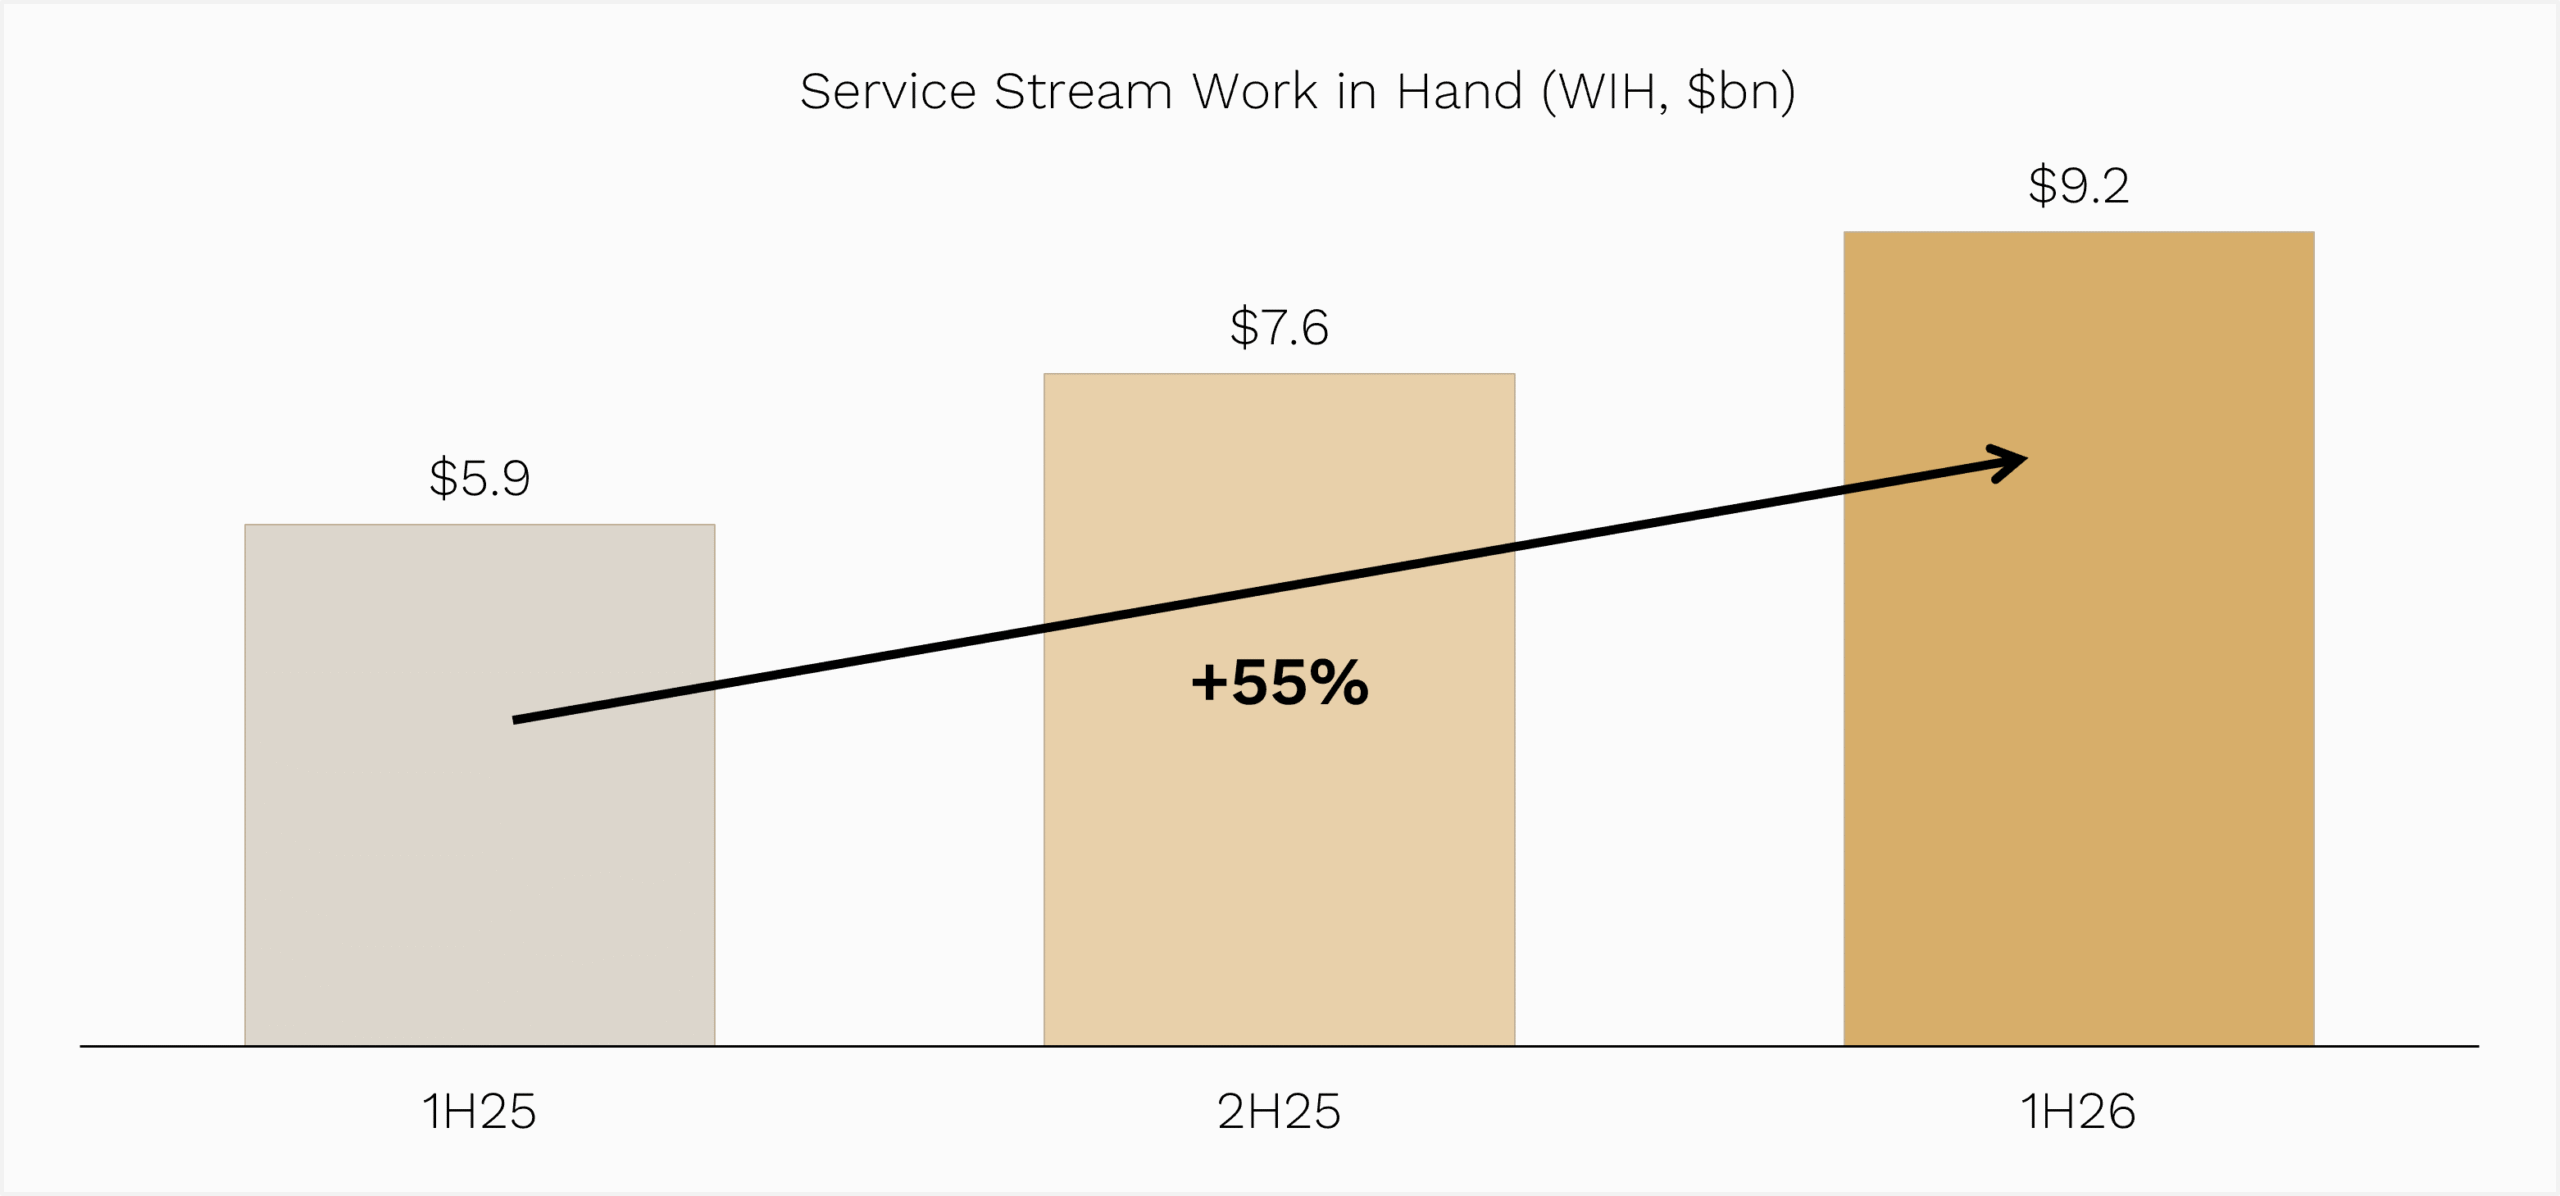
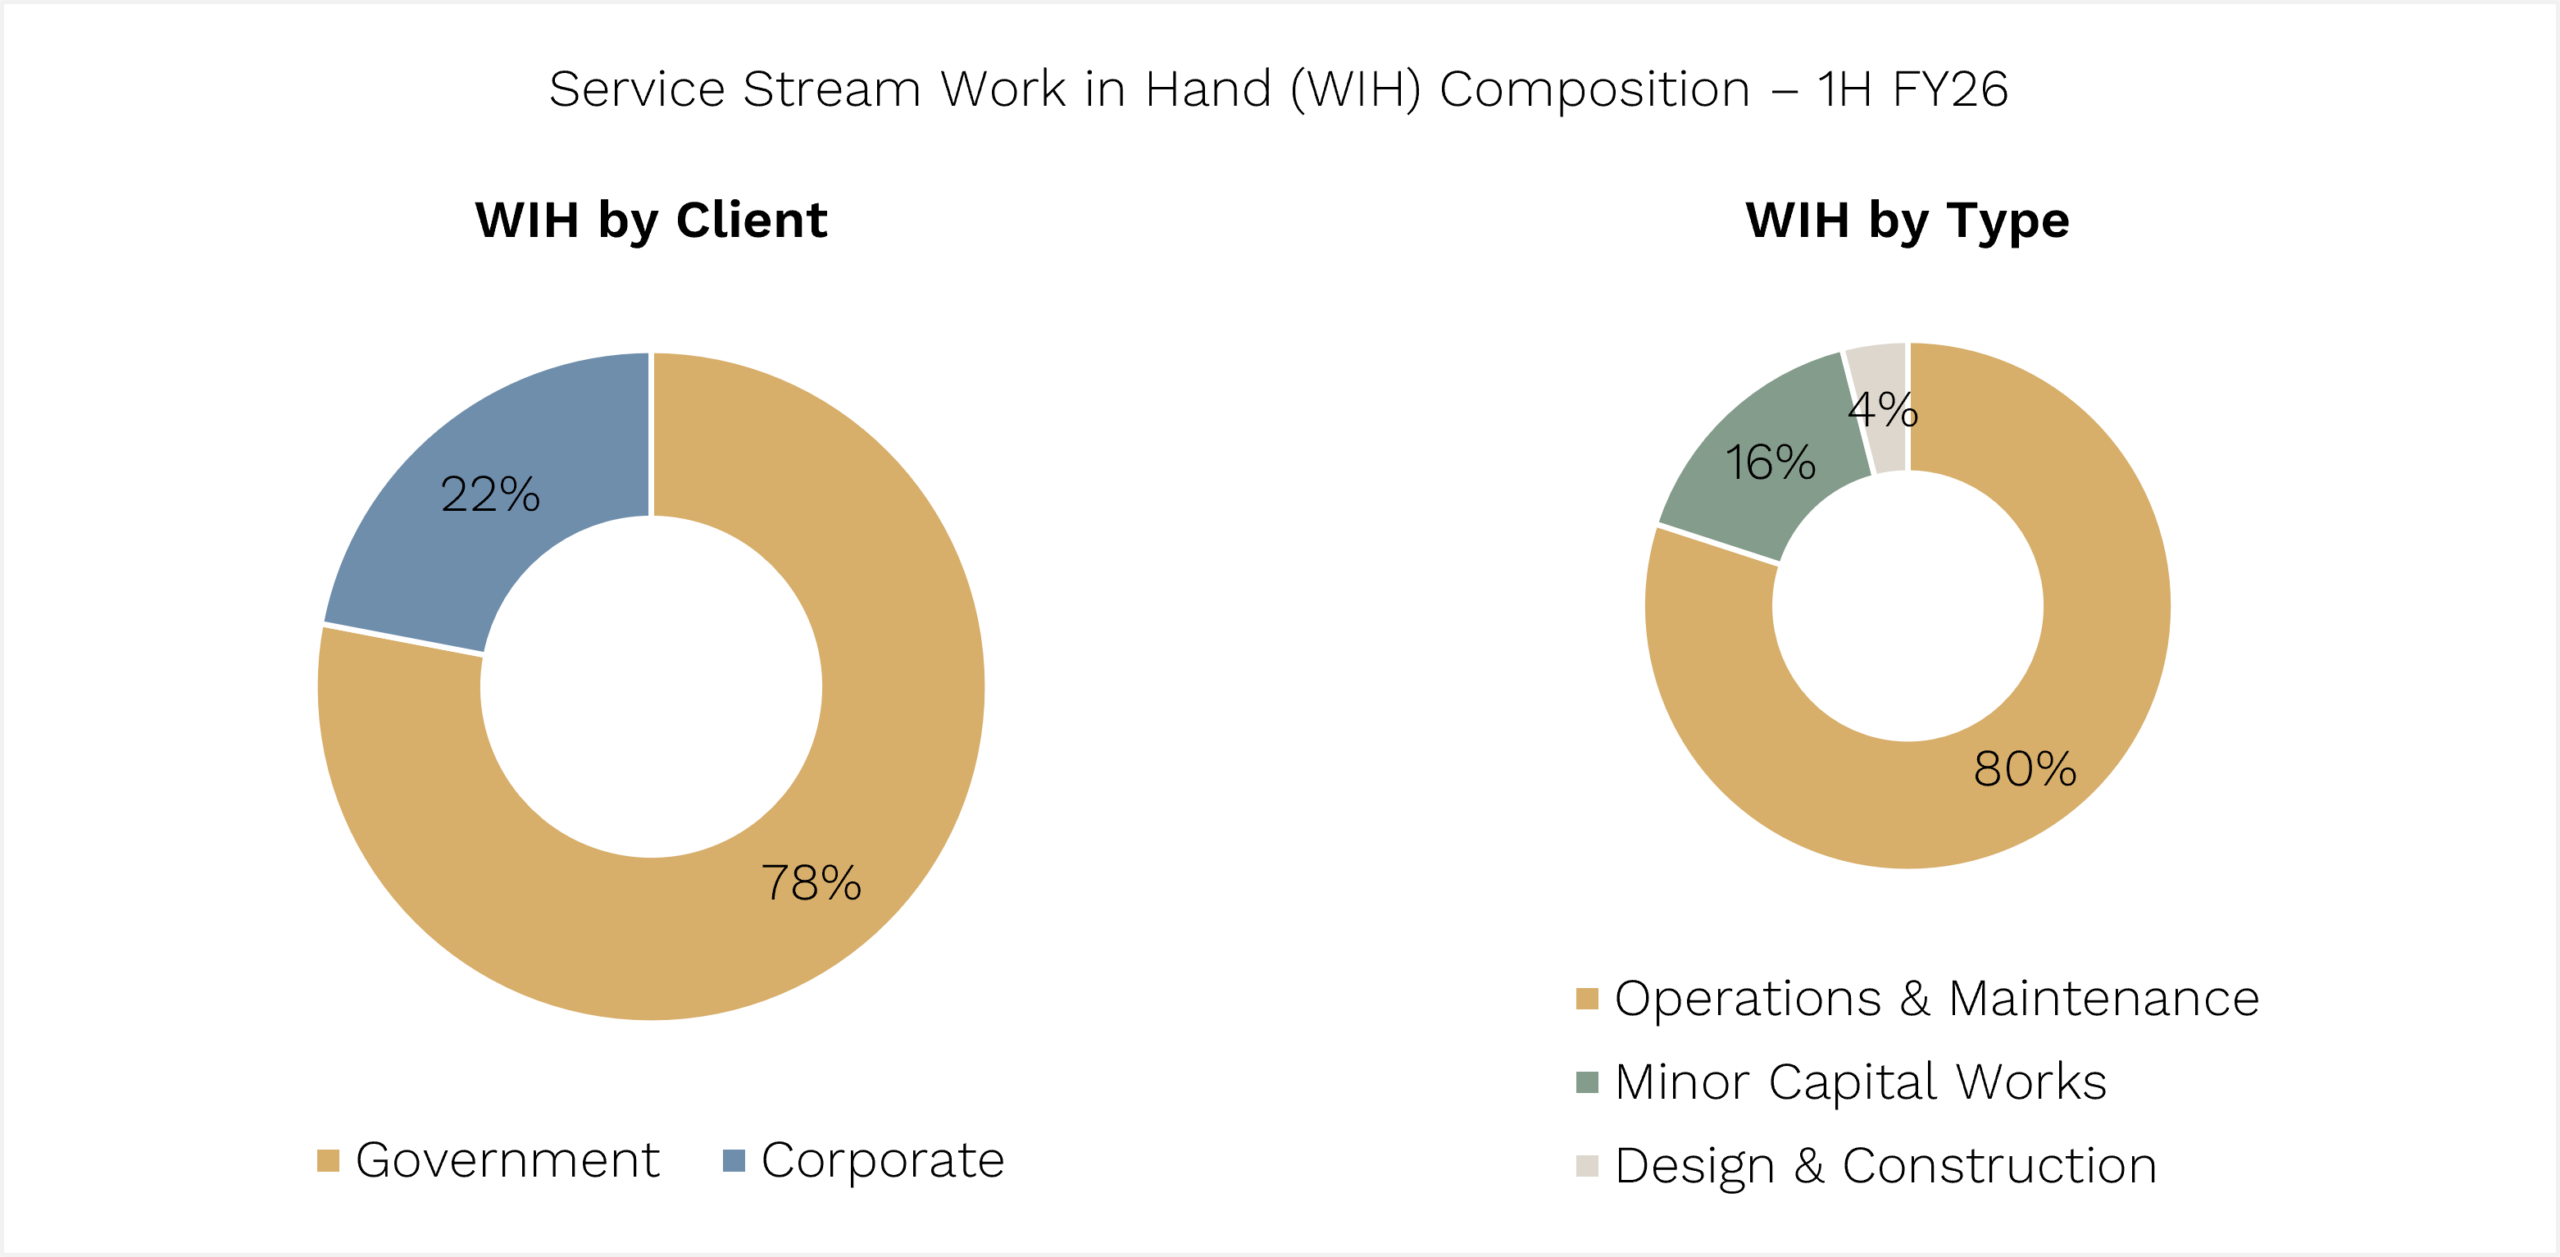
In 1H26 alone, the company secured $2.2 billion of new multi-year operations and maintenance (O&M) agreements and strategically renewed 93% of existing contracts that proceeded to market. Total Work in Hand (WIH) has grown 55% on the prior corresponding period to $9.2 billion, with an additional $6 billion in extension options on top.
Source: Service Stream FY26 Half Year Results Presentation.

Average contract tenure is now 17.5 years.

Since the 1H result, Service Stream has continued to add to that order book. Recent announcements include:

  • A nine-year, $405 million contract with Yarra Valley Water under its Maintenance Services Delivery Partners program (mobilisation October 2026),
  • Two contracts with Millmerran Operating Company at its Queensland power station worth a combined ~$50 million over three years.

These wins illustrate exactly what a diversification strategy is designed to deliver: more water, more industrial, more power.

In a contractor, Work in Hand growth of this magnitude doesn’t show up in the P&L immediately. It shows up over the following 2-3 years as new contracts mobilise and existing ones extend at improved margins.
Source: Service Stream FY26 Half Year Results Presentation.

The market is treating Service Stream’s headline FY26 numbers (revenue down 5.8% on previous corresponding period due to the 1H25 telco skew) without giving credit for the order book that sits behind them.


Optionality on top

Management has indicated they continue to actively assess M&A opportunities to expand service offerings, capabilities, and addressable markets.

Past acquisitions have focused on quality and have been bedded down well. With ~$100 million of net cash expected to be available outside of leases by FY27, a sensibly priced bolt-on at ~8x EV/EBIT would add another ~9% to earnings on top of the organic upgrade we already see.


The offshore lens

It is worth stepping back and putting Service Stream in the context of its global peers, because the Australian market does not always price contractors the way the US market does.

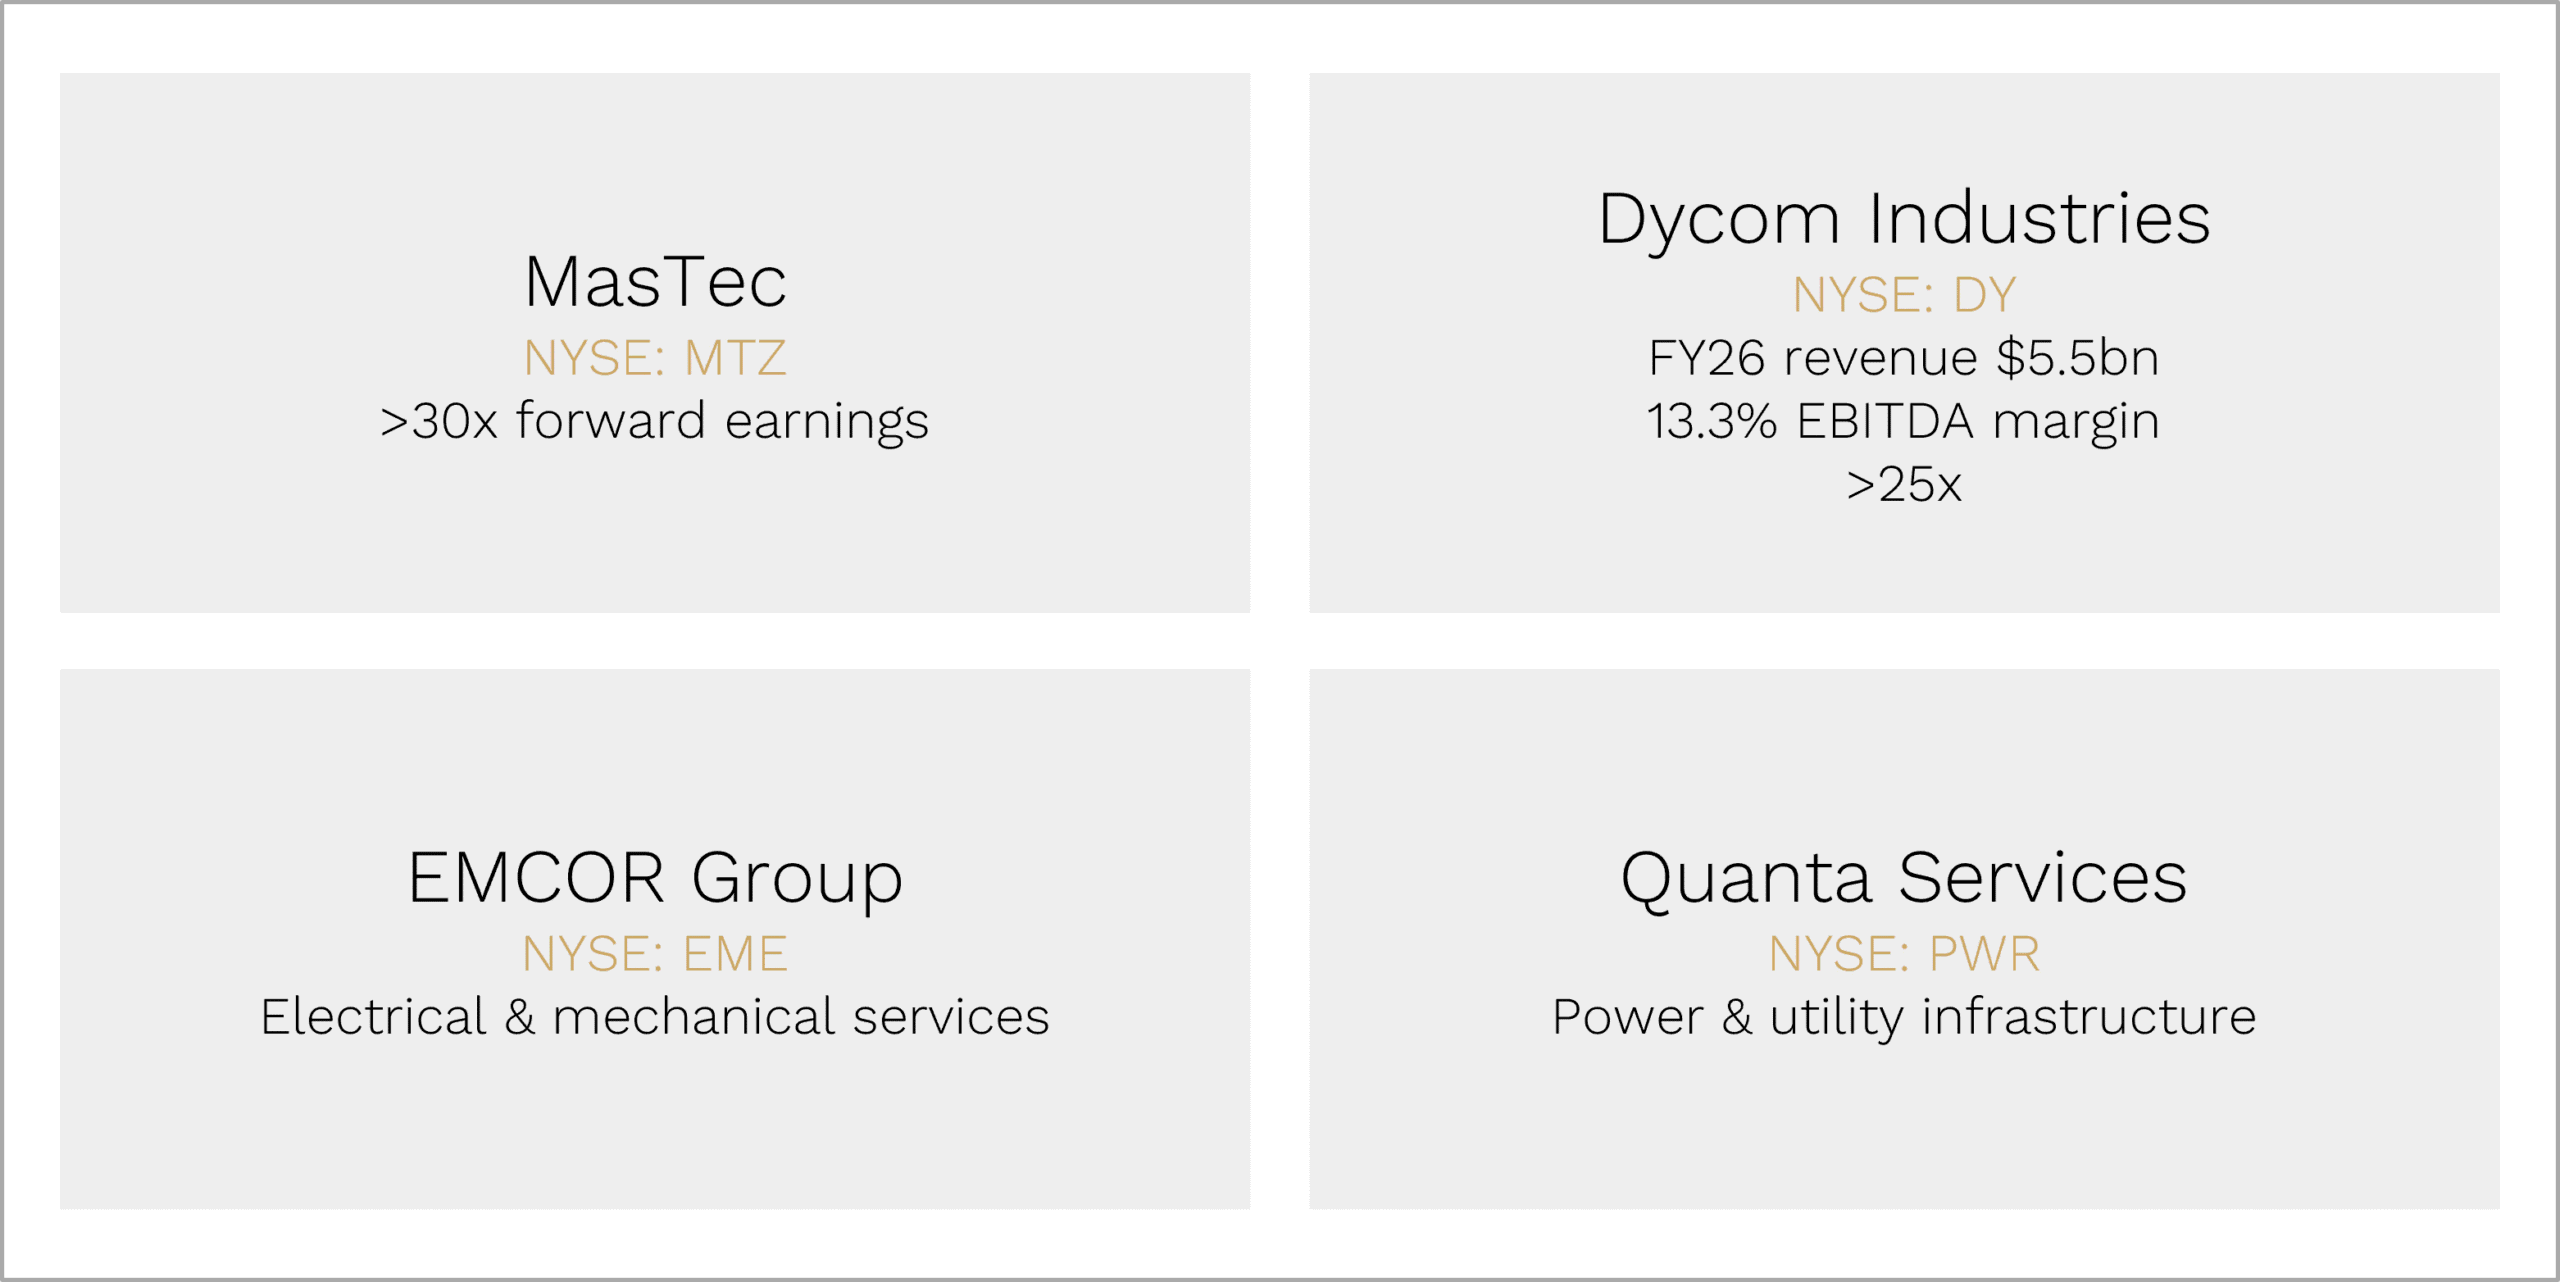
In the US, the listed network and infrastructure services contractors – Dycom Industries (NYSE: DY), MasTec (NYSE: MTZ), EMCOR (NYSE: EME), and Quanta Services (NYSE: PWR) – trade on materially higher multiples than their Australian counterparts.

Dycom, for example, has just reported FY26 revenue of US$5.5 billion at 13.3% adjusted EBITDA margins, with a backlog of more than US$8 billion, and trades on more than 25x forward earnings. MasTec sits even higher at around 35x.
Source: Ophir, Bloomberg.

The drivers are not identical to Service Stream, US peers benefit more directly from fibre-to-the-home buildouts, data centre construction, and the AI-driven power infrastructure cycle. But the structural features investors are paying premium multiples for, long-dated O&M contracts with blue-chip customers, recurring revenue, net cash balance sheets, and operating leverage from incremental volume, are exactly the features Service Stream now has. And who knows … maybe data centres are next for Service Stream!

The US private market reinforces the point. ITG Communications, a private US network services provider, has been on an aggressive acquisition spree (Quasar in December 2025, Advantage Utilities in November 2025, and others), backed by global alternatives firm Oaktree Capital. Private capital is paying up to consolidate this category, even as Australian listed peers in the same category trade at material discounts to global comps.


Looking ahead: arguably a higher-quality earnings stream

Service Stream’s management has guided earnings growth in FY26, with a traditional 2H bias driven by the mobilisation and scaling of new operations including Defence.

We believe consensus FY27 EBITDA of ~$180 million is too low. We see upside risk to earnings as utilities margins continue to expand, telco grows modestly, and Defence begins to contribute meaningfully.

Service Stream is currently trading on around 18x consensus FY27 earnings, which, given our earnings expectations, is overstated and should be closer to ~14x.

For reference, Ventia trades on ~18x, Downer on ~17x, and smaller specialist contractor SRG well above 24x. It could be argued that Service Stream has a higher-quality earnings stream than some of these. More annuity, less Design & Construct, with a net cash balance sheet and clearer earnings upgrades ahead.
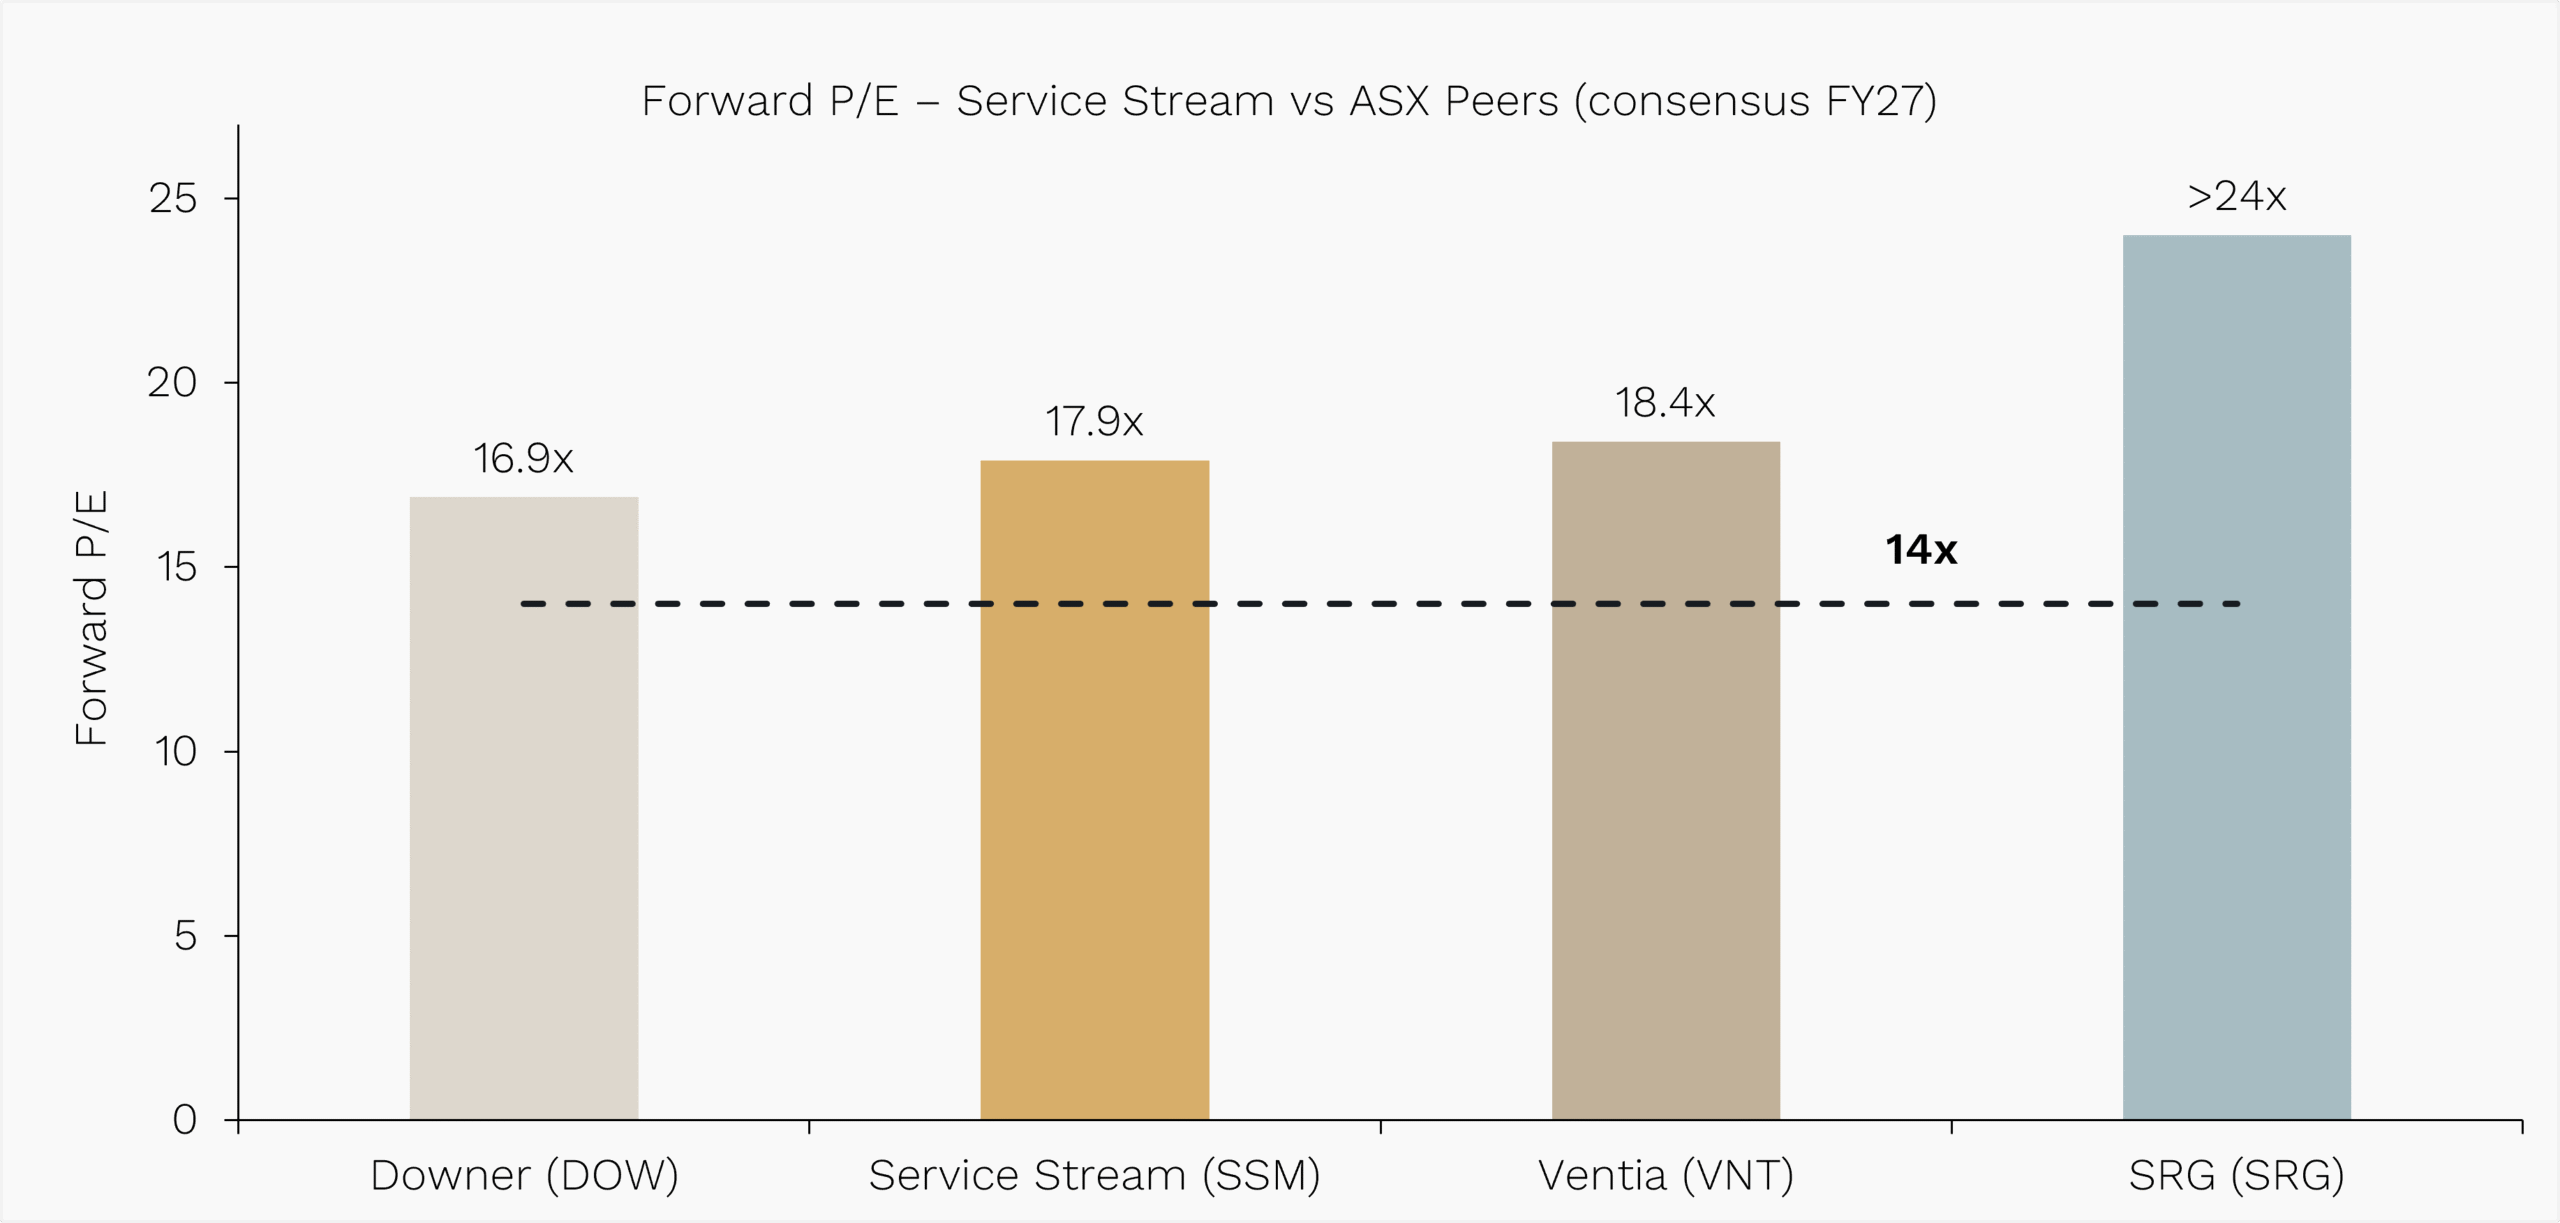
Source: Ophir, Bloomberg.


Why it fits this environment

In a market consumed by the AI debate, where every software business is being asked whether its cash flows are durable at all, Service Stream is the other side of the coin.

Its earnings are tied to ageing infrastructure that has to be maintained, telecommunications networks that have to be operated, water assets that have to keep flowing, and defence sites that have to stay functional. None of this changes if AI model capability doubles next year. None of it changes if the macro slows. The work simply has to happen.

It is, in short, the kind of compounder that doesn’t need a benign macro to work. It just needs the infrastructure of modern Australia to keep running – and that, increasingly, runs through Service Stream.


Previous

11 Jun, 2026 FY26 Distribution Estimates

Next

16 Jun, 2026 Letter to Investors - May 2026
14 May, 2026

Stock in Focus – Marex (NASDAQ: MRX)

Stock in Focus • 8 mins read

Back to Insights Back to Insights

PDF

The plumbing of global markets

Some of the best businesses in the world are the ones nobody talks about at dinner parties. Toll roads. Pipelines. Stock exchanges. Payment networks.

The common thread is that they sit in the middle of something essential, charge a small fee for every transaction that flows through, and are extremely difficult to dislodge.

They tend to be regulated. They tend to compound quietly. And they tend to be valued accordingly – on premium multiples that reflect the durability of the cash flows.

But every now and then, the market hands you one of these businesses at a fraction of the multiple it deserves.

One is clearing broker Marex (NASDAQ: MRX).

Its shares are trading at a discount to its closest peers simply because the market is failing to appreciate that it is, in essence, a structurally protected, infrastructure-style compounder.


A great business

Marex is one of the largest clearing brokers in the world. One of only ~60 Futures Commission Merchants (FCM) globally, it sits in the middle of one of the most essential pieces of financial infrastructure in modern markets.

To understand why Marex is a great business, you need to understand what clearing actually is.

When a hedge fund or an airline trades a futures contract, they don’t trade directly with the exchange. The exchange uses a central counterparty clearing house (CCP) – a regulated utility that becomes the buyer to every seller and the seller to every buyer, mutualising risk across the system. CCPs like Chicago Mercantile Exchange (CME) and Intercontinental Exchange (ICE) charge a fee for this service and trade on premium multiples (around 20x earnings) as they are some of the most prized financial infrastructure in the world.

But CCPs are not allowed to deal with end clients directly. Regulation requires them to be neutral risk utilities, insulated from credit risk. So between the client and the CCP sits a clearing broker – the FCM – that takes on the operational burden, fronts the margin, manages credit, and handles defaults when they occur.

This is what Marex does. They are the firm that absorbs everything the CCP cannot touch.

Source: Marex Investor Presentation, May 2026.

Marex went public in April 2024 when it was the fastest-growing FCM by client assets in the US, and we estimate the company now has more than 10% market share in clearing, up from around 3% in 2022.


Three Structural Tailwinds

But our path into Marex started with a peer and the incredibly strong tailwinds we found for clearing and execution businesses.

We had been doing initial work on StoneX (NASDAQ: SNEX), Marex’s closest listed peer in the US, after StoneX made a transformative acquisition.

We flew to New York to meet with the StoneX team in person and caught up with their management again when they passed through Denver.

Those conversations crystallised something for us: clearing and execution sit in a rare position in financial markets because of three structural tailwinds compounding on top of one another:

  1. Growth in the underlying market.

Total exchange-traded contract volumes have been growing at a high-single-digit pace for years. That’s happening as more activity migrates from over-the-counter markets into centrally cleared venues, more asset classes get listed, and global hedging needs continue to expand.

  1. Share gains from the banks.

International banking regulations, Basel III and Basel IV, have made clearing structurally uneconomic for large bank incumbents, compressing their returns and forcing them to retreat or exit entirely. But the clients haven’t gone anywhere. The activity hasn’t disappeared. It is simply migrating from the banks to a small group of specialist non-bank platforms – of which Marex and StoneX are the two largest listed examples. The result has been a long, slow exit by the banks. The number of FCMs globally has fallen from over 300 in the 1990s to around 60 today.

  1. Consolidation of the fragmented non-bank tail.

The smaller end of the FCM market lacks the technology, capital, and regulatory expertise to compete at scale. The larger specialists – Marex chief among them – are consolidating these books inorganically, improving share, pricing power, and overall market quality in the process.

We usually work hard to find one structural tailwind in most investments. Finding three in the same business is rare.


Building conviction and dispelling doubts

But the more we worked on the sector, the more obvious it became that Marex was the best-positioned name in the space. For a start, it had the highest-quality earnings mix. In a normal quarter, around 80% of group profit comes from the most defensible parts of the value chain: clearing and execution. StoneX had a much smaller weighting to clearing and execution.

Marex also had the best technology platform and the most disciplined M&A track record. Ian Lowitt, the CEO, has built Marex over more than a decade through a combination of disciplined organic growth and a series of well-executed acquisitions. Each acquisition was made at attractive an valuation (often at or below tangible book value) and integrated onto the group’s single global technology platform.

Yet trading on less than 10x forward earnings, Marex had the lowest multiple of its peer group.

Why was Marex’s multiple so low?

One reason was a short-selling report published in August 2025 by short-selling research firm, NINGI Research. Titled ‘A Financial House of Cards’, the report alleged accounting irregularities, off-balance-sheet entities, and conflicts tied to the CEO’s prior career. Marex fell sharply when it was published.

If anything, however, the report helped us. It gave us a discounted entry point and a clear set of bear points to stress-test.

We concluded the short thesis lacked substance and started buying Marex in October 2025.

We went through every claim in the short report ourselves, then with sell-side analysts, then with the company directly. Marex publicly rebutted the report twice. S&P Global Ratings reviewed the allegations and affirmed Marex’s BBB- rating with a stable outlook.


Fantastic financial results

On the morning of their investor day in late March, we caught the red-eye from Denver to New York. Arriving early, we were the first non-Marex person in the conference room and were able to spend time one-on-one with the entire senior management team before the other investors and brokers arrived.

And, importantly, Marex continues to report record financial results.

Adjusted profit before tax has compounded from US$62 million in 2020 to US$418 million in 2025 – a compound annual growth rate of 47%. (Growth was 30% in 2025 alone.) Adjusted EPS came in at $3.99 for 2025, beating consensus by 4.4%.

Source: Marex Investor Presentation, May 2026.

Marex’s recent Q1 2026 result was another record:

  • Revenue was $692 million, up 48% year-on-year.
  • Adjusted profit before tax of $153 million, rose 59% year-on-year.
  • The result was comfortably above the top end of the guidance the company had provided just six weeks earlier at its investor day.

This was achieved despite absorbing a $34 million loss from a single client default in natural gas trading in January – a useful, real-world demonstration that the business is built to take occasional shocks without breaking.

Source: Ophir. Bloomberg data as at 30 April 2026.

The big misunderstanding

Yet despite this strong financial performance and the debunking of the short report, Marex still trades on 10x earnings.

At the heart of this mispricing is an ongoing misunderstanding of what Marex does.

The market is treating Marex as a cyclical commodities broker – grouping it with low-multiple names like Virtu, TP ICAP and BGC.

But, as we saw above, a meaningful portion of Marex’s earnings behaves like infrastructure.

Those earnings are underpinned by sustained sequential growth in its clients’ clearing balances, as well as growth in the market volumes in total contracts cleared. What’s more, its Prime Services business continues to deliver outsized market growth.

CCPs, such as CME and ICE, trade on around 20x forward earnings. Interactive Brokers (which partly overlaps Marex) trades on 32x.

Given Marex sits between a clearing utility and a prime broker, we don’t think it deserves the premium multiples of the likes of CCPs and Interactive Brokers. But we don’t think it deserves to trade like a low-quality commission broker either. (Even StoneX, the closest direct comparison, trades on ~19x.)

Why Marex Fits This Environment

In a market consumed by the AI debate – where every software business is being asked whether its cash flows are durable at all – Marex is the opposite kind of investment.

It is a regulated, mission-critical piece of financial infrastructure. Its moat is created by Basel rules, CCP access caps, and post-2008 clearing mandates – not by software, brand, or distribution.

It benefits from volatility rather than being threatened by it. And the structural shift driving its growth (banks exiting clearing, activity migrating to non-banks) has years left to run.

It is, in short, the kind of compounder that doesn’t need a benign macro to work. It just needs the plumbing of global markets to keep flowing – and that, increasingly, runs through Marex.


Previous

15 Apr, 2026 Stock in Focus – Artivion (NYSE: AORT)

Next

14 May, 2026 Letter to Investors - April 2026
15 Apr, 2026

Stock in Focus – Artivion (NYSE: AORT)

Stock in Focus • 7 mins read

Back to Insights Back to Insights

Building with surgical precision

PDF

Have you ever had a family member rushed into emergency surgery for an aortic dissection? Then you’ll know it’s one of medicine’s most terrifying experiences.

The aorta – the body’s largest artery – carries blood from the heart to the rest of the body. When it tears, every minute counts.

Treating these conditions requires some of cardiac medicine’s most complex and high-value surgical procedures. And behind many of those procedures sits a company most investors have never heard of: Artivion.

Artivion (NYSE: AORT) is a ~US$1.8 billion medical device company headquartered near Atlanta, Georgia, focused exclusively on aortic disease.

Their product portfolio spans four key areas: aortic stent grafts, the On-X mechanical heart valve, surgical sealants (BioGlue), and implantable human tissues. They sell into more than 100 countries worldwide.

We’ve been deeply engaged in Artivion for several years and believe the company is in the middle of a multi-year, product-led growth phase that will extend to the end of the decade.

The recent pullback in the stock – down roughly 25% from its November 2025 highs – has allowed us to re-enter (we first bought pre-COVID then sold at the 2025 highs) at a valuation that is deeply mispriced.


Finding Artivion … and Pat

We first discovered Artivion on a trip to Atlanta in early 2019 when visiting several companies. During that visit, we met with Artivion’s CEO, Pat Mackin.

Pat explained how he had spent over a decade at Medtronic, one of the largest medical device companies in the world. His last role was Senior Vice President presiding over the Cardiac Rhythm division – at the time, Medtronic’s largest business unit.

Pat joined what was then CryoLife (the company rebranded to Artivion in 2022) because he saw a big opportunity: building a company focused solely on the aorta.

By concentrating on the cardiac surgeon customer base, and with a single, focused sales force selling several product families to a large total addressable market (TAM), Artivion could gain significant operating leverage.

What we saw was a company with a market cap of sub-US$1 billion and revenues of sub-$250 million, run by an extremely high-quality manager who had left a $5 billion business segment because he believed he could not only compete with it, but beat it and take meaningful share.

At the time, the company had just two analysts covering it.

It was one of the clearest value creation stories we had encountered.


A Decade Assembling a Comprehensive Aortic Portfolio

When we first met Pat in early 2019, he had been at the company a little over four years and had already begun materially reshaping its portfolio.

He sold several non-core products and, through a series of acquisitions and partnerships that now form the backbone of Artivion’s product roadmap, he’d started realigning the business exclusively toward the aorta.

Between 2016 and 2020, there were four key strategic moves:

  1. The first major move was the acquisition of On-X Life Technologies in January 2016 for ~$130 million. That brought the On-X mechanical heart valve into the portfolio and strengthened the company’s presence in aortic valve replacement.
  2. The following year, in December 2017, came the pivotal deal. In a ~$250 million transaction, Artivion bought JOTEC, a German developer of advanced endovascular stent grafts (minimally invasive surgery to repair an aneurysm). This gave Artivion immediate access to the ~$2 billion global stent graft market and significantly expanded its minimally invasive aortic capabilities.
  3. Then in 2019, Artivion entered a strategic partnership with Endospan for the NEXUS aortic arch stent graft system – a catheter-based solution for total endovascular repair of the aortic arch (which supplies blood to the brain, head and arms).
  4. And in 2020, the company acquired Ascyrus Medical for up to $200 million, bringing into the portfolio the AMDS (Ascyrus Medical Dissection Stent) – a hybrid prosthesis designed to remodel the aortic arch in acute Type A aortic dissections.

Pat played a huge role in creating this value. These were competitive processes where he would personally fly out to close deals – including on public holidays and family vacations – to make sure Artivion was the successful bidder against larger, better-capitalised peers.

The result is a comprehensive aortic portfolio – spanning open surgical, endovascular, hybrid, and valve solutions – that now tracks from the heart down to the bottom of the aorta in the most complex, high-value areas of aortic surgery.

Source: Artivion Corporate Overview February 2026.

New Products Set to Accelerate Growth

Artivion is particularly compelling now because its new products are set to accelerate growth.

Nearly $500 million of new TAM is opening up in the next 12–18 months through key products, AMDS and NEXUS.

Source: Artivion Corporate Overview February 2026.

These are not speculative launches. Both products have already been used in Europe with CE Marking approval (which allows products to be sold in the European Economic Area). That gives us a high degree of confidence in their clinical profile. The risk here is regulatory timing, not clinical efficacy.

Meanwhile, On-X continues to compound. It has grown at double digits for over a decade and now represents almost 20% of the business. New clinical data has demonstrated a mortality and reoperation benefit in patients aged 65 and over compared to bioprosthetic valve (made from animal tissue) alternatives. That effectively opens a new $100 million annual US market that Artivion can pursue.

For the full-year 2025, Artivion delivered $444 million of revenue (13% adjusted constant currency growth), $90 million of adjusted EBITDA (26% growth). For 2026, the company has provided guidance of revenue of $486–504 million and adjusted EBITDA of $105–110 million.

Source: Artivion Corporate Overview February 2026.

Stent grafts represent approximately $200 million, or 40% of Artivion’s revenue today. This segment grew 44% year-on-year in Q4 2025 (36% on a constant currency basis).

We believe the upcoming product launches can facilitate a ~25% compound annual growth rate (CAGR) in revenue for stent grafts over the next three years, which in turn means the company can deliver double-digit growth at the group level through the end of the decade.


The Edge: Dozens of Conversations with Cardiologists

What has given us added confidence in Artivion is that we have spoken to dozens of cardiologists based in the US and Europe regularly over the past two years, as well as pre-COVID when we first invested.

This gave us a strong sense of new product adoption, competitive positioning against larger peers, and emerging technologies.

We’ve also spoken directly with ex-sales reps and competitors over the years.

The cardiologists are key.

Their sentiment toward Artivion continues to be very positive, and awareness is growing, which will facilitate higher product cross-selling in the future.

The concentrated nature of the cardiac surgeon customer base means that word-of-mouth and clinical evidence travel fast. That dynamic favours a company with differentiated products and a dedicated sales force.


Materially Mispriced

Despite this strong market position and mid-20% EBITDA CAGR outlook, Artivion currently trades on mid-teens EBITDA.

We think that is materially mispriced.

Additionally, trading at ~3.5x sales, the company will likely attract acquisition interest from a larger peer at 5–7x sales given the attractive and relatively low-risk growth rates, large TAMs, and high potential synergies from duplicative sales forces. That implies significant upside from current levels.

The stock has pulled back from its November 2025 highs on a combination of conservative management guidance into a year of elevated capex (~$50 million, up from $39 million) and outsized funding requirements for earn-outs.

Last year, the market did get ahead of itself and priced in an acceleration of product-led growth into 2026. But when the timeline reverted to the original 2027 trajectory, the share price gave back those gains.

Still, for us, this was the opportunity because the fundamental thesis hasn’t changed, and we have been able to buy a high-quality, accelerating growth story with over 20% three-year EBITDA CAGR at a ~50% discount to standard sector takeout multiples.

Source: Ophir. Bloomberg.


Exactly what we are looking for in this environment

Artivion is exactly the kind of name we’re drawn to right now: a medtech compounder with product-cycle driven growth, limited GDP sensitivity, and a valuation that reflects neither the clinical pipeline nor the margin expansion runway.

It doesn’t need a resolution to the AI debate to work. It doesn’t need rate cuts. It doesn’t need a benign tariff outcome.

It just needs its products to keep performing – and so far, they are.


Previous

15 Apr, 2026 Letter to Investors - March 2026

Next

14 May, 2026 Stock in Focus – Marex (NASDAQ: MRX)
11 Feb, 2026

Strategy Note - SaaSpocalypse Now?

Stock in Focus • 6 mins read

Back to Insights Back to Insights

PDF

SaaS versus Semis

For this month’s Stock in Focus, we’re doing something a little different.

Rather than spotlighting a single company (though we will highlight one), we’re zooming out to explore a significant rotation: The growing dispersion between software and semiconductors, particularly within the broader AI thematic.

Both groups sit under the ‘tech’ umbrella, but their near-term investor narratives couldn’t be more different.

Put simply:

  • The application layer (SaaS) is being severely punished for uncertainty around the durability of its business models in an AI world.
  • The picks and shovels (semis, AI Infrastructure) are being rewarded for their growth potential and the earnings certainty that AI investment is creating for them.

This dispersion is throwing up big opportunities for Ophir in both application companies and semis, but we are mindful of managing downside risks as debates about the impact of AI continue to play out.

Source: Ophir. Bloomberg.


The Software Shakeout: Zero-Seat Threat

The woes of the software sector started as a slow bleed in the second half of 2025 when it became clear AI investment would skew heavily toward infrastructure, rather than application-layer enhancements. Investors began recalibrating growth expectations for software businesses.

But then the software sector was rocked on January 12 when Anthropic released its Claude Cowork preview. It showcased autonomous agents that could perform complex workflows with minimal human input.

This wasn’t just another chatbot. It highlighted that entire seat-based workflows (licensing models based on the number of users) could be replaced.

For the past decade, enterprise SaaS companies have grown alongside corporate headcount. Products were priced ‘per seat’, and forward multiples assumed that more humans meant more licences.

But if AI agents can perform a week’s worth of work in a day, the unit of value in software – the human seat – comes under serious structural pressure.

This is the Zero-Seat Threat.

While big-cap incumbents like Salesforce (CRM) and Adobe (ADBE) have launched AI initiatives (Agentforce, Firefly) to defend their moats, these have yet to translate into a tangible revenue uplift, and investors fear that incumbents are simply running to stand still.

When long-duration stocks lose revenue predictability, multiples compress quickly. Morgan Stanley’s SaaS index forward earnings expectations are now trading on ~15x, compared to a 30-40x range since mid-2022.

Source: Ophir. Bloomberg.

The software sector is now showing its weakest technical breadth since 2018. The S&P North American Software Index recently hit it’s most oversold level ever based on its 14-day RSI (relative strength index) – even more than in the tech wreck of 2001!

Source: Ophir. Bloomberg. U.S. Software Index refers to S&P North American Technology Software Index (SPGSTISO).

Given the quantum and indiscriminate nature of the price moves in the sector, we expect there to be opportunities to invest in companies that have been oversold.

However, we are mindful that as uncertainty persists and the debate around future earnings continues, it will be difficult for many software names to see their multiples re-rate.


Meanwhile in Semis: Earnings Visibility is the New Growth

While software stumbles, semiconductors are going from strength to strength.

Semis are benefiting from both a cyclical rebound and structural AI demand.

It began, of course, with Nvidia, the poster child of the AI build-out, but it’s now expanded into the broader infrastructure stack.

The major driver is huge AI capex.

Microsoft, Amazon, Alphabet, and Meta have all locked into multi-year AI capex plans, committing hundreds of billions each toward training clusters (specialised supercomputers to build large language models) and inference capacity (infrastructure to run AI for users).

In their recent results, all of these companies provided capex guidance for 2026 that was well above market expectations.

This obviously creates surging demand for chips and chip-making infrastructure.

Source: Ophir & Company Reports. Figures in $USD.

Semis have typically been more cyclical, but massive AI capex has given them what investors love – earnings visibility.

With AI being funded in real time, order books are now full, supply is constrained, and lead times are stretched.

This has shifted the entire sector’s narrative from ‘cyclical’ to ‘critical infrastructure’.

At the same time, semis are benefiting from a broader macro recovery in PCs and smartphones.


And in January there were several key events that added more fuel to the fire:

  • At CES (Consumer Electronics Show), Nvidia CEO Jensen Huang called out memory and storage as the next AI frontier.
  • Samsung and Micron said the price of memory was increasing 40-50%.
  • TSMC came out with really strong capex guidance of ~US$52-56 billion, which was well above market expectations.

As a result, memory and storage names have continued to surge, including (approximate 1-year returns) SanDisk (+1,520%), Seagate (+335%) and Western Digital (+450%).

Silicon Motion Technology Corp (Nasdaq: SIMO)

A key holding for us in the storage space is Silicon Motion (SIMO), which performed strongly in January following CES.

The company is a global leader in the semiconductor industry, specifically acting as the ‘brains’ behind modern storage.

Silicon Motion is a ‘fabless’ company, which means they design the hardware and software but outsource the actual manufacturing to foundries like TSMC.

The company designs NAND flash controllers. A controller is a small processor that manages how data is stored, retrieved, and protected on NAND flash memory (the chips found in SSDs and smartphones).

Silicon Motion’s products are found in:

  • Solid State Drives (SSDs): Used in PCs, laptops, and data centers.
  • Mobile Storage: eMMC and UFS controllers used in smartphones and IoT devices.
  • Specialty Solutions: Industrial-grade and automotive storage (e.g., in-vehicle infotainment and ADAS).

Source: Ophir. Bloomberg.


Managing Exposure Across the Stack

So how is Ophir playing this dynamic?

From our seat, this isn’t just about picking winners amidst an ever-shifting debate and material share price movements.

It’s about managing risk and not doubling down when stocks could de-rate further.

We believe in application-layer AI, but the market will take time to separate the winners and the survivors from the losers and the disrupted.

And while we remain exposed to some AI infra winners, we’re conscious that ‘earnings certainty’ trades rarely last forever as the market eventually overcapitalises future earnings and pays too high of a multiple.

While we will selectively invest in SaaS names that have cash flow support and have catalysts to reduce uncertainty, we won’t be relying on a recovery in software or a continuation of semi strength to drive future performance.


Previous

11 Feb, 2026 Letter to Investors - January 2026

Next

17 Mar, 2026 Letter to Investors - February 2026
16 Dec, 2025

Stock in Focus - Zeta Global (NYSE: ZETA)

Stock in Focus • 5 mins read

Back to Insights Back to Insights

PDF

Finding Alpha in Zeta

In a sea of marketing tech companies competing for attention, Zeta has quietly established itself as one of the most compelling players in the space. But it hasn’t all been smooth sailing, especially when it listed.

We first met Zeta in 2021 during a virtual roadshow shortly after what can only be described as a disastrous IPO. Just after listing, the analyst from the bank who listed the stock came out with a Neutral recommendation and a price target below the listing price. This contributed to the stock falling nearly 50% post IPO, and for a while, Zeta became a name most investors avoided.

So we took a meeting, did the work, and came away with a very different conclusion.


How We Gained Conviction

Major agency partners are the core customer base in Zeta’s market. After a series of diligence calls, we found repeated evidence of Zeta’s superior return on ad spend (ROAS) compared to the incumbents. We also sat through a two-hour technical demo with Zeta’s product engineers and walked away convinced the platform had the scalability, usability, and performance to support sustained growth with large enterprise clients.

In short, Zeta was misunderstood, but not broken.


Keeping Our Finger on the Pulse

In Q3 2024, with the stock having exceeded our price target, we exited our position. After consistently beating and raising every quarter post IPO, we believed the stock was priced for perfection and the market was paying two years forward. We still liked the story, but felt the set-up required growth to accelerate further.

Source: Zeta Global Investor Day Presentation, October 2025.

As anticipated, guidance wasn’t enough to satisfy the markets’ elevated expectations.

Following the conservative 2025 guide, a short report attacking Zeta’s data integrity was released. This is a classic vulnerability for advertising technology (AdTech) businesses and the stock was sold off aggressively. We had already done deep diligence on Zeta’s data pipeline and knew from customer and partner conversations that the underlying data quality had been reviewed and validated by some of the most sophisticated agency buyers globally.

We believed the short report, while well-timed, was opportunistic. So we re-entered in Q4 2024 at a significant discount to intrinsic value.

Source: Ophir. Bloomberg Data as of 10 December 2025.

What They Do and Why It Works

Zeta is a leading U.S. marketing technology (MarTech) company. Their platform helps large enterprise customers identify, engage, and retain customers more effectively by using predictive AI, real-time signals, and a differentiated first-party data graph.

Unlike traditional software companies that sell you an “empty” database to fill with your own customer data, Zeta provides the software already filled with a massive proprietary dataset of consumer identities and behaviours.

This unique combination allows them to bridge the gap between AdTech (acquiring new customers via ads) and MarTech (retaining customers via email/SMS), a convergence that defines the current industry landscape.

Source: Zeta Global Investor Day Presentation, October 2025.

The Thesis in Focus

Zeta is a classic, Rule of 40 compounder, but isn’t currently trading like one.

  • Organic revenue growth of 20%+
  • EBITDA margins in the low 20s, growing toward 30%+ by 2030
  • Multiple M&A levers to accelerate platform expansion
  • Trades on just ~11x forward EBITDA

With margin expansion and top line momentum both in place, we believe Zeta deserves to re-rate back to the high-teens multiples it saw during prior periods of growth acceleration.

COR refers to Cost of Revenue, S&M to Sales and Marketing, and G&A to General and Administrative expenses.

Source: Zeta Global Investor Day Presentation, October 2025.

What Gives Us the Edge

  • 20+ customer and agency diligence calls across several years
  • Portfolio company usage validation from advertisers and data partners
  • Three separate product walkthroughs with Zeta’s engineers to assess capability evolution
  • Built conviction through multiple cycles — pre-IPO dislocation, post-rally exit, and re-entry after short attack


Why We Still Hold

We held a mid-sized weight going into the most recent result, halved it post-print due to macro uncertainty, and have since increased our position size as macro uncertainty has started to abated (relatively speaking).

  • Q3 results beat EBITDA by ~10%, and consensus for 2026 was upgraded
  • Yet the stock finished flat for the month
  • Multiple is now at its lowest in years, despite ongoing earnings momentum

This isn’t about betting on the macro, but if risk sentiment improves, Zeta is well-positioned to slingshot out of this multiple compression phase.

Managing the Beta

It’s important to highlight: Zeta is a cyclical, higher-beta name. And that’s a feature, not a bug.

  • It offers tremendous upside when confidence returns to the macro
  • We believe the downside remains manageable, but it can be volatile during periods of macro uncertainty

For now, we’re happy owning a mid-sized position given the attractive multiple and as the macro backdrop shifts, we can flex the weight accordingly.


Final Word

Zeta may have started its public life under a cloud, but what’s emerged since is a category leader with a clear value proposition, an expanding product suite, and the kind of performance profile that earns loyalty from budget-conscious agency buyers.

With ongoing growth, rising margins, and a valuation that provides more reward than risk, we see Zeta as a name that can quietly compound, then quickly re-rate when sentiment catches up.

Previous

16 Dec, 2025 Letter to Investors - November 2025

Next

21 Jan, 2026 Letter to Investors - December 2025
13 Nov, 2025

Stock in Focus - Exosens (EXENS: FP)

Stock in Focus • 6 mins read

Back to Insights Back to Insights

PDF

Seeing in the Dark

At Ophir, we’re always looking for exceptional businesses sitting just outside the spotlight. That’s how we came across Exosens, the European leader in night-vision components.

We first encountered Exosens – which is based in Merignac, France – through our investment in Theon International (THEON), a night-vision device manufacturer that IPO’d in February 2024. During diligence on THEON, it became clear that a key strategic supplier, Exosens, was a company we needed to know better.

Exosens is the European leader in high-performance electro-optical technologies. It specialises in image intensifier tubes (IITs), the critical components used in night-vision goggles and weapon sights. (The tubes convert low-level light into bright images that humans can see.)

With more than 85 years of experience, Exosens has quietly built a strategic position as a mission-critical supplier to NATO forces, holding 42% global market share in IITs, and 72% market share ex-U.S.

Importantly, Exosens is “ITAR-free”, meaning it is not subject to U.S. arms export restrictions – a major advantage for European buyers seeking sovereign and secure supply chains.

Outside defence, Exosens also supplies radiation detection (24% global share), nuclear control components (38%), and imaging systems for high-end medical, scientific, and industrial use (~7% share overall, focused on niche segments). These non-defence operations provide valuable diversification and help create a steadier, less cyclical earnings base than defence alone.


Company Overview

Source: Exosens Company Report October 2025.

So when Exosens went public in June 2024, we were ready. With a front-row seat for the THEON process, and strong conviction in the electro-optical space, we became a top-five initial holder in Exosens. Since its IPO, Exosens shares have surged around ~130%, supported by growing investor enthusiasm for defence-related stocks.

After a three-day research trip to Europe in September 2025 – where Exosens stood out among 15 company meetings – we increased our position further.

Exosens is one of the most attractive under-the-radar growth stories in the whole defence and industrial imaging landscape. We are confident it will remain a fantastic investment for several key reasons.


1. A Secular Defence Tailwind

The first is that the company is well placed to benefit from surging defence spending in Europe.

The global market for night-vision IITs is highly concentrated. Alongside U.S.-based L3Harris and ElbitUSA, Exosens is the only other player of scale. Importantly, it is the only non-U.S. option with mass production capabilities and NATO credibility.

Europe’s penetration rate for night-vision remains low at ~30%, compared to ~100% in the U.S., offering Exosens significant room for growth.

If Europe’s penetration rate were to increase to 50%, it would imply roughly 400,000 additional devices – each requiring one or two IITs, depending on whether they are monocular or binocular.

Further supporting demand, Germany has announced plans to expand its armed forces by 40–45% by 2030, from approximately 180,000 to 260,000 troops.


Procurement ratio and penetration remain low outside of the U.S.

Source: Exosens Company Report October 2025.

As defence budgets across NATO continue to rise, electro-optics are growing even faster, driven by rising electronics use in warfare; night-fighting capability gaps across Europe; and shifting NATO procurement policies that favour ITAR-free, interoperable technologies.

We believe Exosens is uniquely positioned to capture this growth as the only European manufacturer producing mission-critical IITs at scale.


2. A Clear Vote of Confidence from THEON

Further supporting our thesis is that THEON recently entered into an agreement to purchase a 9.8% strategic stake in Exosens at a ~25% premium to the last close prior to the announcement (EUR54.00 per share).

The rationale for THEON’s deal with Exosens is two-fold:

  • It strengthens THEON’s relationship with Exosens as its key supplier for image intensifier tubes, thereby mitigating supply risks in the near term; and
  • It lays the ground for future collaboration on digital technologies which can provide further capabilities to night-vision products and other product segments.

We see this as a strong validation of both Exosens’ strategic importance and the robust demand outlook for THEON’s products.


3. Diversification and M&A

The third reason is Exosens’ track record of successfully diversifying through acquisitions.

Since 2022, Exosens has completed eight acquisitions, expanding its reach into nuclear, detection, and industrial control markets. These deals bring not only incremental revenue but also margin uplift and a more diversified customer base.

Exosens has also attracted suitors of its own. In 2020, U.S. electro-optical conglomerate Teledyne (TDY) made a bid for Exosens at roughly 11x EBITDA – before the surge in valuations following the Ukraine conflict. The bid was blocked by the French government due to the company’s strategic importance, and Teledyne went on to acquire FLIR Systems (FLIR) a year later for 17x EBITDA.

In calls with former Teledyne employees, we confirmed that the bid for Exosens was driven by its superior technology and market access – reinforcing our conviction in the quality and positioning of the business.


4. High Margin Optionality: Drone Imaging

The final reason for our confidence in Exosens’ ongoing success is the massive potential in drones.

Exosens also supplies imaging technology to the drone market, though it is not yet a material contributor to group earnings. Our research with a dozen global drone companies suggests this could evolve into a meaningful revenue stream, with incremental margins exceeding 60%. While it may not appear in near-term results, it provides substantial upside optionality for future years.

In our view, the market continues to underestimate the scale of this drone opportunity.

Just look below at the comparison to some Australian-listed companies – Droneshield and Electro Optic Systems – that saw significant share price appreciation on the global defence thematic.

(These two names have given back a lot of the recent gains, which demonstrates the volatility associated with investing in an undiversified business exposed to a ‘hot’ thematic.)

By the numbers, every US$50m of incremental drone revenue would be ~US$30m of EBITDA, adding ~15% to outer year EBITDA.

If even a portion of Exosens’ drone exposure materialises, its earnings base could expand materially and potentially warrant a significant multiple re-rating in line with other high-growth defence and imaging peers.


Gaining Our Edge Through the Fog of War

Exosens has carved out a rare position: a high-margin, IP-rich business with both defensive resilience and offensive growth.

We expect the company to deliver a top-line compound annual growth rate (CAGR) in the mid-teens over the next three to five years, underpinned by strong structural demand and disciplined execution.

We also anticipate continued EBITDA margin expansion driven by operating leverage, scale benefits, and an improving business mix.

Despite this growth potential – and the advantages outlined above – Exosens still trades on an attractive forward 12-month valuation of around ~15x EBITDA.

Source: Ophir. Bloomberg. Data as of November 2025.

Exosens sits at the crossroads of national security, advanced optics, and industrial innovation.

With a growing customer base, increasing optionality in high-growth verticals such as drones, and strong backing from sovereign governments, we believe Exosens stands out as one of the most compelling under-the-radar compounders in the European small-cap landscape today.

Previous

17 Oct, 2025 It's time to start thinking small.

Next

13 Nov, 2025 Letter to Investors - October 2025
10 Oct, 2025

Stock in Focus - Red Violet (NASDAQ: RDVT)

Stock in Focus • 4 mins read

Back to Insights Back to Insights

PDF

Roses are Red, Violets are… Also Red

At Ophir, we leave no stone unturned. During our extensive travel and company visitation programs, we hate leaving any meeting slot unfilled. And that’s exactly what led us to Red Violet all the way back in 2018.

While on a fact-finding mission to Florida to see larger listed and core portfolio companies, this obscure, $100m data analytics company accepted our meeting request.

Within a year, after a full deep dive into the industry, we made our first investment and reinvested in the company earlier this year as we gained confidence growth rates could reaccelerate to above 20%.

Source: Ophir, Bloomberg. Data as of 30 September 2025.

Red Violet is a leading provider of identity verification and fraud prevention analytics. It applies proprietary models to massive, multi-source datasets to help clients across financial services, insurance, real estate, legal, and government uncover who they’re really dealing with in real time, with high accuracy.

Its cloud-native, multi-tenant architecture enables clients to integrate easily, ingest data quickly, and access deep insights across use cases such as:

  • Fraud prevention and detection (e.g. digital payments, e-commerce)
  • Regulatory compliance (e.g. KYC/AML for banks)
  • Risk scoring and mitigation (e.g. insurance underwriting, claims history)
  • Public records and background checks (e.g. for real estate, legal, and law enforcement)


Data Done Differently

Red Violet is one of only a handful of U.S.-listed, micro-cap (<$1bn market cap) Software & IT Services companies with positive net income and a 3‑year revenue CAGR above 10%.

With a Total Addressable Market exceeding $10bn globally, and current market penetration below 1%, we believe Red Violet is in the early stages of a multi-year growth story.

Source: Red Violet Company Presentation – August 2025. Ophir.

Legacy incumbents such as Equifax, Experian, LexisNexis and TransUnion dominate the traditional credit bureau model, but Red Violet is capitalising on key advantages to gain share.

Red Violet’s proprietary data platform, IDI, was built by the same tech team behind LexisNexis and TransUnion’s platforms. This is effectively their third and most refined iteration, incorporating everything that worked well in prior versions and improving on what didn’t. With the lead developer now retired, it’s likely to remain their final iteration, giving Red Violet a uniquely battle-tested and future-proof platform.

Source: Red Violet Company Presentation – August 2025. Ophir.


Red Violet’s architecture allows for:

  • Faster ingestion and integration of new datasets
  • More accurate and dynamic modelling
  • Customisation across customer-specific verticals

Their technological edge, paired with strong customer validation, is allowing Red Violet to take share from legacy players.

  • Revenue is growing at more than +20–25% annually
  • It has 95%+ incremental gross margins, enabling significant operating leverage
  • Long-term EBITDA margins could exceed 60%, with EBITDA compounding at 30%+
  • Red Violet trades on a high-teens multiple of EBITDA, but we see the potential for rerating given its growth, margin profile, and balance sheet strength

Source: Red Violet Company Presentation – August 2025. Ophir.

Interesting Use Cases

Red Violet’s platform is used in ways that go far beyond traditional identity checks:

  • Banks stop fraud in real time on new account openings
  • Retailers flag “multi-drop” transactions to prevent high-value fraud
  • Insurance firms detect repeat claim filers or link disparate records
  • Real estate firms uncover bankruptcies or aliases during screening
  • Law enforcement uses the platform for investigations

This diversity of applications shows how embedded the platform is becoming — and how non-cyclical much of its revenue base really is.


Building Our Edge

We’ve been tracking Red Violet for over seven years. Since our initial meeting in 2018, we’ve:

  • Met with all major competitors, including the big credit bureaus
  • Held calls with dozens of customers across financial services, insurance, real estate, and government
  • Validated the long runway of growth through first-hand feedback on performance, accuracy, and pricing

This early access and sustained diligence has helped us build a high-conviction position before the market caught on.


Best Is Yet to Come

The stock has been a strong performer since our entry, but we think the best is yet to come:

  • Revenue was up 25% in 2024, hitting $75m
  • The business is profitable, with no debt and $36m in cash
  • With continued share gains and vertical expansion, we expect years of compounding ahead
  • And if margins continue to expand, we see 30–40% total shareholder return (TSR) potential annually for 3–4 years
  • With limited analyst coverage it remains a relative unknown today, but as growth continues it will attract more attention

In a world where high-growth, high-margin companies often trade at 30–40x EBITDA, Red Violet’s current high-teens valuation offers meaningful upside from multiple expansion alone.

With its clean balance sheet, niche leadership, and embedded optionality, we see Red Violet as one of the most compelling compounders in small-cap tech today.


Previous

10 Oct, 2025 Letter to Investors - September 2025

Next

17 Oct, 2025 It's time to start thinking small.
8 Sep, 2025

U.S. Reporting Season - Winners, Losers & 6 Key Themes

Stock in Focus • 6 mins read

Back to Insights Back to Insights

PDF

Most of the portfolio companies in our global funds reported their Q2 results in late July and early August.

Our performance during this period was solid with both of our global funds up 4-5%, compared with the benchmark return of 2.1%:

  • We maintained our history of owning more ‘beats’ (companies reporting better-than-expected results) than ‘meets’ and ‘misses’;
  • A similar number of our portfolio companies either upgraded or maintained guidance; and
  • Pleasingly, very few of our holdings downgraded guidance.

At Ophir, we are always looking for companies doing better than the market expects because earnings beats typically translate to share price appreciation.

With no clear business cycle, we entered Q2 with a portfolio designed to work in either a strong or weak macro environment.

That positioning certainly helped our performance.

Two companies that we have recently added to our portfolios, which thrive in strong or weak macro, include Resideo (REZI) (see below for a deeper dive) and Descartes Systems (DSGX).

These sit alongside existing names like IES Holdings (IESC) and AAR Corp (AIR), a group that lets us participate in a recovery while providing downside protection.

We looked at both businesses in more detail previously (here and here).

Below, we look at a winner and loser from results season.

But first, stepping back, there were six key issues and themes that emerged during the period that particularly gained our attention:

  1. Investors take profits

On balance, we saw profit-taking throughout reporting season, particularly for companies whose share prices had run strongly into their results.

Companies that delivered strong quarters, often saw their share prices fade a few days after earnings.

This was particularly the case for companies with a more cyclically dependent second half.

  1. Market breadth widens

The share price fades were a sign that investors were rotating into less well-held names.

This apparent rotation is reflected in the continued widening of market breadth.

Within the Russell 2000 index, the micro-cap subset has been outperforming over the last few months.

Source: Ophir. Bloomberg.

  1. Rate cut prospects boost small caps

As the chance of a Fed rate cut in September increased, we saw this flow into small caps more broadly in August, with the Russell 2000 up 7% compared to the S&P 500’s 2% gain.

Source: Ophir. Bloomberg.

Direct beneficiaries of these lower rate expectations were home builders, building product suppliers and select REITs as the market anticipates housing transaction volumes to recover from their current historically low levels.

  1. Tariff uncertainty continues

Investors questioned companies with tariff exposure that had strong quarterly results. They were concerned that pre-buying ahead of tariffs had pulled forward demand, giving the results a one-off boost.

  1. Tech and healthcare struggle

The reporting season showed little patience for ‘good but not great’.

This was especially true in tech and software, where AI-fuelled names are facing growing fears of commoditisation.

Some examples (that we don’t hold) include The Trade Desk (TTD), HubSpot (HUBS) and Twilio (TWLO), which saw significant drawdowns in their share prices despite relatively solid results.

Healthcare was another tough spot. Investors were concerned about cost-cutting mandates (including RFK Jr. policy noise) and looming cuts to Medicare/Medicaid, and as a result, aggressively rotated out of the sector.

  1. Positive outlooks tempered by caveats

However, when providing forward-looking statements, most companies sounded more constructive than last quarter. Though almost all added a caveat around tariffs and the consumer outlook.

Several also referenced concerns about “a left-field tweet” or regulatory surprise.

This is something investors must get used to under a Trump Administration.


Two results case studies (a winner and loser)

Below, we take a closer look at one winner and one loser from the recent results season.

The Winner – Resideo Technologies (NYSE: REZI)

Spun out of Honeywell in 2018, Resideo operates two distinct business units:

  • Products & Solutions (P&S): Smart thermostats, air quality monitors, fire/security systems, and
  • ADI Distribution: Access control, fire protection, AV, and connected home product wholesaling

We’ve known Resideo for several years and re-initiated a large position ahead of the quarter. Our thesis was simple: The P&S division was quietly outperforming peers; gross margins were improving, and the company’s valuation was highly attractive at <10x earnings.

Source: Ophir. Bloomberg.

What Drove the Result

REZI’s Q2 result delivered on all fronts:

  • Earnings guidance was upgraded due to stronger volumes and better margins
  • A legacy environmental liability from the Honeywell spin was bought out
  • Management announced plans to split the business into two standalone entities, unlocking appropriate multiples for each

Do We Still Own It?

Yes … and we’re still bullish.

The stock has rallied ~40% since our entry, but is still only trading on ~12x earnings.

With operational momentum accelerating, and a likely Investor Day in early 2026 to highlight the long-term earnings potential of each segment, we believe there is still meaningful upside ahead — especially if Fed rate cuts begin to support housing activity.


The Loser – Tandem Diabetes Care (NASDAQ: TNDM)

Tandem is the world’s #2 provider of insulin pumps, with its flagship t:slim X2 product integrating with CGMs (Continuous Glucose Monitors) to automate insulin delivery and improve glycaemic outcomes.

Why We Owned It

Heading into results, we believed the market was overly pessimistic and missing upside from three key drivers:

  1. The launch of the Mobi, which is a smaller, next-gen device;
  2. ASP (average selling price) uplift through pharmacy reimbursement; and
  3. Early traction in Type 2 diabetes, expanding the patient pool.

With the stock heavily sold off prior to the result, we believed downside was limited and that consumables and renewals would provide valuation support.

We did extensive work, including site visits, peer calls, distributor checks, and endocrinologist interviews.

What Went Wrong

The bear case on lower U.S. patient adds played out, and Tandem took a more cautious tone on second-half growth due to a competitor launch.

While Tandem maintained its full-year revenue guidance, the mix shifted toward Europe, and the company trimmed EBITDA guidance (driven by non-cash adjustments).

Source: Ophir. Bloomberg.

Do We Still Own It?

No.

We were frustrated by the magnitude of the sell-off, particularly given revenue was unchanged. But in the U.S. market, perceived share loss is lethal. We are also aware that cheap isn’t a catalyst.

With our channel checks and industry research not as accurate as needed, we decided to exit.

While our thesis may still play out in time, it’s more valuable to reallocate capital to higher-conviction names than try to chase lost ground on Tandem.


Continuing to deliver despite macro conditions

This reporting season reaffirmed our conviction that valuation alone isn’t enough. You need the setup, the positioning, and the execution to all line up.

But we’re encouraged that even in a tough tape, our balanced, fundamentals-driven approach continues to deliver.

Our focus remains on companies with multi-year growth drivers, improving business quality, and compelling valuations… with or without macro support.


Previous

8 Sep, 2025 Letter to Investors - August 2025

Next

10 Oct, 2025 Letter to Investors - September 2025
9 Jul, 2025

Stock in Focus - Vusion Group (VU: FP)

Stock in Focus • 5 mins read

Back to Insights Back to Insights

Read the PDF


20/20 Vusion

When you’re at the supermarket and you see all those price tags that change every other day with deals, specials, or to reflect higher prices have you ever thought to yourself, ‘I’m glad I don’t have to change them.’ Well what if they changed themselves… This transformation is underway for global retail and behind those familiar pricing labels on store shelves there is a multi-billion-dollar company you’ve probably never heard of that is leading the charge.

VusionGroup, (VU-FP), is a French technology company specializing in Internet of Things (IoT) and data solutions for physical commerce. The company has established itself as a global market leader for electronic shelf labels (ESL) and cloud-based software solutions (VAS), supplying retailers with its innovative solutions to enhance store digitalisation.

VusionGroup Product Features

Source: VusionGroup.

We first came across Vusion when spending a week on the ground in Paris to visit a long list of SMID-cap French companies around three years ago. What we discovered was one of the most compelling secular growth stories in global retail technology.

Shelf Control

After closely following the company for nearly a year, we took our position in June 2023. The catalyst? A short report that halved the stock price. At the heart of the bear case was the validity of its contract with Walmart – a major source of growth for Vusion in the U.S – and a large Chinese shareholder potentially selling down.

While definitely not our typical entry catalyst we were fortunately prepared and had done the following…

  1. Spent over a year engaging with the company and built trust in management’s delivery during that time.
  2. Spoke to multiple large U.S. and EU grocery chains about ESL and were already comfortable with the unit-level economics being generated.
  3. Ran channel checks on the company’s Chinese shareholder
  4. Conducted detailed discussions with management to address the other accounting concerns in the report

This allowed us to quickly conclude the short report was weak and the market had overreacted. We bought in on day two, once the dust had settled, at a time when the stock was trading at around €80.

A clear front-runner

Globally, there are four major providers of ESL’s: Vusion and Pricer in Europe, and Hanshow and Solum in Asia. We’ve conducted translated investor calls with Solum, met with Pricer management on multiple occasions, and held industry expert calls on Hanshow.

Through this work, one thing has become clear: Vusion has a material lead in the U.S. market.

The U.S. currently represents only ~5% of the global ESL market compared to ~40–50% for Europe. But with Walmart as a marquee customer and ESL adoption still in its infancy stateside, the U.S. is on track to overtake Europe by 2029 as the largest market globally.

Source: VusionGroup, Ophir.

This market share head start, combined with Vusion’s differentiated software offering, gives the company a substantial runway for growth.

Growth remains in its infancy

Adoption of ESLs in the U.S. remains in the low single digits, with Walmart acting as a first-mover. But the macro backdrop is increasingly favourable: rising labour costs, supply chain volatility, and stockkeeping unit (SKU) proliferation are all improving the payback profile for ESL rollouts.

Importantly, the use case is expanding. ESLs are moving beyond grocery into pharmacy, hardware and other specialty retail, effectively doubling Vusion’s total addressable market.

Source: VusionGroup, Ophir.

We model 25%+ revenue CAGR through 2027, supplemented by high-margin value-added services (VAS) products that Vusion bundles with its hardware. These software solutions, which include dynamic pricing, inventory automation, and theft prevention, are creating recurring revenue streams and best-in-class EBITDA margins that we believe increase Vusion’s competitive moat and customer stickiness.

Source: VusionGroup, Ophir.

Beyond the fundamentals, the technology itself is genuinely exciting. VAS features now enable:

  • Optimised picking for online orders
  • Time-of-day dynamic pricing
  • Real-time inventory auto-replenishment
  • Theft detection and loss prevention

These aren’t just bells and whistles, they’re solutions to real pain points for retailers, helping drive adoption and pricing power. And importantly, they deliver software-like margins on top of hardware deployments.

ESL penetration in the U.S. remains well below Europe despite a significantly larger store and SKU base, a recipe for catch-up growth.

  • U.S. stores: Significantly more locations per chain; often with broader inventory complexity.
  • Pharmacy and hardware: These verticals are still largely untouched and represent major future growth. Just picture an ESL replacement program on your next trip to Chemist Warehouse…

With ESLs moving from “nice to have” to operational necessity, we see a multi-year adoption curve ahead.

Why We Still Hold – The Price is Right!

Despite recent strength in the share price, valuation remains attractive. Vusion trades on ~12x forward EBITDA with 35%+ EBITDA CAGR expected over the next few years. With increasing operating leverage from software and international expansion, we believe this multiple does not reflect the quality or visibility of future earnings.

Source: Bloomberg, Ophir.

We feel like we’ve been told to “Come on Down” and we’re on to a winner with structural tailwinds, an expanding TAM, and operational leverage still ahead. You don’t need 20/20 vision to see further upside from here.

Previous

9 Jul, 2025 Letter to Investors - June 2025

Next

23 Jul, 2025 Press - Inside Ophir's stellar FY25 with Andrew Mitchell (and 5 stock he likes right now)