PDF
Backing up April’s record month in May + Distributions: your time to decide.
In this Letter to Investors, we look at
- How our Funds backed up April’s record returns in May – and why stock picking, not the red-hot AI trade, did the heavy lifting.
- Momentum, AI, semiconductors and memory stocks are going vertical. Should investors worry?
- Micron joining the US$1 trillion club, and the new memory ETF hoovering up money faster than the Mag 7.
- The heroic expectations baked into SpaceX’s record-breaking IPO valuation.
- Ophir Fund distributions are coming. To maximise compounding and wealth building, we reinvest ours – should you? You have until 30 June to decide.
After April’s big returns across our Funds – including the best month ever for our Global Opportunities Fund, up +12.3% (see last month’s Letter) – it was pleasing to back that performance up in May. Every Ophir Fund rose circa 5-6% in absolute terms and outperformed their benchmarks by around 2-4%.
Importantly for us, it was stock picking that again delivered outperformance in May, not some big overweight to the red-hot AI thematic in semiconductor and memory stocks. (More on that below.)
But AI certainly contributed to share markets across the world almost universally rising for the month:
- The S&P 500 led, putting on another +5.3% to hit fresh all-time highs – in the process notching up its ninth straight weekly gain.
- Tech again did the heavy lifting. The S&P 500 IT index rose a whopping +16.0%, following April’s 17.5%.
- In US small caps, the Russell 2000 IT sector put on a combined 52.6% over April-May. Insane!
Domestically, however, the story was much more muted. The ASX 200 rose +1.3% with the RBA’s hiking cycle and the fallout from the Federal Budget weighing on local shares.
Backing it up
As mentioned, all our Funds backed up strong results in April and posted pleasing performances in May:
- Our original Aussie Fund, the Ophir Opportunities Fund, kept up its strong track record. It beat its benchmark by +2.7% in May. Since its inception in August 2012 – almost 14 years ago – it has now returned +23.0% per annum after fees.
- The Ophir High Conviction Fund (ASX: OPH) was back on the leaderboard too after a tougher 12 months, with its investment performance rising +6.2% for the month and outperforming its benchmark by just over 4%.
- And our Global Opportunities Fund backed up its record April with a +5.1% gain in May, against a +3.1% return for its benchmark (MSCI World SMID Cap Index NR AUD), an outperformance of +2.0%.
After April, prospective investors naturally asked us: “Is this a good time to invest? Have I missed it?”
Our answer then was that April’s surge was our companies’ share prices catching up with their strong February/March earnings results.
But just as importantly, we were also cycling out of companies whose share prices had run hard and putting that money into fresh ideas. Those additions started contributing in May. That, to us, is especially encouraging.
AI trade explodes higher in May
There is no polite way to describe what semiconductor and memory stocks did in May. They went vertical!
Exhibit A: Micron.
On 26 May, the memory maker jumped 19% in a single session – after broker UBS more than tripled its price target to US$1,625 – and crossed US$1 trillion in market value for the first time. Its entire 2026 output of high-bandwidth memory (the chips that feed AI data centres) is already sold out.
How hot is the money chasing this trade?
A brand-new ETF dedicated to memory (DRAM) stocks has gone vertical – its inflows are already double what the flagship Magnificent 7 ETF gathered over the last three years.
It’s a measure of the optimism, and perhaps speculation, now built into these share prices.
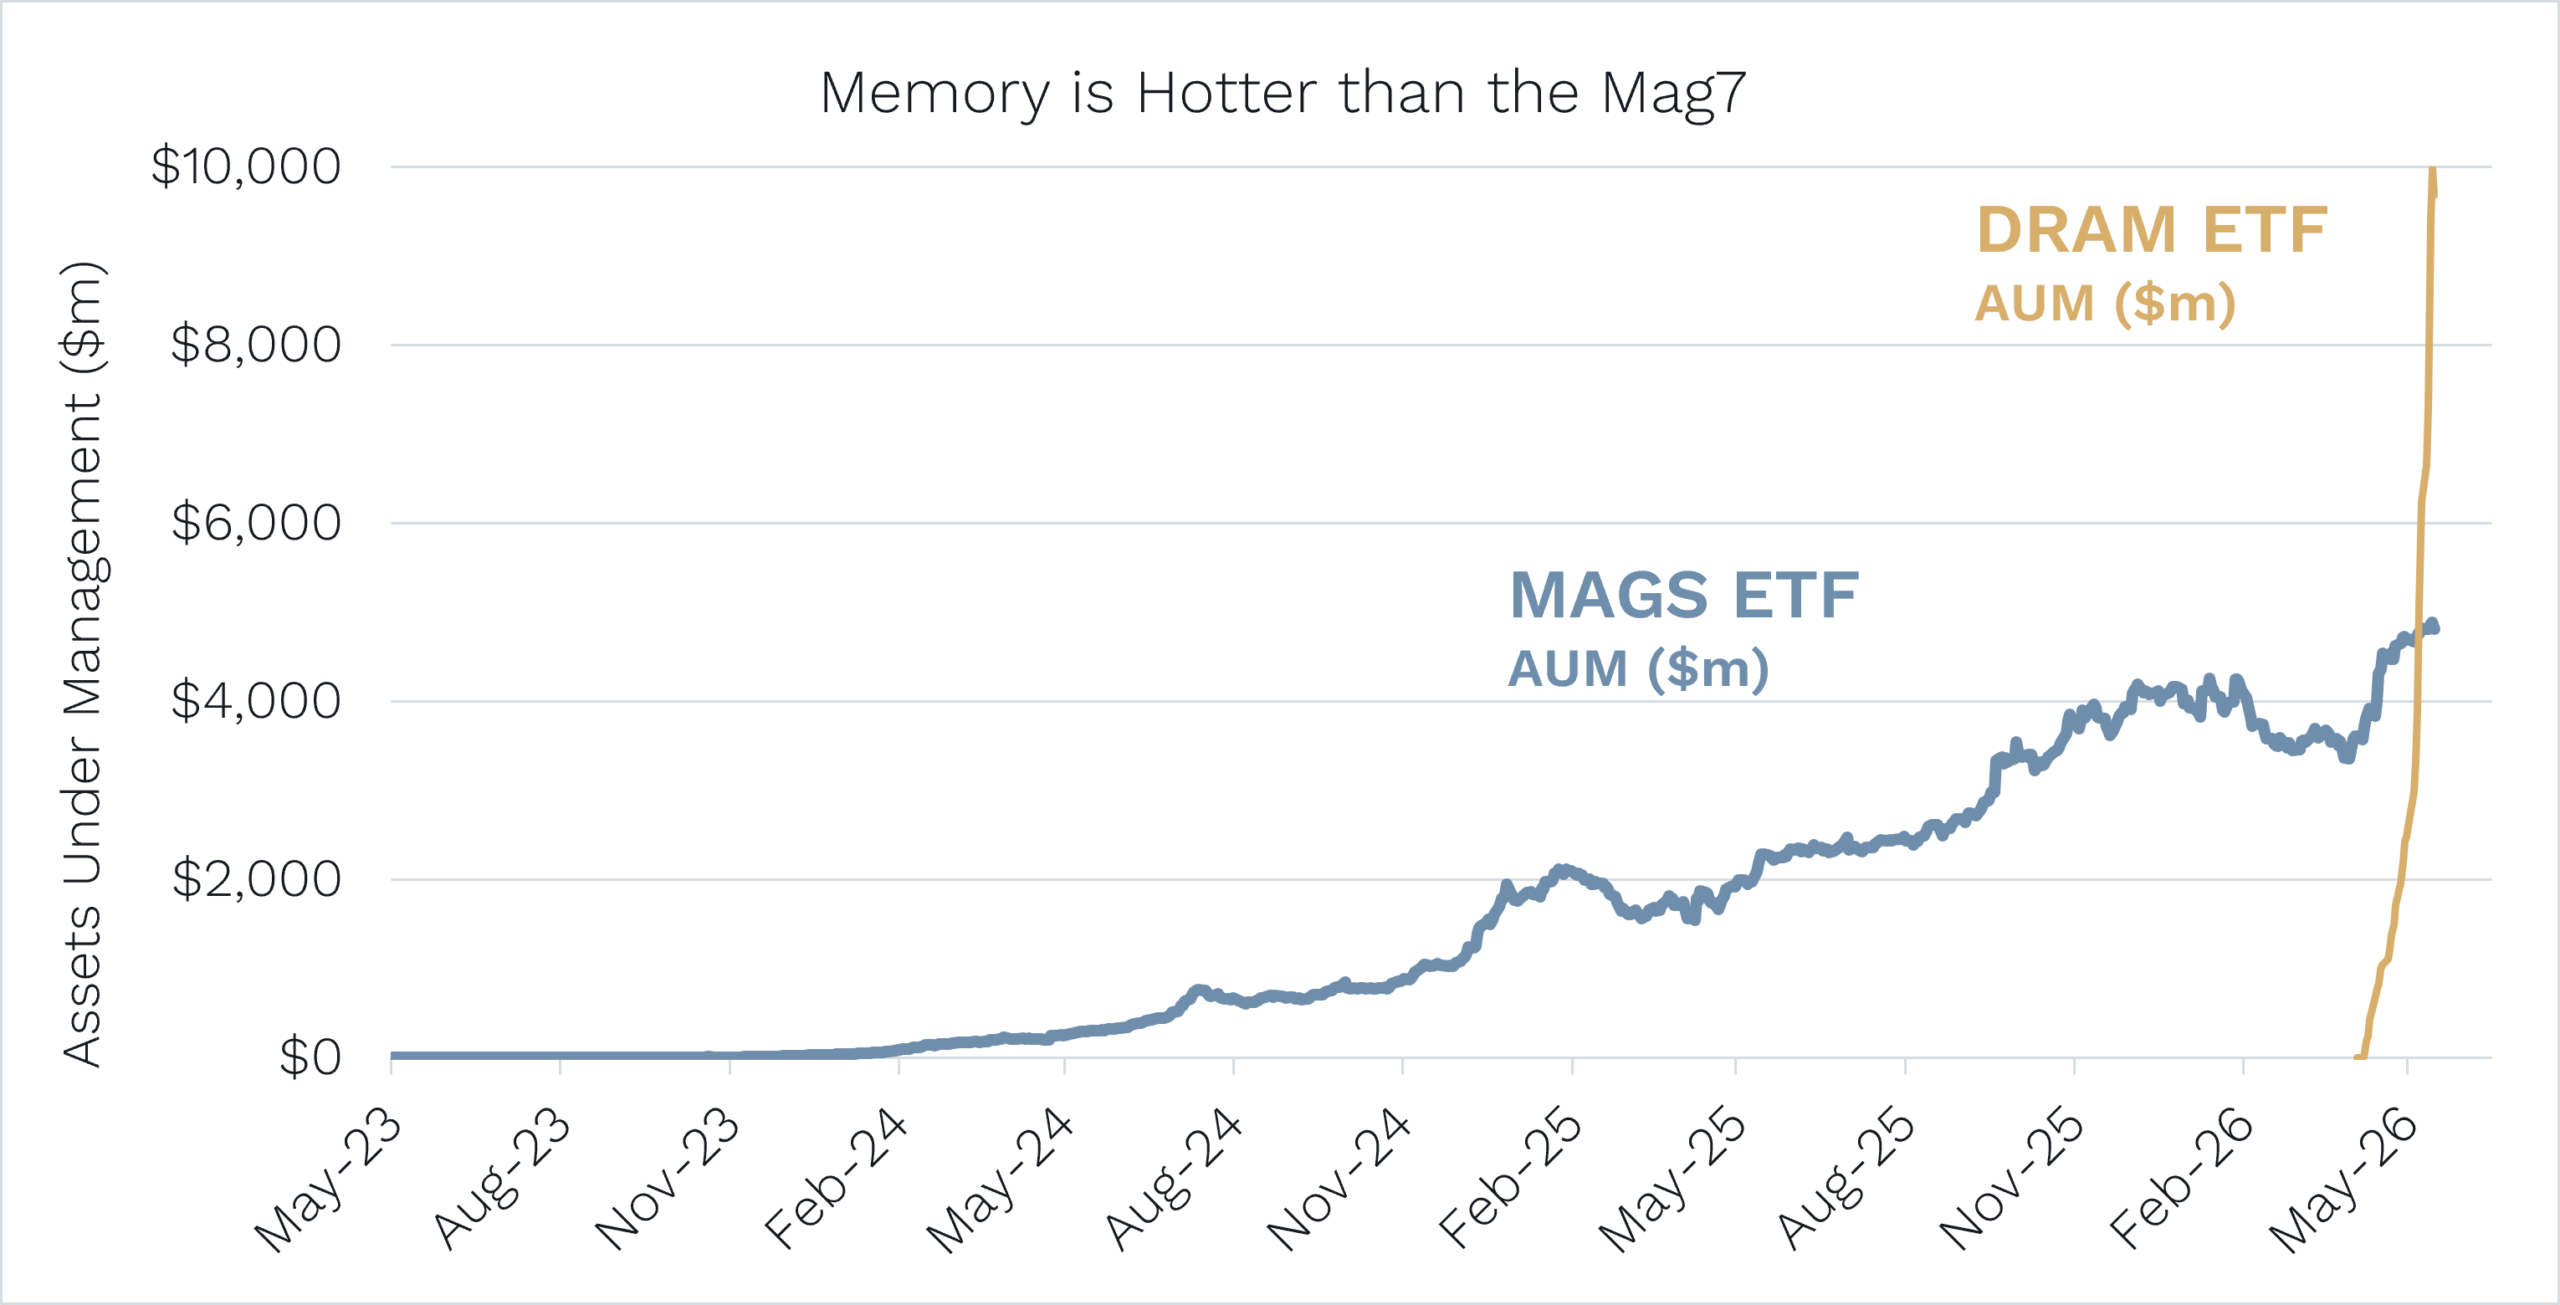
Source: Bloomberg, Roundhill Memory ETF, Roundhill Magnificent Seven ETF
The good news?
The rally – as narrow as it is, led by AI, energy and memory – has been driven by corporate earnings expectations being revised upwards. That gives some confidence it’s standing on reasonable foundations rather than hot air.
It’s also showing up in the economic data. The US economy has been rock solid on the back of the AI infrastructure build-out. Though our conversations with European cyclical companies have been decidedly downbeat – a big part of why we’ve reduced our weight to European cyclicals in recent months. It’s no coincidence that Europe, a net importer of energy, has struggled versus the U.S., a net exporter, during the worst energy crisis in history courtesy of the Iran war. Fortunately at writing it looks like the Strait of Hormuz is reopening for seaborne oil transit.
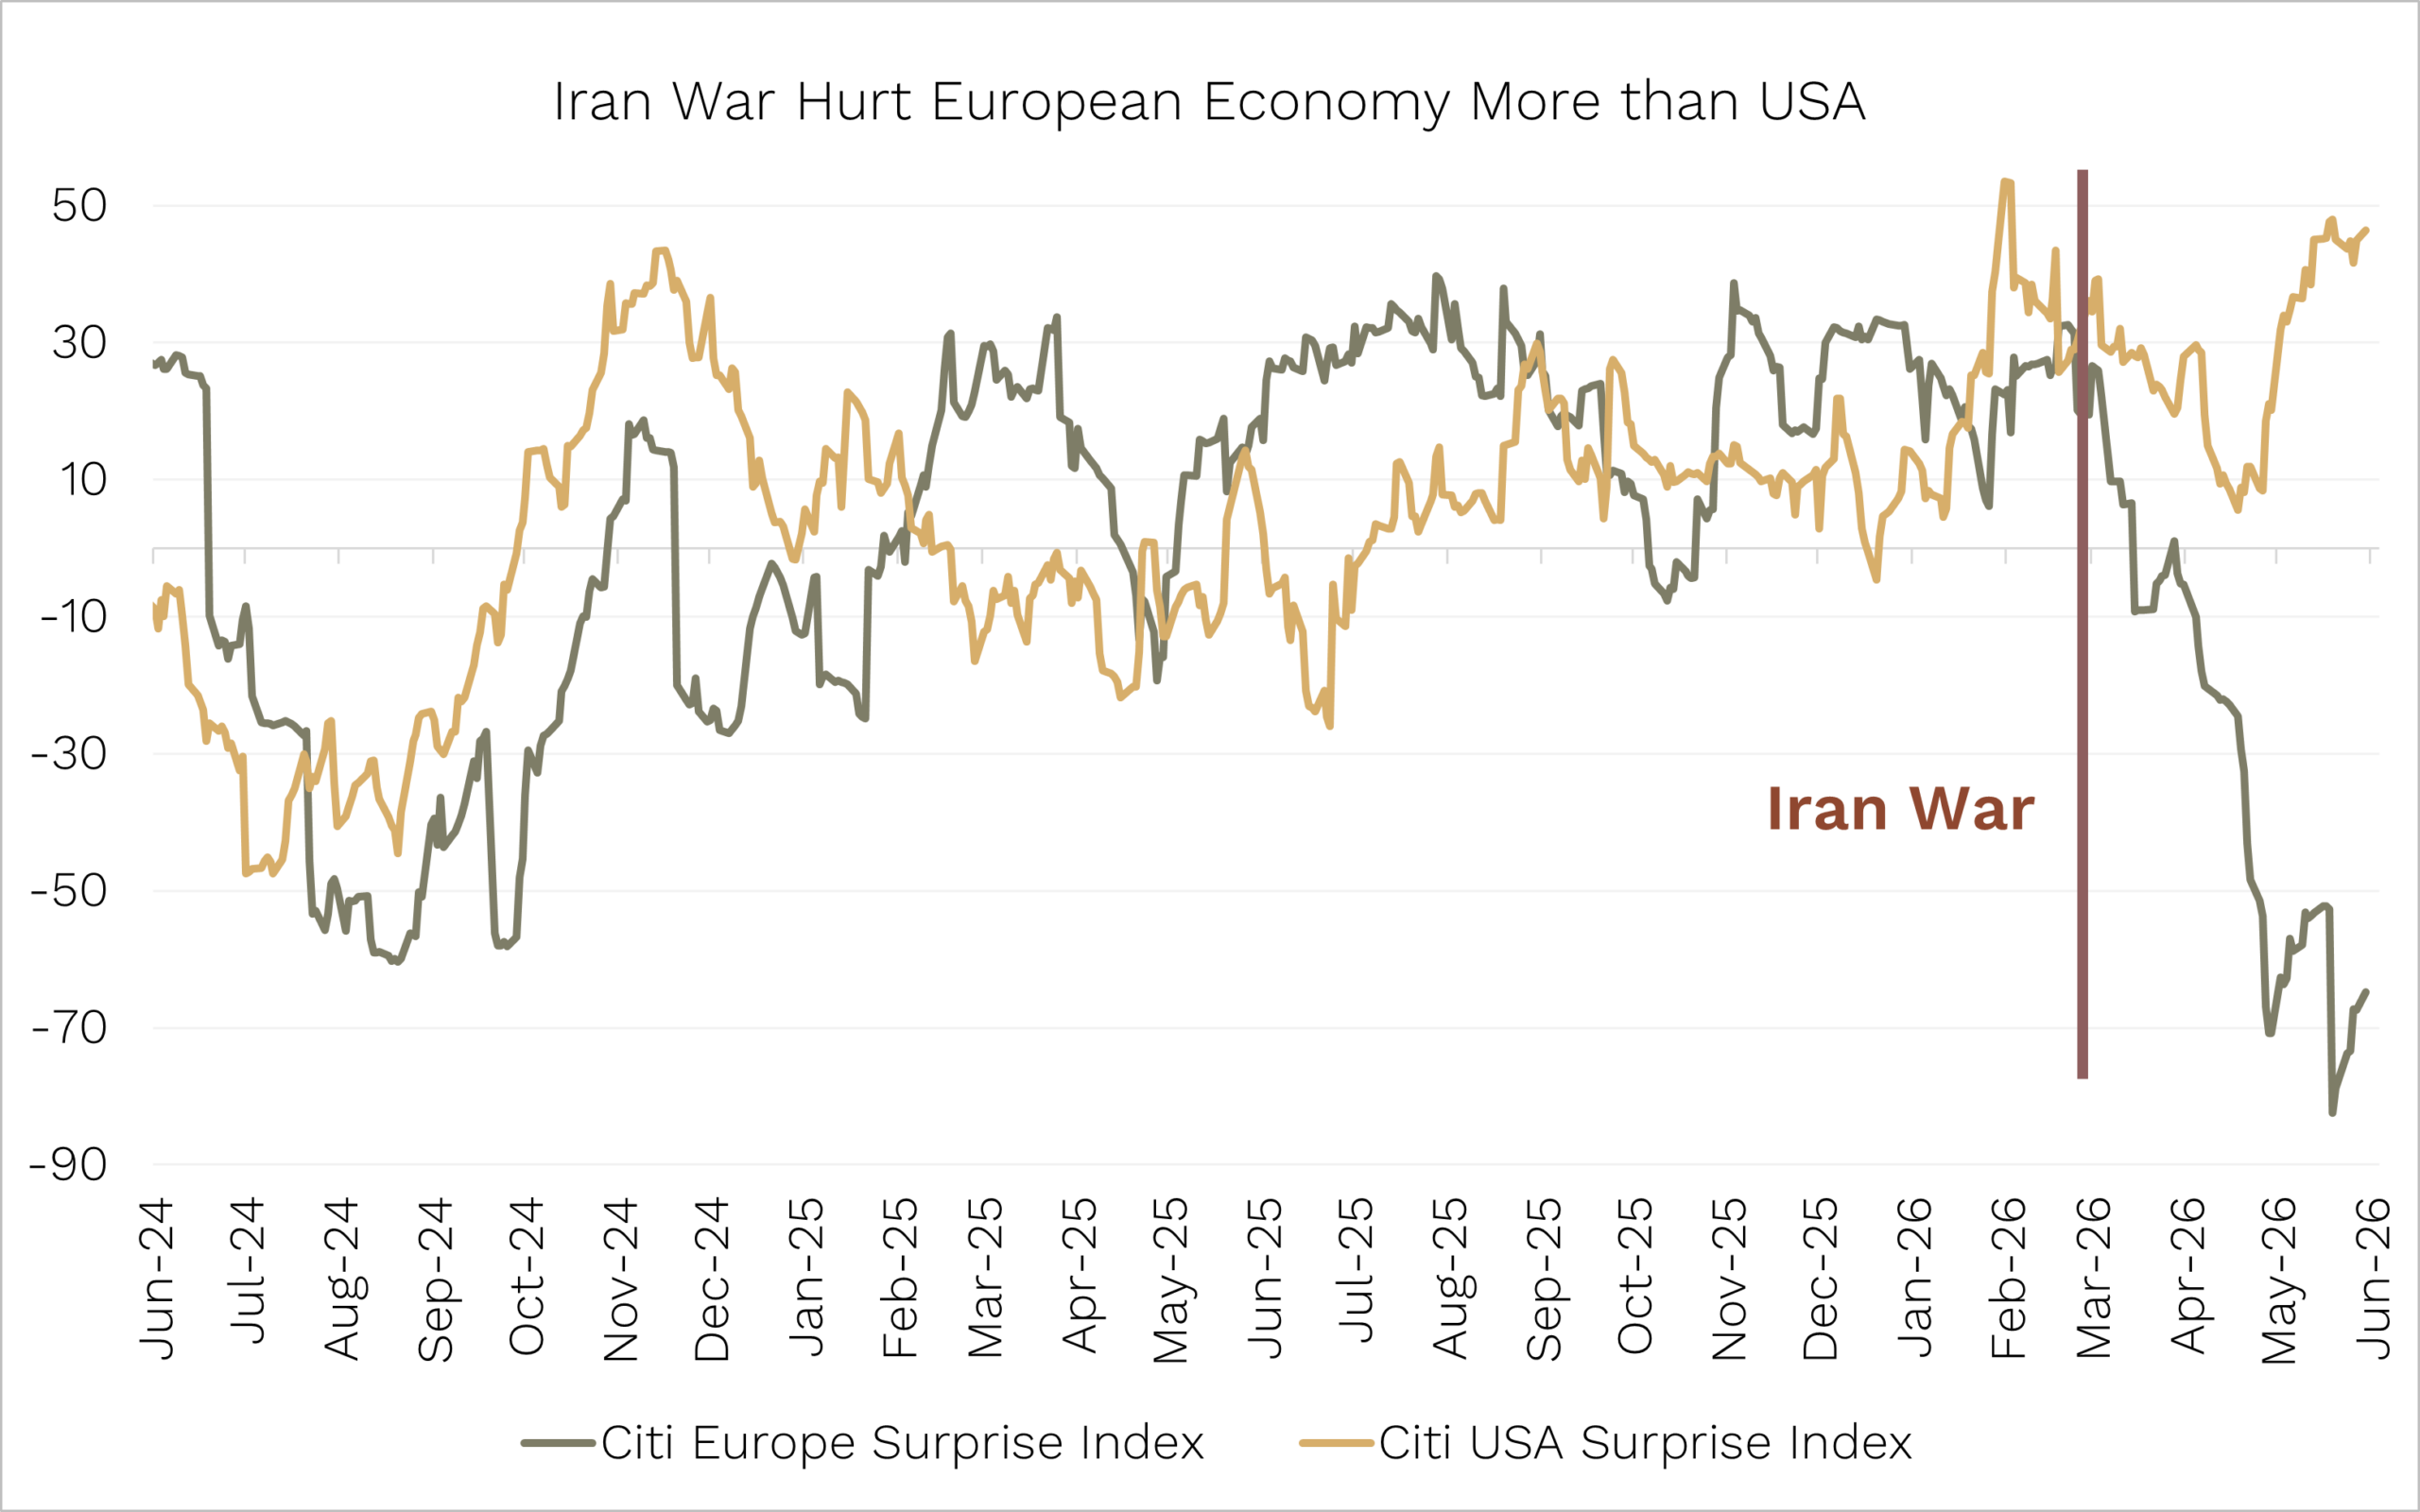
Source: Bloomberg. Data as of 31 May 2026.
A US$1.75 trillion moonshot
Speaking of optimism: the most topical listing on the planet (and off it) is SpaceX’s IPO, which Aussie investors are being offered through local brokers. We don’t invest in large caps, so we own none. But the valuation expectations caught our eye.
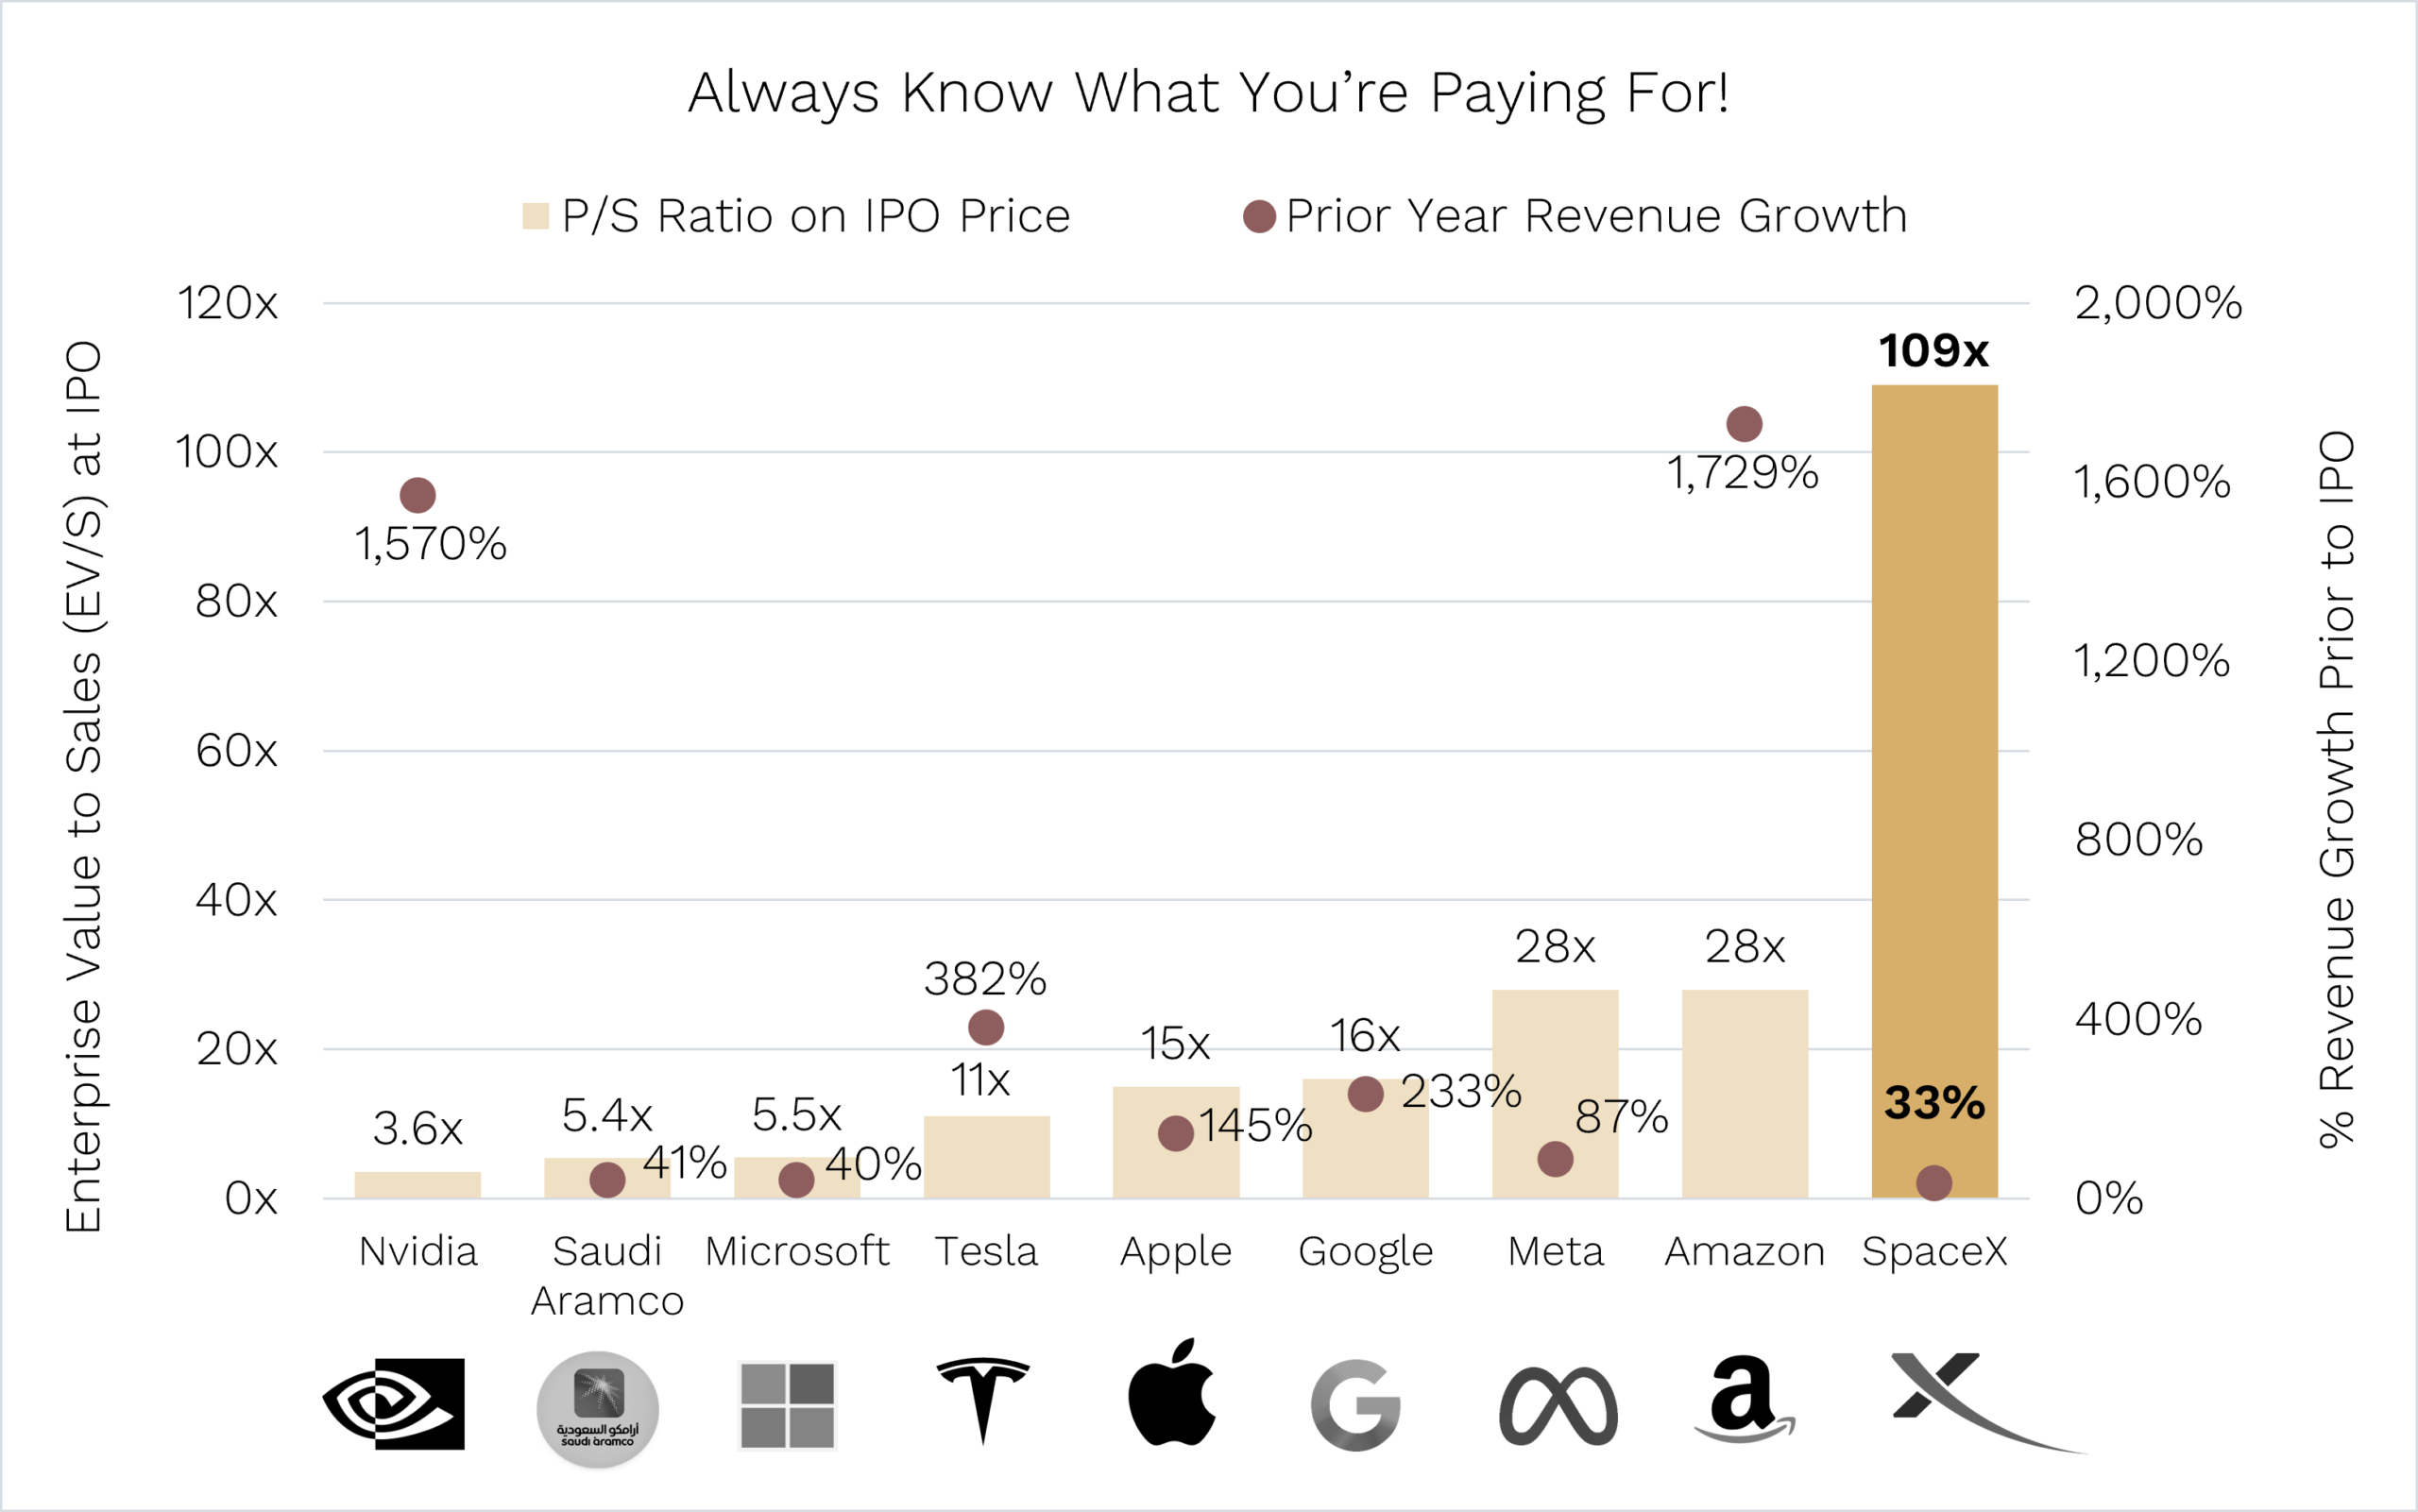
Source: Ophir, Bloomberg.
SpaceX grew revenue 33% last year, to around US$18.7 billion. It listed at roughly US$1.75 trillion – close to 100 times sales. Amazon listed at 28 times revenue while growing around 1,700%; Meta at 28 times growing 87%. SpaceX investors are getting a fraction of that growth for a multiple several times higher.
Now, betting against Elon Musk has historically been dangerous. And we can only hope, for humanity’s sake, that he delivers. BUT – those are the loftiest growth expectations, at scale, the world has ever asked anyone to live up to! And the market seems happy to oblige. SpaceX has since jumped +20% in its first days of trading.
Not a one-trick pony
So how are we positioned for all this frothiness?
Our weighting to semiconductors is around 10% in our Global Funds – roughly the index weight. We are not chasing momentum, or the leverage that hedge funds are piling into the trade.
Maybe some funds can read the memory supply cycle perfectly and will pivot right before any crash. Good luck to them. Our performance is built differently. We spread investments across many companies that have their own idiosyncratic earnings drivers and march to their own beat.
You can see it in our multi-factor attribution for May in our Global Opportunities Fund below.
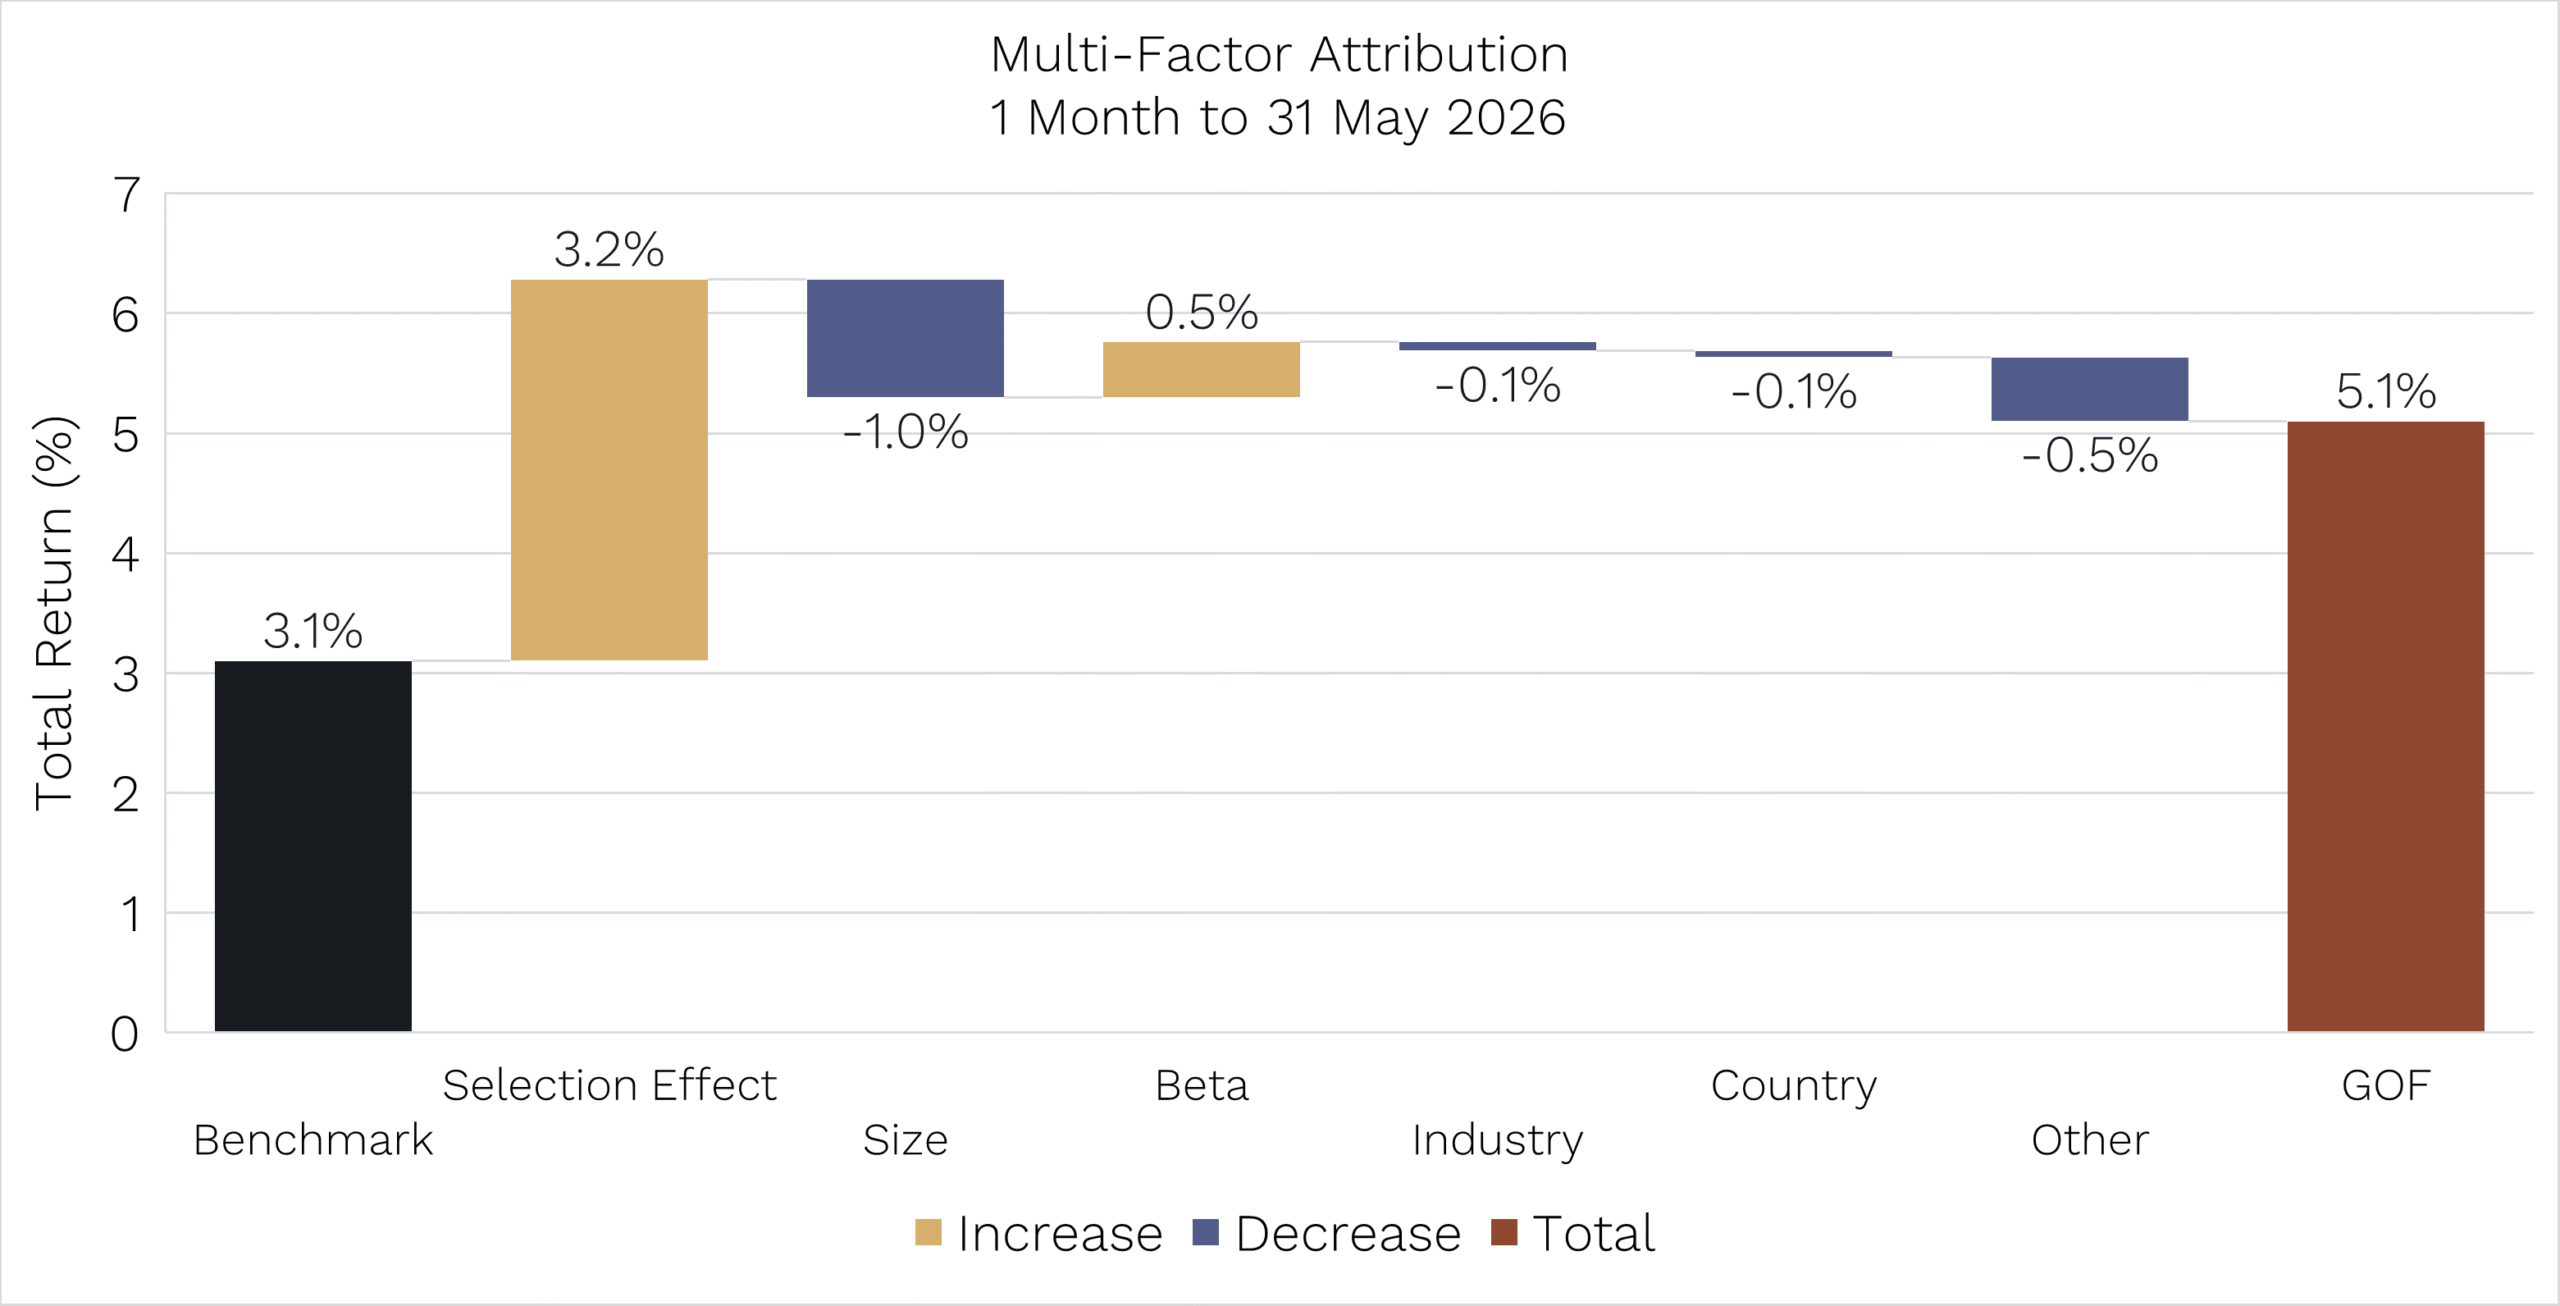
Source: Ophir, Bloomberg. Data as at 31 May 2026. MSCI World SMID Index NR (AUD), performance is net of fees. Past performance is not a reliable indicator of future performance. Performance figures are net of fees.
The benchmark was up +3.1% and we were up +5.1%. Industry positioning – the factor that’s been driving the market’s narrow leaders – was actually a small negative for us. The gold bar is where our outperformance came from: +3.2% from stock selection; i.e. finding hidden gems before the market discovers them!
Fund distributions are coming – we reinvest ours, should you?
While many investors are focused on price appreciation, it’s also vital to be across distributions if you’re seeking to maximise your wealth creation and realise important financial goals.
At Ophir, we seek to compound investors’ capital. Over the long run, we’ve done exactly that, returning:
- +23.0% per annum in the Ophir Opportunities Fund (since August 2012)
- +12.1% per annum in the Ophir High Conviction Fund (since August 2015)
- +18.7% per annum in the Ophir Global Opportunities Fund (since October 2018)
- +14.3% per annum in the Ophir Global High Conviction Fund (since September 2020)
(The returns are all net of fees and assume reinvestment of distributions.[1])
But under Australian managed-fund rules, we’re required to pass through net realised gains and income to unitholders each year. Some years it’s a meaningful distribution, some a modest one, and occasionally none at all.
When there is a distribution, however, the mechanics can confuse some investors. And what you do with the cash is often one of the most consequential investment decisions you’ll make all year.
What is a distribution?
A distribution is your share of the year’s profits – the dividends, interest and net realised capital gains your fund has earned, paid out in proportion to how many units you hold.
Realised gains – i.e. when we sell a stock for a profit – are what swing most year to year. Some years we crystallise a lot, and some years prior-year losses are still absorbing gains before they reach you.
FY26 distribution estimates
Below are our estimated distributions per unit (DPU) for each Fund and unit class, based on portfolio data, as of 30 April 2026:
| Fund |
Class |
Estimated DPU |
| Ophir Opportunities Fund |
Ordinary Class |
$0.7587 |
| Ophir High Conviction Fund (ASX: OPH) |
Ordinary Class |
$0.3517 |
| Ophir Global Opportunities Fund |
Class A |
$0.1379 |
| Ophir Global Opportunities Fund |
Class B |
$0.0580 |
| Ophir Global Opportunities Fund |
Class H (Hedged) |
$0.1350 |
| Ophir Global High Conviction Fund |
Class A |
$0.00 |
| Ophir Global High Conviction Fund |
Class B |
$0.00 |
Estimates only, based on portfolio data as of 30 April 2026. Final distributions are calculated after 30 June 2026 and may differ materially. Do not rely on these figures for tax purposes.
Why your unit price falls on 30 June
Like clockwork, after each distribution, we get an influx of concerned investors asking: what on earth happened to the Fund in June for the unit price to drop?
The reassuring answer is usually: nothing!
We just paid you a distribution.
You can see this in the following example:
- Imagine your unit price starts FY26 at $2.50.
- Through the year, the Fund earns $0.50 per unit that must be distributed.
- By 30 June 2026, the unit price is $3.00: your original $2.50, plus the $0.50 waiting to be paid out.
- On 30 June, that $0.50 gets paid out as a cash distribution, and the unit price retreats to $2.50, exactly where it started.
If you looked at the price alone, you’d swear you made nothing all year. But the $0.50 is in your pocket. Add it back and your total return is 20% ($0.50 ÷ $2.50). (We’ve simplified here – generally not all of a year’s unit-price rise is paid out.)
That $3.00 is the cum-price – the unit with the income still inside it. The $2.50 is the ex-price – after the cash has been handed out.
The gap between them isn’t a loss. It’s your distribution.
The price didn’t fall. It just stopped carrying cash, which is now yours.
The cost of cash
Everyone loves a bonus – and to be clear, the cash is your real profit from the stocks we hold. The only question is what taking the distribution costs you, compared to leaving it in the Fund.
Here’s the answer in dollars.
Assume you invested $100,000 into the Ophir Opportunities Fund at inception in August 2012. The chart below shows what you’d have as of 31 May 2026, depending on what you did with each distribution along the way.
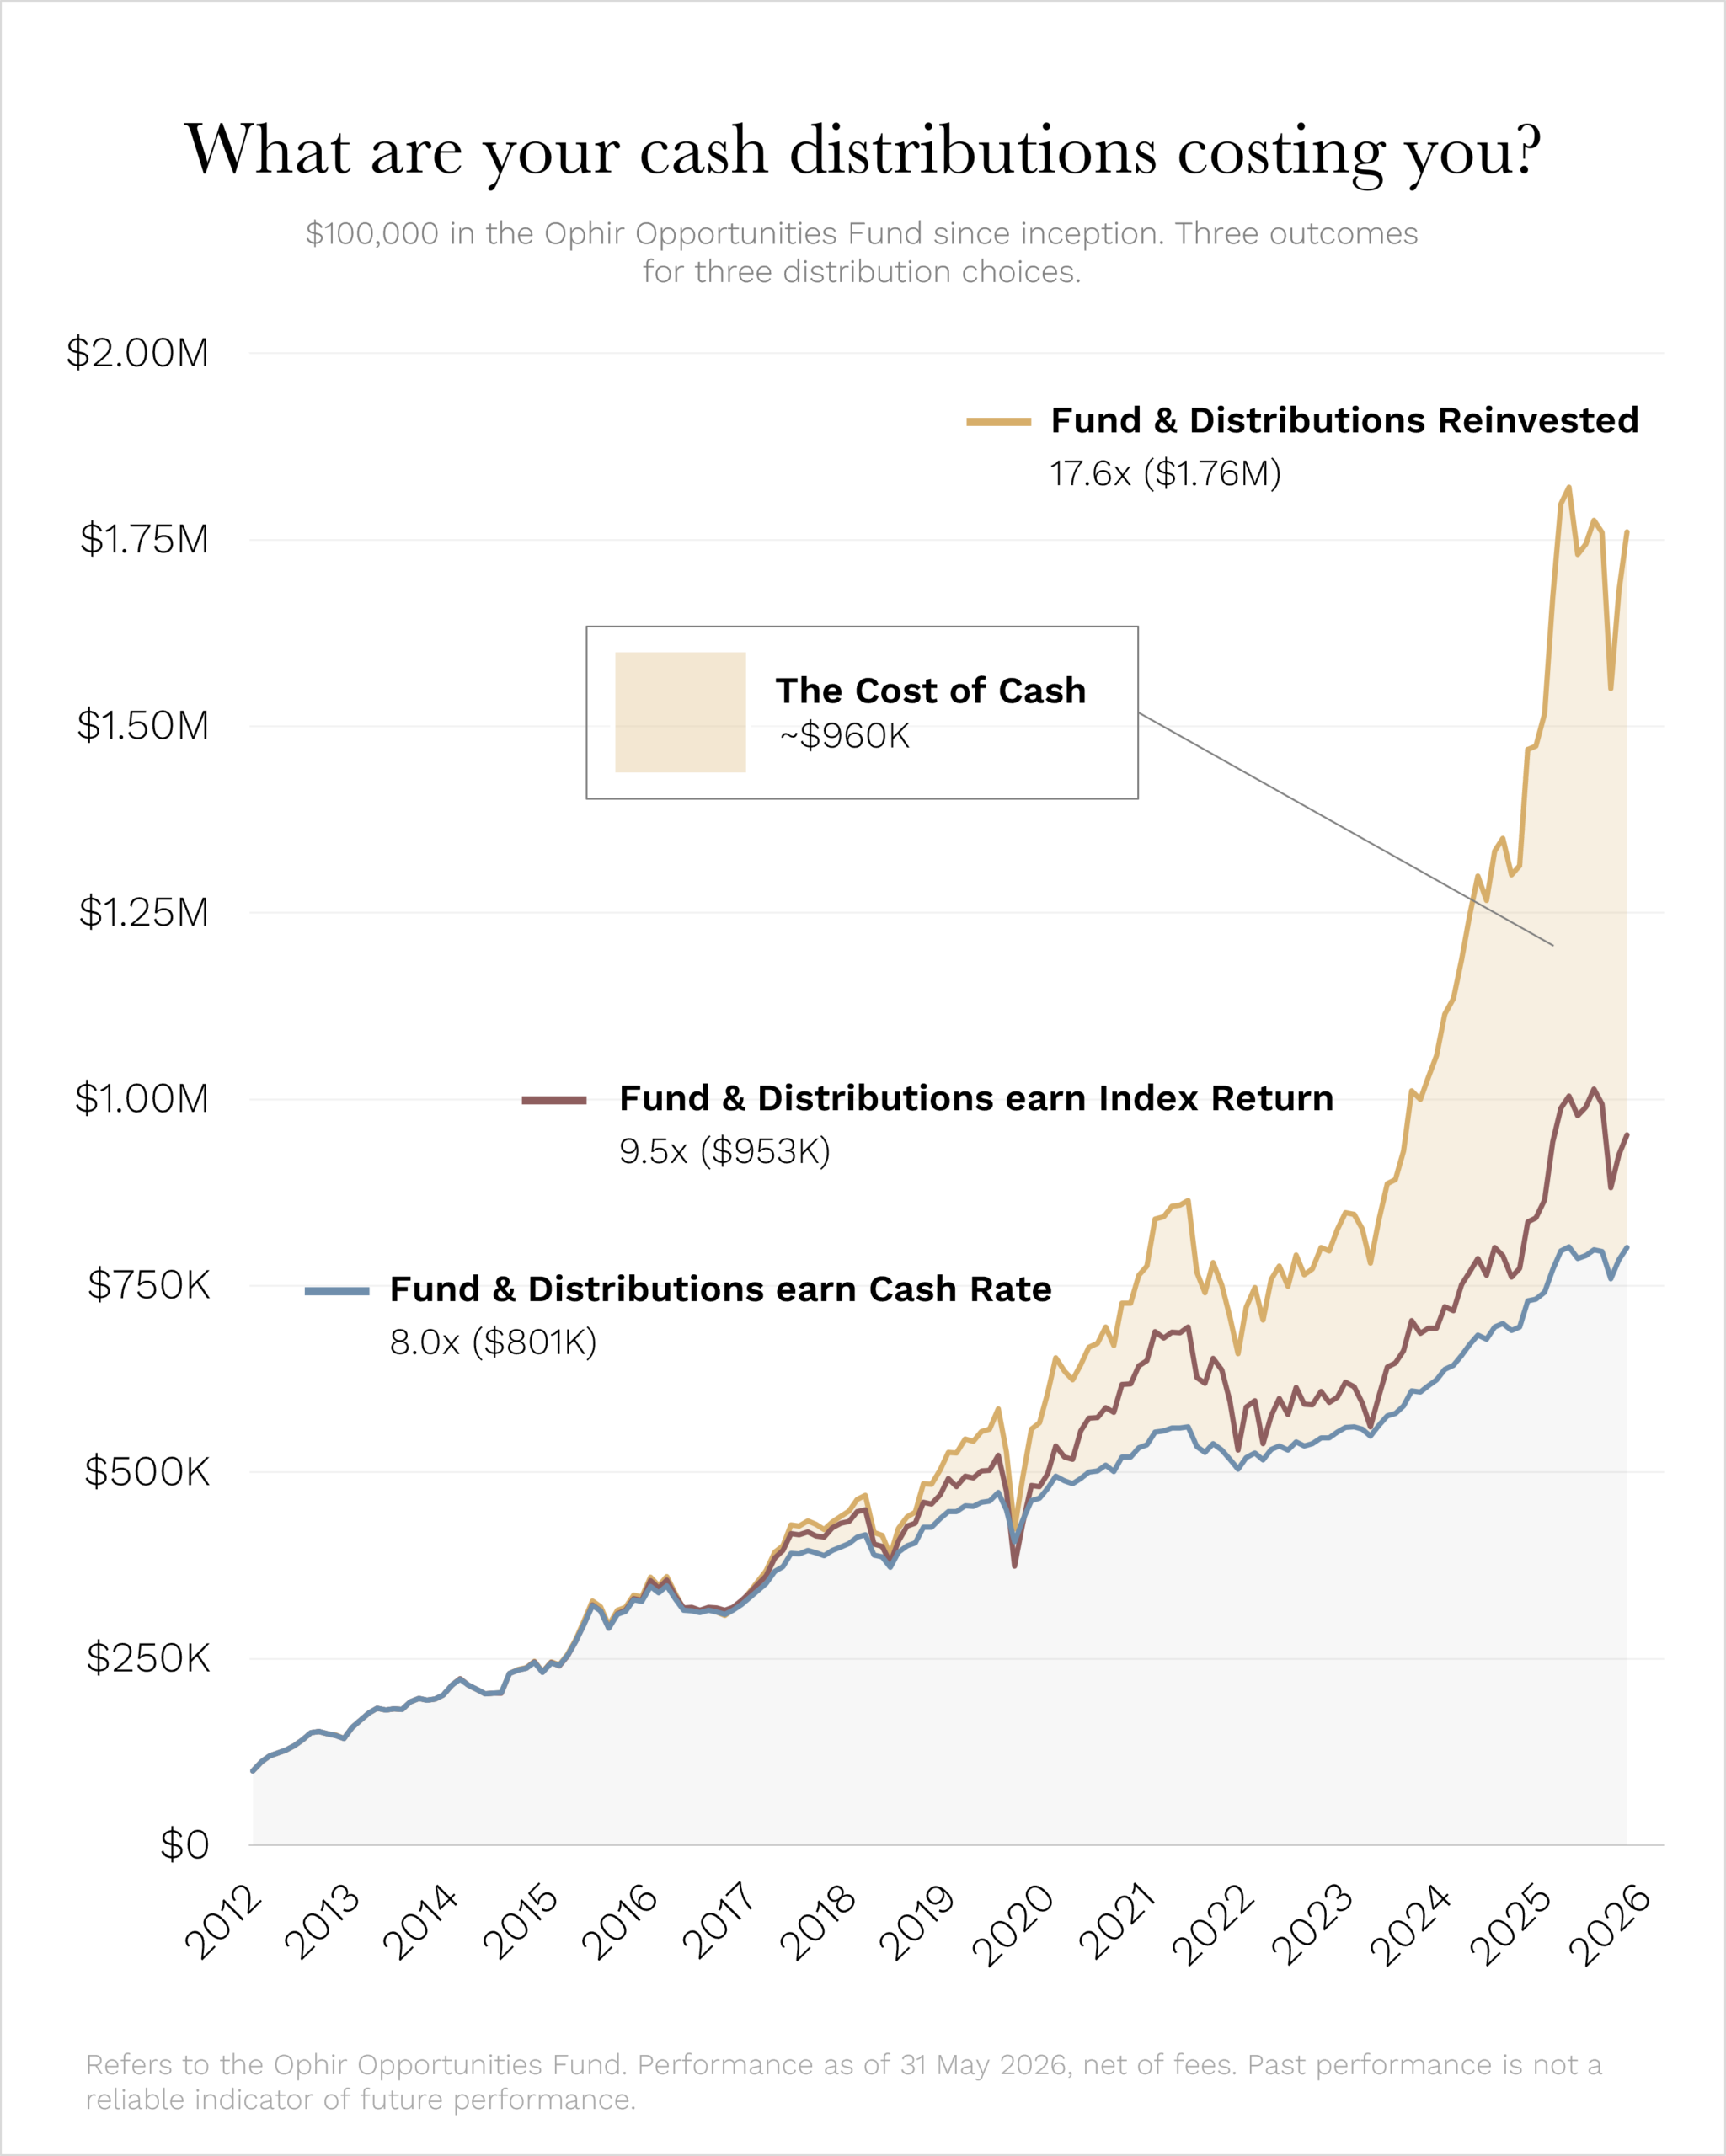
Source: Ophir. Index Return = the ASX Small Ordinaries Total Return Index. Note: investors in the Fund have not been / will not be able to reinvest the FY25 and FY26 distributions, to constrain the capacity of the Fund and help optimise our ability to generate performance. Past performance is not a reliable indicator of future performance.
If you had ticked the dividend reinvestment plan (DRP) box at inception, then your $100,000 is worth $1.76 million today (after fees and before tax).
But if you took every distribution as cash and let it sit earning the cash rate, you’d have $801,000. That’s around $960,000 of difference.
What if you’d instead put every cash distribution into the Australian small-cap index along the way? You’d have $953,000 – better, but still over $800,000 short of the DRP investor.
Both numbers tell the same story: cash rarely gets a plan. After the distribution lands in your bank account, it’s easy to sit on your hands waiting to ‘buy the dip’. The problem is that the market, more often than not, keeps rising, leaving you and your cash behind.
These figures are illustrative only, based on the fund’s actual past returns and a calculated cash rate over the period shown. Outcomes will depend on how distributions are used. Holding cash or reinvesting into different assets may lead to different results. Past performance is not a reliable indicator of future performance.
Don’t Retire your Profits (DRP)
The case for reinvesting is the oldest one in investing: compounding. As Warren Buffett put it: “Life is like a snowball. The important thing is finding wet snow and a really long hill.”
Here’s how it rolls:
- When you reinvest your distribution, you receive new units issued at the post-distribution net asset value (NAV), with no transaction costs.
- Those units earn next year’s distribution, which buys more units, which earn the year after … Gentle at first, quietly remarkable by year ten, and genuinely transformative by year twenty (based on historical returns).
Four things you should know about the DRP:
- Free. No transaction costs or buy/sell spreads.
- Flexible. You can reinvest fully, partially, or not at all … or change your mind any time.
- Tax-neutral. Your distribution is assessable in the year it’s earned regardless of whether you take cash or reinvest. Reinvesting doesn’t defer or reduce the tax.
- Set-and-forget. You can choose to elect once. Reinvestment runs in the background until you stop it.
The DRP isn’t for everyone. If you rely on your distribution for income, take the cash. But if you don’t need it right now and you’re investing for the long term, reinvestment is the simplest decision you can make to compound your position.
The above is general information only, not personal financial advice. Market conditions, cash flow needs and tax outcomes may affect long-term results, and outcomes are not guaranteed. Consider seeking licensed financial or tax advice for your circumstances.
What to do now
There are two things you should do between now and 30 June:
- Check your DRP preference. If you want to reinvest your FY26 distribution, or change your existing election, log in to the Automic Investor Portal (link), follow Automic’s step-by-step DRP guide (link), or use the paper DRP form (link) and email a copy to ophir@automicgroup.com.au. Elections close at the close of business on 30 June 2026 for the unlisted funds, and 2 July 2026 for OPH in line with the ASX timetable.
- Check your bank account details. Important: missing or out-of-date details mean you may be deemed to have elected DRP by default.
Final figures of distributions and statement timing will be confirmed in our late-July follow-up communication
[1]Past performance is not a reliable indicator of future performance.
As always, if you’d like to chat to us about any of the Funds, please feel free to call us on (02) 8188 0397 or email us at ophir@ophiram.com.
Thank you for entrusting your capital with us.
Kindest regards,

Andrew Mitchell & Steven Ng
Co-Founders & Senior Portfolio Managers
Ophir Asset Management
This document has been prepared by Ophir Asset Management Pty Ltd (ABN 88 156 146 717, AFSL 420082) (“Ophir”) and contains information about one or more managed investment schemes managed by Ophir (the “Funds”) as at the date of this document. The Trust Company (RE Services) Limited ABN 45 003 278 831, the responsible entity of, and issuer of units in, the Ophir High Conviction Fund (ASX: OPH), the Ophir Global Opportunities Fund and the Ophir Global High Conviction Fund. Ophir is the trustee and issuer of the Ophir Opportunities Fund.
This is general information only and is not intended to provide you with financial advice and does not consider your investment objectives, financial situation or particular needs. You should consider your own investment objectives, financial situation and particular needs before acting upon any information provided and consider seeking advice from a financial advisor if necessary. Before making an investment decision, you should read the relevant Product Disclosure Statement (“PDS”) and Target Market Determination (“TMD”) available at www.ophiram.com or by emailing Ophir at ophir@ophiram.com. The PDS does not constitute a direct or indirect offer of securities in the US to any US person as defined in Regulation S under the Securities Act of 1993 as amended (US Securities Act).
All Ophir Funds are deemed high risk within their respective Target Market Determination documentation. Ophir does not guarantee the performance of the Funds or return of capital. An investment may achieve a lower than expected return and investors risk losing some or all of their principal investment. Past performance is not a reliable indicator of future performance. Any opinions, forecasts, estimates or projections reflect our judgment at the date of this was prepared, and are subject to change without notice. Rates of return cannot be guaranteed and any forecasts, estimates or projections as to future returns should not be relied on, as they are based on assumptions which may or may not ultimately be correct.
Actual returns could differ significantly from any forecasts, estimates or projections provided.
The Trust Company (RE Services) Limited is a part of the Perpetual group of companies. No company in the Perpetual Group (Perpetual Limited ABN 86 000 431 827 and its subsidiaries) guarantees the performance of any fund or the return of an investor’s capital.