Financial Year 2026: Breadth arrives and stock picking does the talking
In this Letter to Investors, we look at:
- How the Ophir Funds fared in FY2026 – including a +31.8% after fees return from our Ophir Global Opportunities Fund.
- Our win at the Money Management/ Lonsec Fund of the Year Awards.
- Why stock picking, not AI, drove our outperformance, again, this year.
- The long-awaited arrival of breadth, why that’s good for our small-cap space, and the key factors that indicate it can continue.
- Why the Fed Chair is talking hawkish, but markets are dovish.
- Our views on the AI theme including bubble talk & how we are thinking about it.
We’re writing this month’s Letter from our US office. We’re at the end of a couple of weeks on the road with the investment team, meeting companies, their customers and their competitors.
We’re now extremely knowledgeable – or as they say, ‘full bottle’ – on what’s happening on the ground here in the US. (More on that below.)
But first, to the financial year just ended.
Importantly, and excitingly, the thing we’ve been calling for, and patiently waiting for, finally arrived: breadth. (Breadth is basically the number of stocks participating in a move.)
After years of a handful of mega caps doing all the heavy lifting, returns started spreading across the market, including our areas of small caps, with the spread accelerating right into 30 June.
For small-cap stock pickers, breadth is rocket fuel. And it showed in our Fund performance for the financial year just gone.
Ophir Fund Performance: FY2026
The Ophir Opportunities Fund significantly outperformed its benchmark (ASX Small Ordinaries Accumulation Index, which returned +8.1%) with a +22.4% return net of fees.
Another cracking year for our original Fund!
Over the last 14 years, while its benchmark has compounded at +6.6% per annum after fees, our Opportunities Fund has compounded at +23.1%.
The Ophir High Conviction Fund, however, had a disappointing year, down -4.9% for its net asset value.
The Fund faced stiff headwinds. As a growth-style manager, we tend to be underweight cyclical sectors like materials. Unfortunately, in FY26 the gap between the ASX200’s best-performing sector (materials +47.5%) and the worst (health care -37.4%) was the largest ever.
The High Conviction Fund was also overweight quality software names, that were ‘hit for six’ in late 2025 and early 2026 on fears of AI disruption.
We cut that weight quickly, but it still hurt. We’re not sugar-coating it, and we’re working our butts off to fix it.
Global Equities Small & Mid Caps ‘Fund of the Year’ for 2026
The stars of FY2026 were our Global Funds.
While its benchmark (MSCI World SMID Cap Index NR, AUD) returned +16.0%, the Ophir Global Opportunities Fund returned +31.8% net of fees.
It has now delivered around +19.8% per annum after fees – over almost eight years – roughly +10% per annum ahead of its benchmark.
That makes it the best-performing global small-cap fund available in Australia over that period (Morningstar data).
The Ophir Global High Conviction Fund enjoyed a similarly stellar year, up +28.5%.
This performance was recognised with our Global High Conviction Fund (Class A) winning the Money Management/Lonsec Global Equities Small & Mid Caps Fund of the Year, a fantastic reward for all the team’s hard work.
From stock picking … again
So where did those global returns come from?
Were we just lucky enough to ride the AI boom?
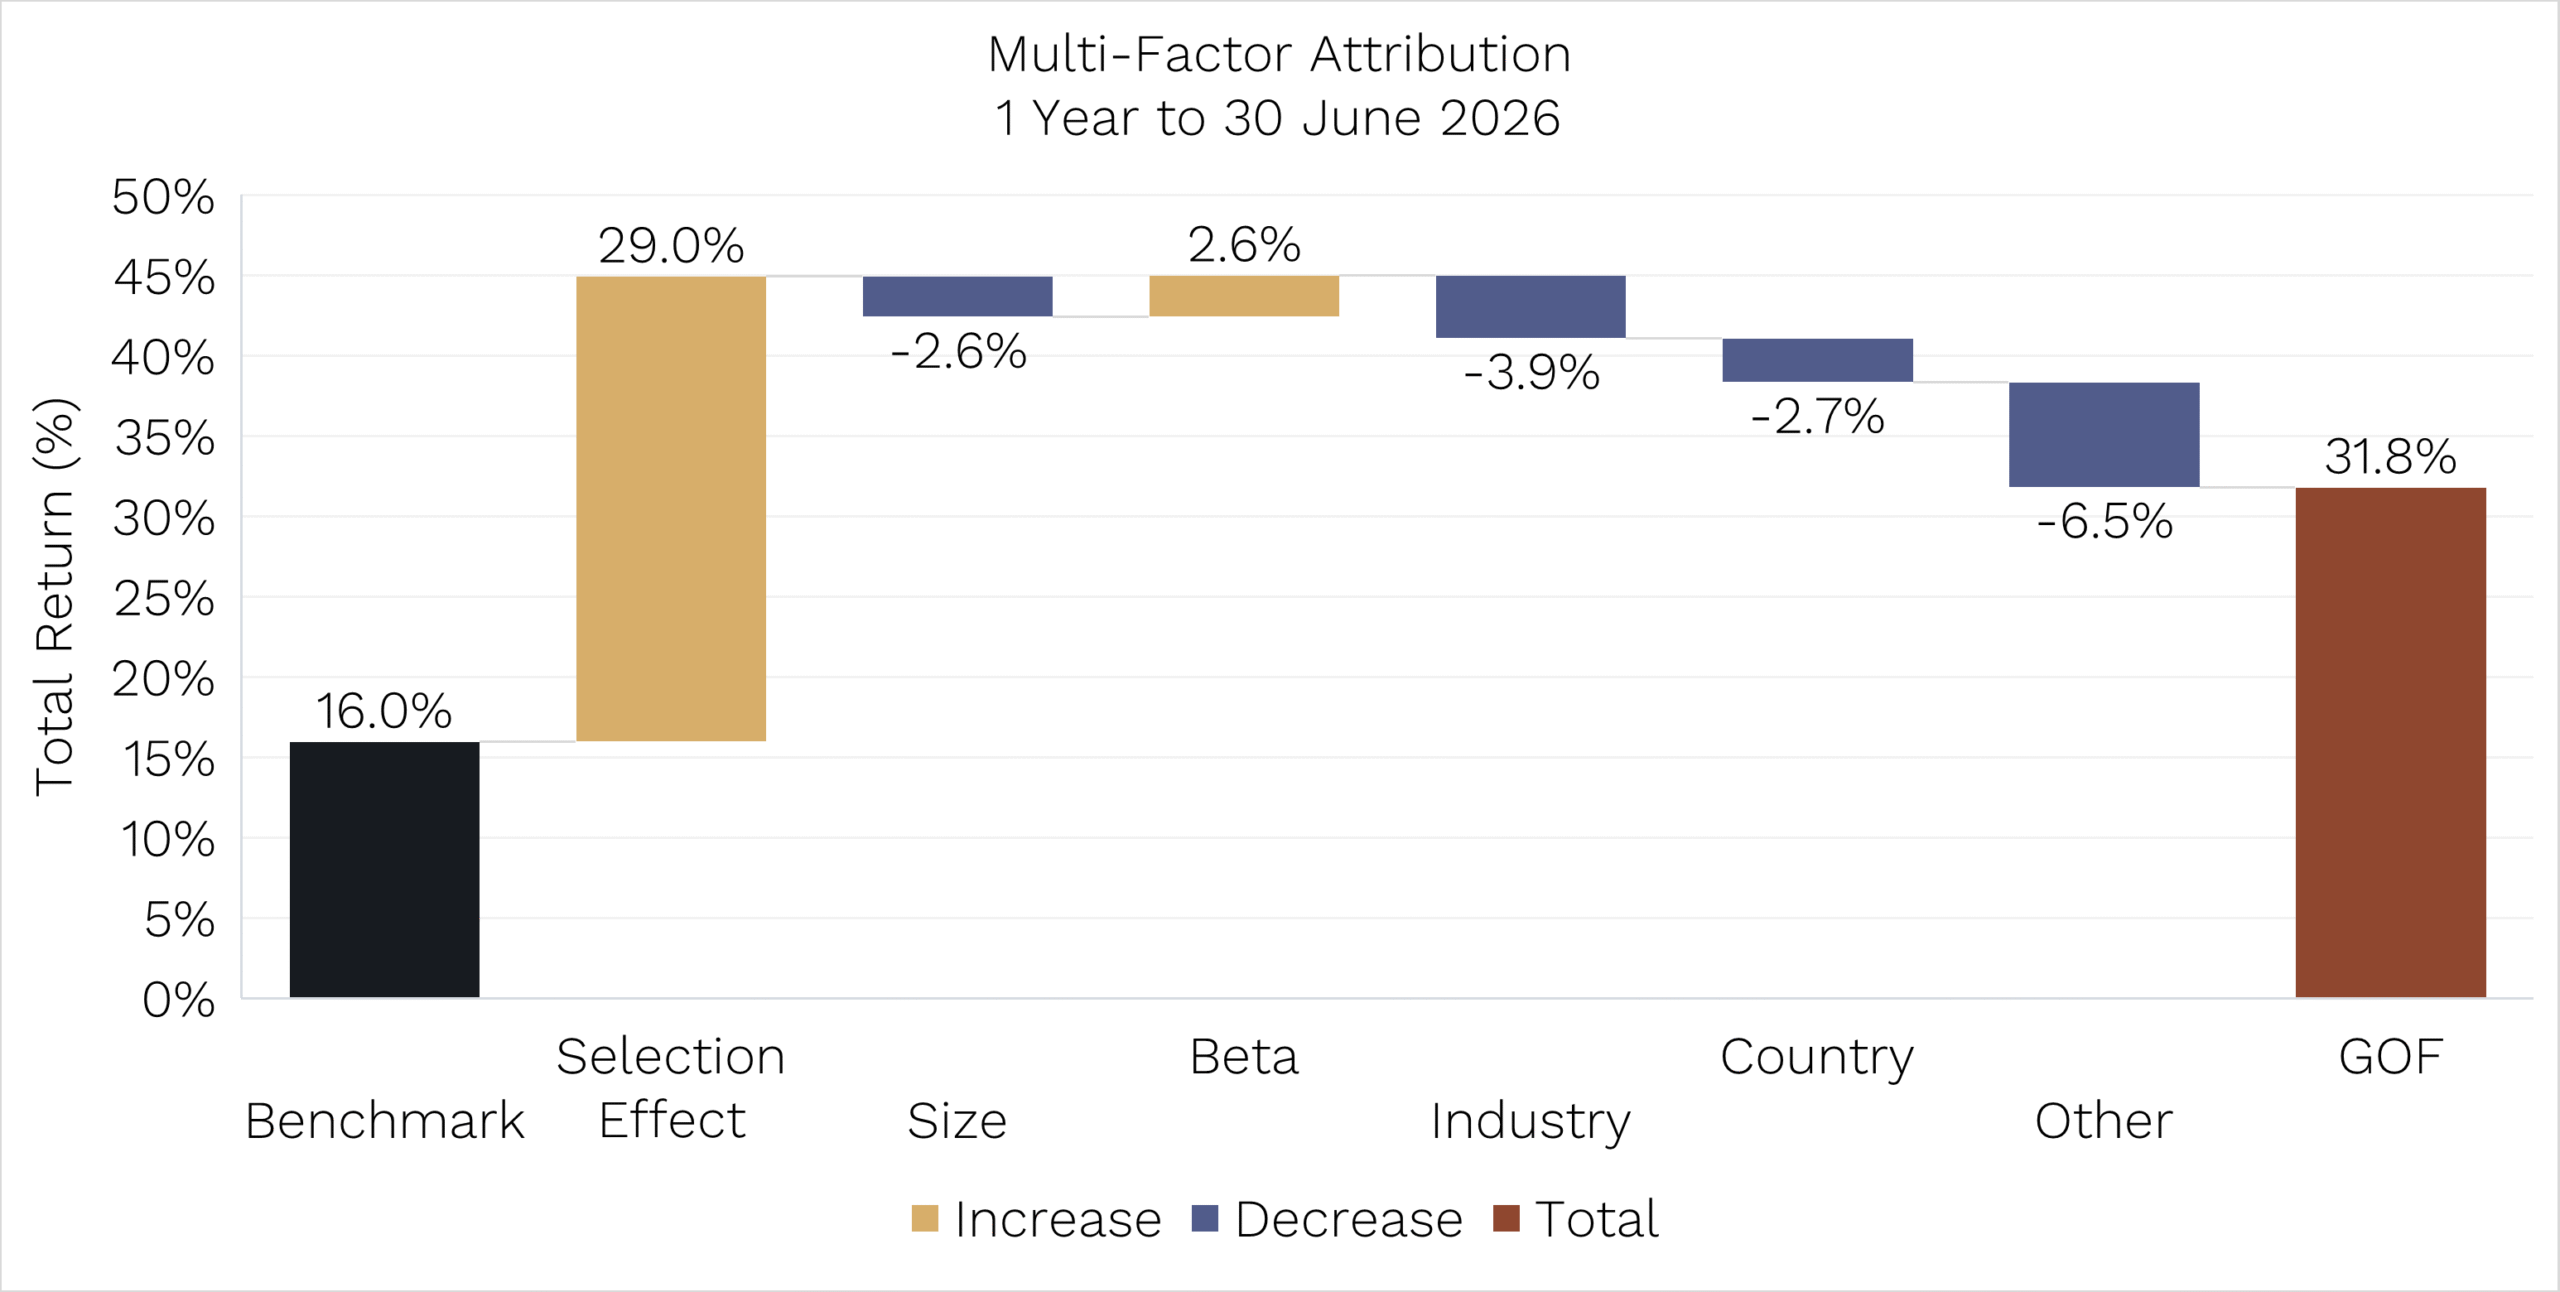
Let’s look at the Global Opportunities Fund multi-factor performance attribution to find out.
Source: Bloomberg. Data as of 30 June 2026. Benchmark: MSCI World SMID Index NR (AUD). Performance is net of fees. Past performance is not a reliable indicator of future performance. Performance figures are net of fees.
If you read the chart from left to right, you can see the benchmark was up 16.0%, and the Fund was up 31.8%.
In between sit the factors that explain the gap in performance between the benchmark and Fund, and almost all of them are noise:
- Industry effects barely registered, which is important because it shows we weren’t just riding the AI tidal wave.
- Country was actually a drag.
- Size and beta? Small change.
What was the most important factor?
It was the Selection Effect (i.e., pure stock picking) which added +29.0%.
So stock picking represented more than 100% of the Fund’s outperformance.
That’s right, our outperformance came from stock picking again.
Stock picking is the kind of outperformance that endures because it is based on replicable skill and not just luck.
And it’s the kind of outperformance you should demand of any small-cap manager you own, whether Australian, global or otherwise.
Twenty-one stocks did the talking
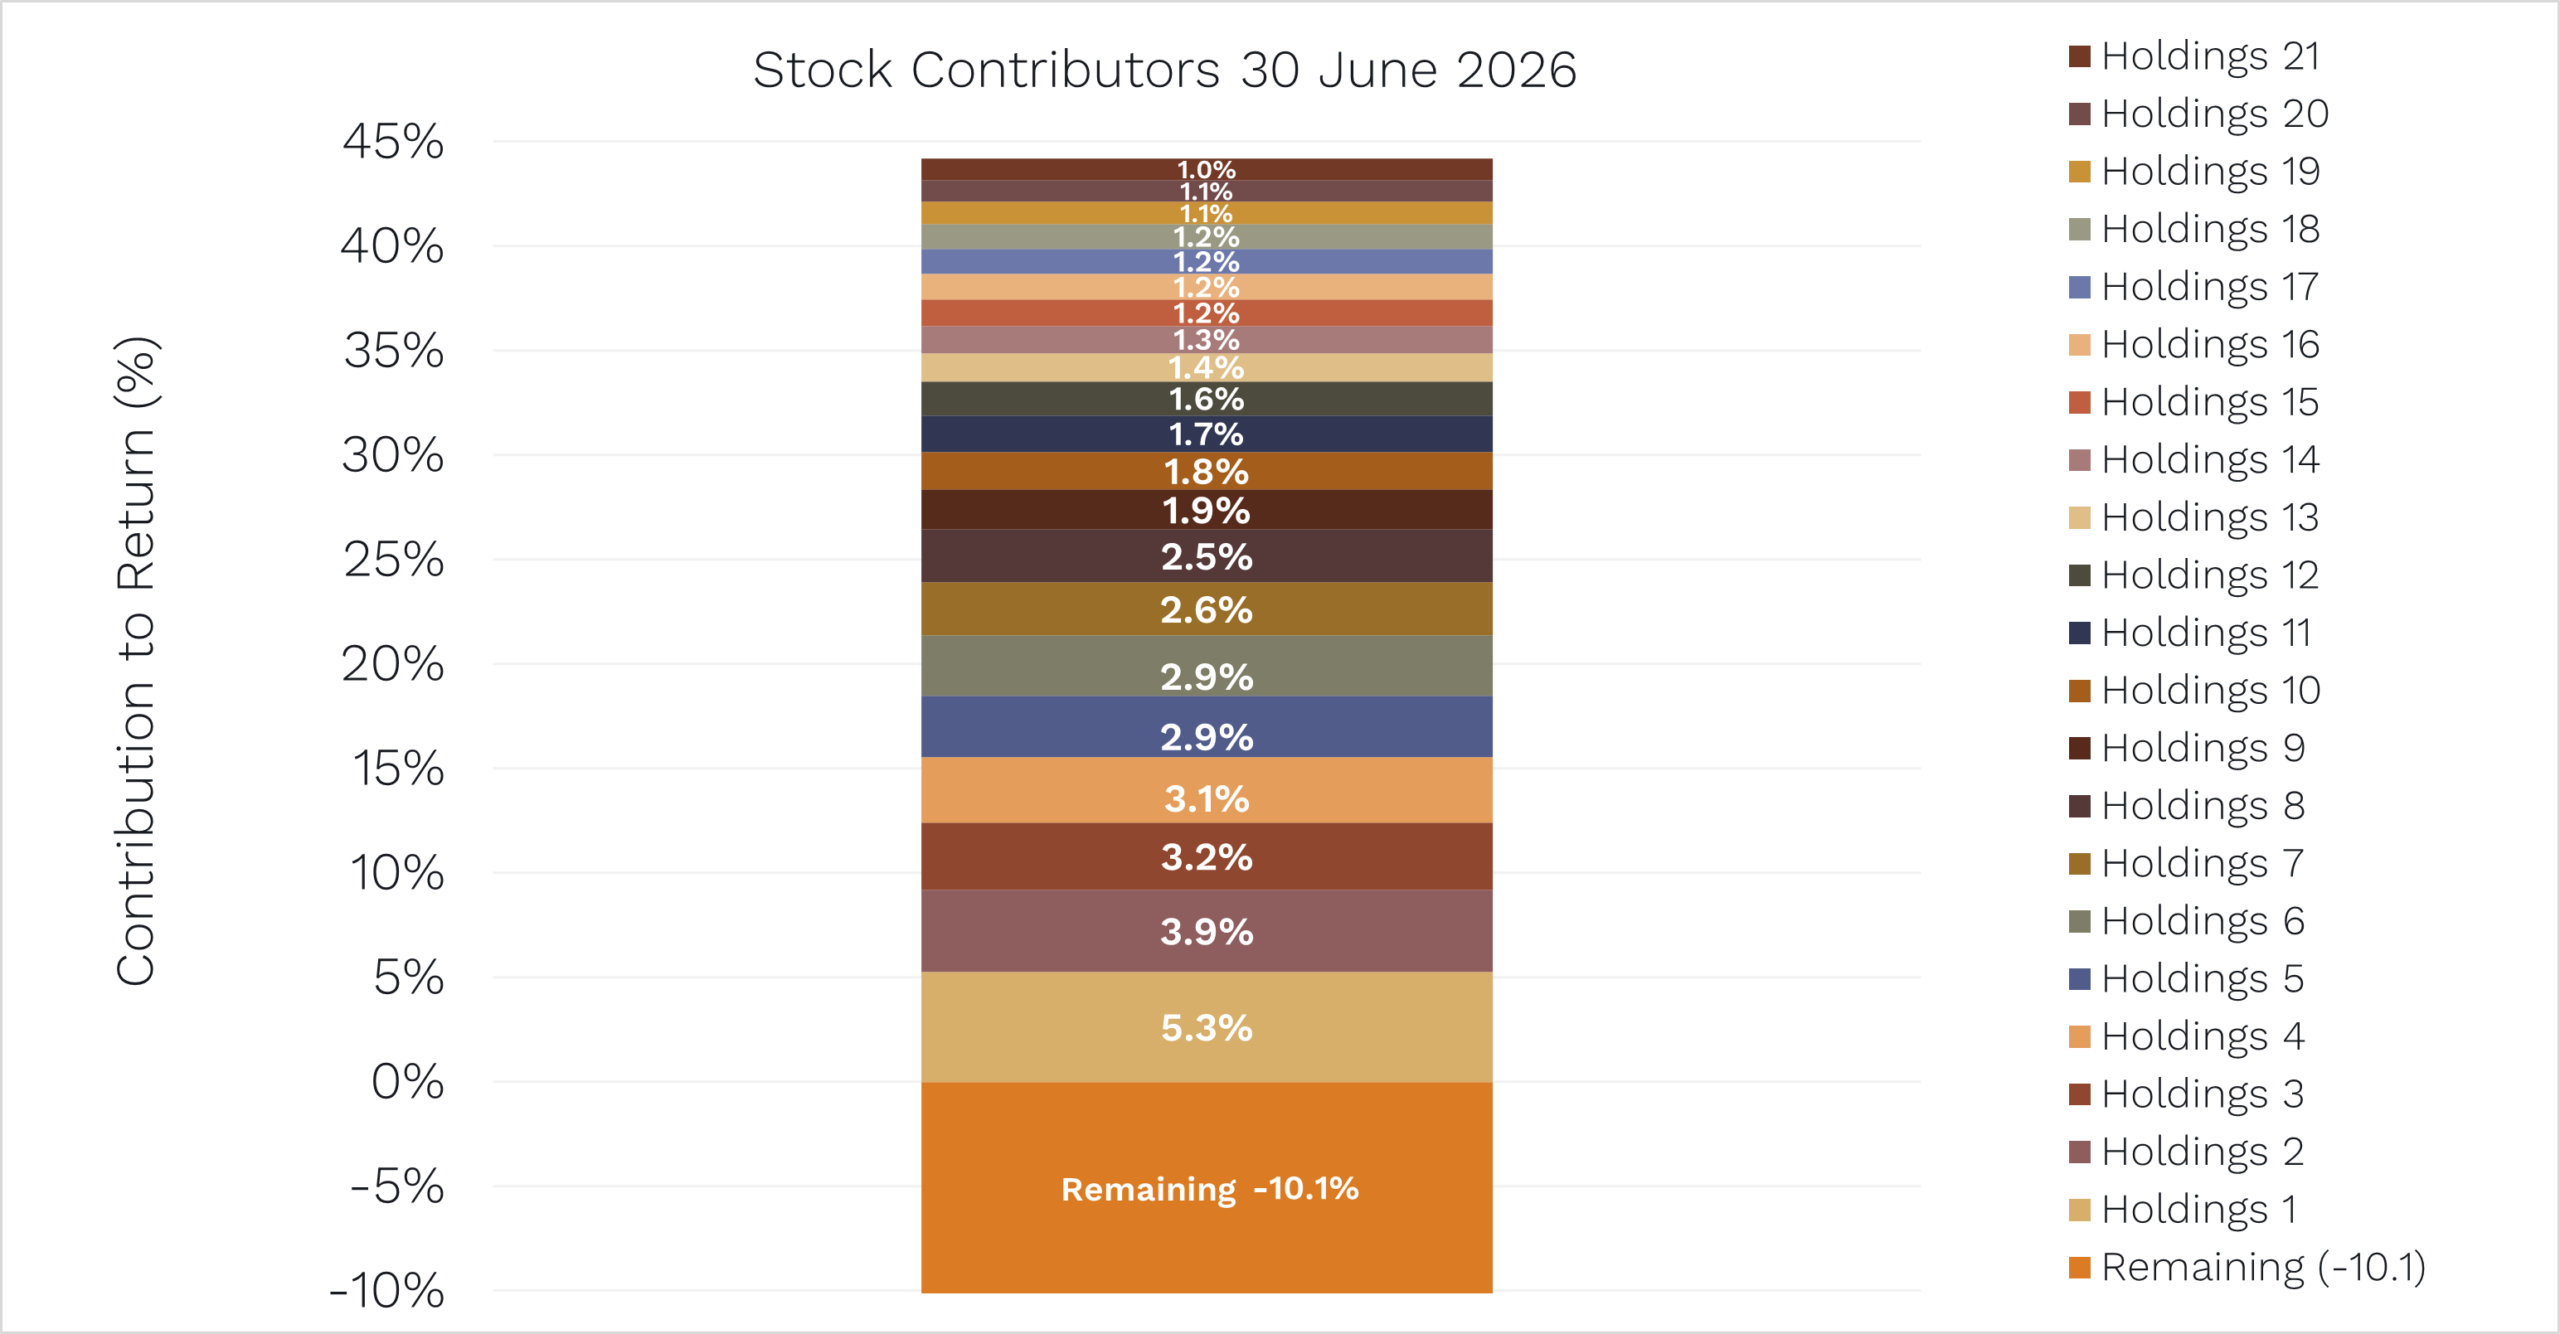
Global Opportunities Fund Stock Contributors:
Source: Bloomberg. Data as of 30 June 2026.
Just as important is how widely our stock picking was spread in our Global Funds. Twenty-one stocks did most of the talking for the year in our Global Opportunities Fund, with the biggest single contributor adding 5.3%. See this month’s Stock in Focus report for some recent winners and losers (link)
This is important because if a fund manager’s year hinges on one stock going up 10x, it’s hard to be confident they can repeat that performance the following year.
A broad spread of winners – as we had in 2026 – is another fingerprint of a repeatable process.
Our returns aren’t riding on AI
And here’s further evidence that our strong recent performance isn’t because of a correlation with AI stocks.
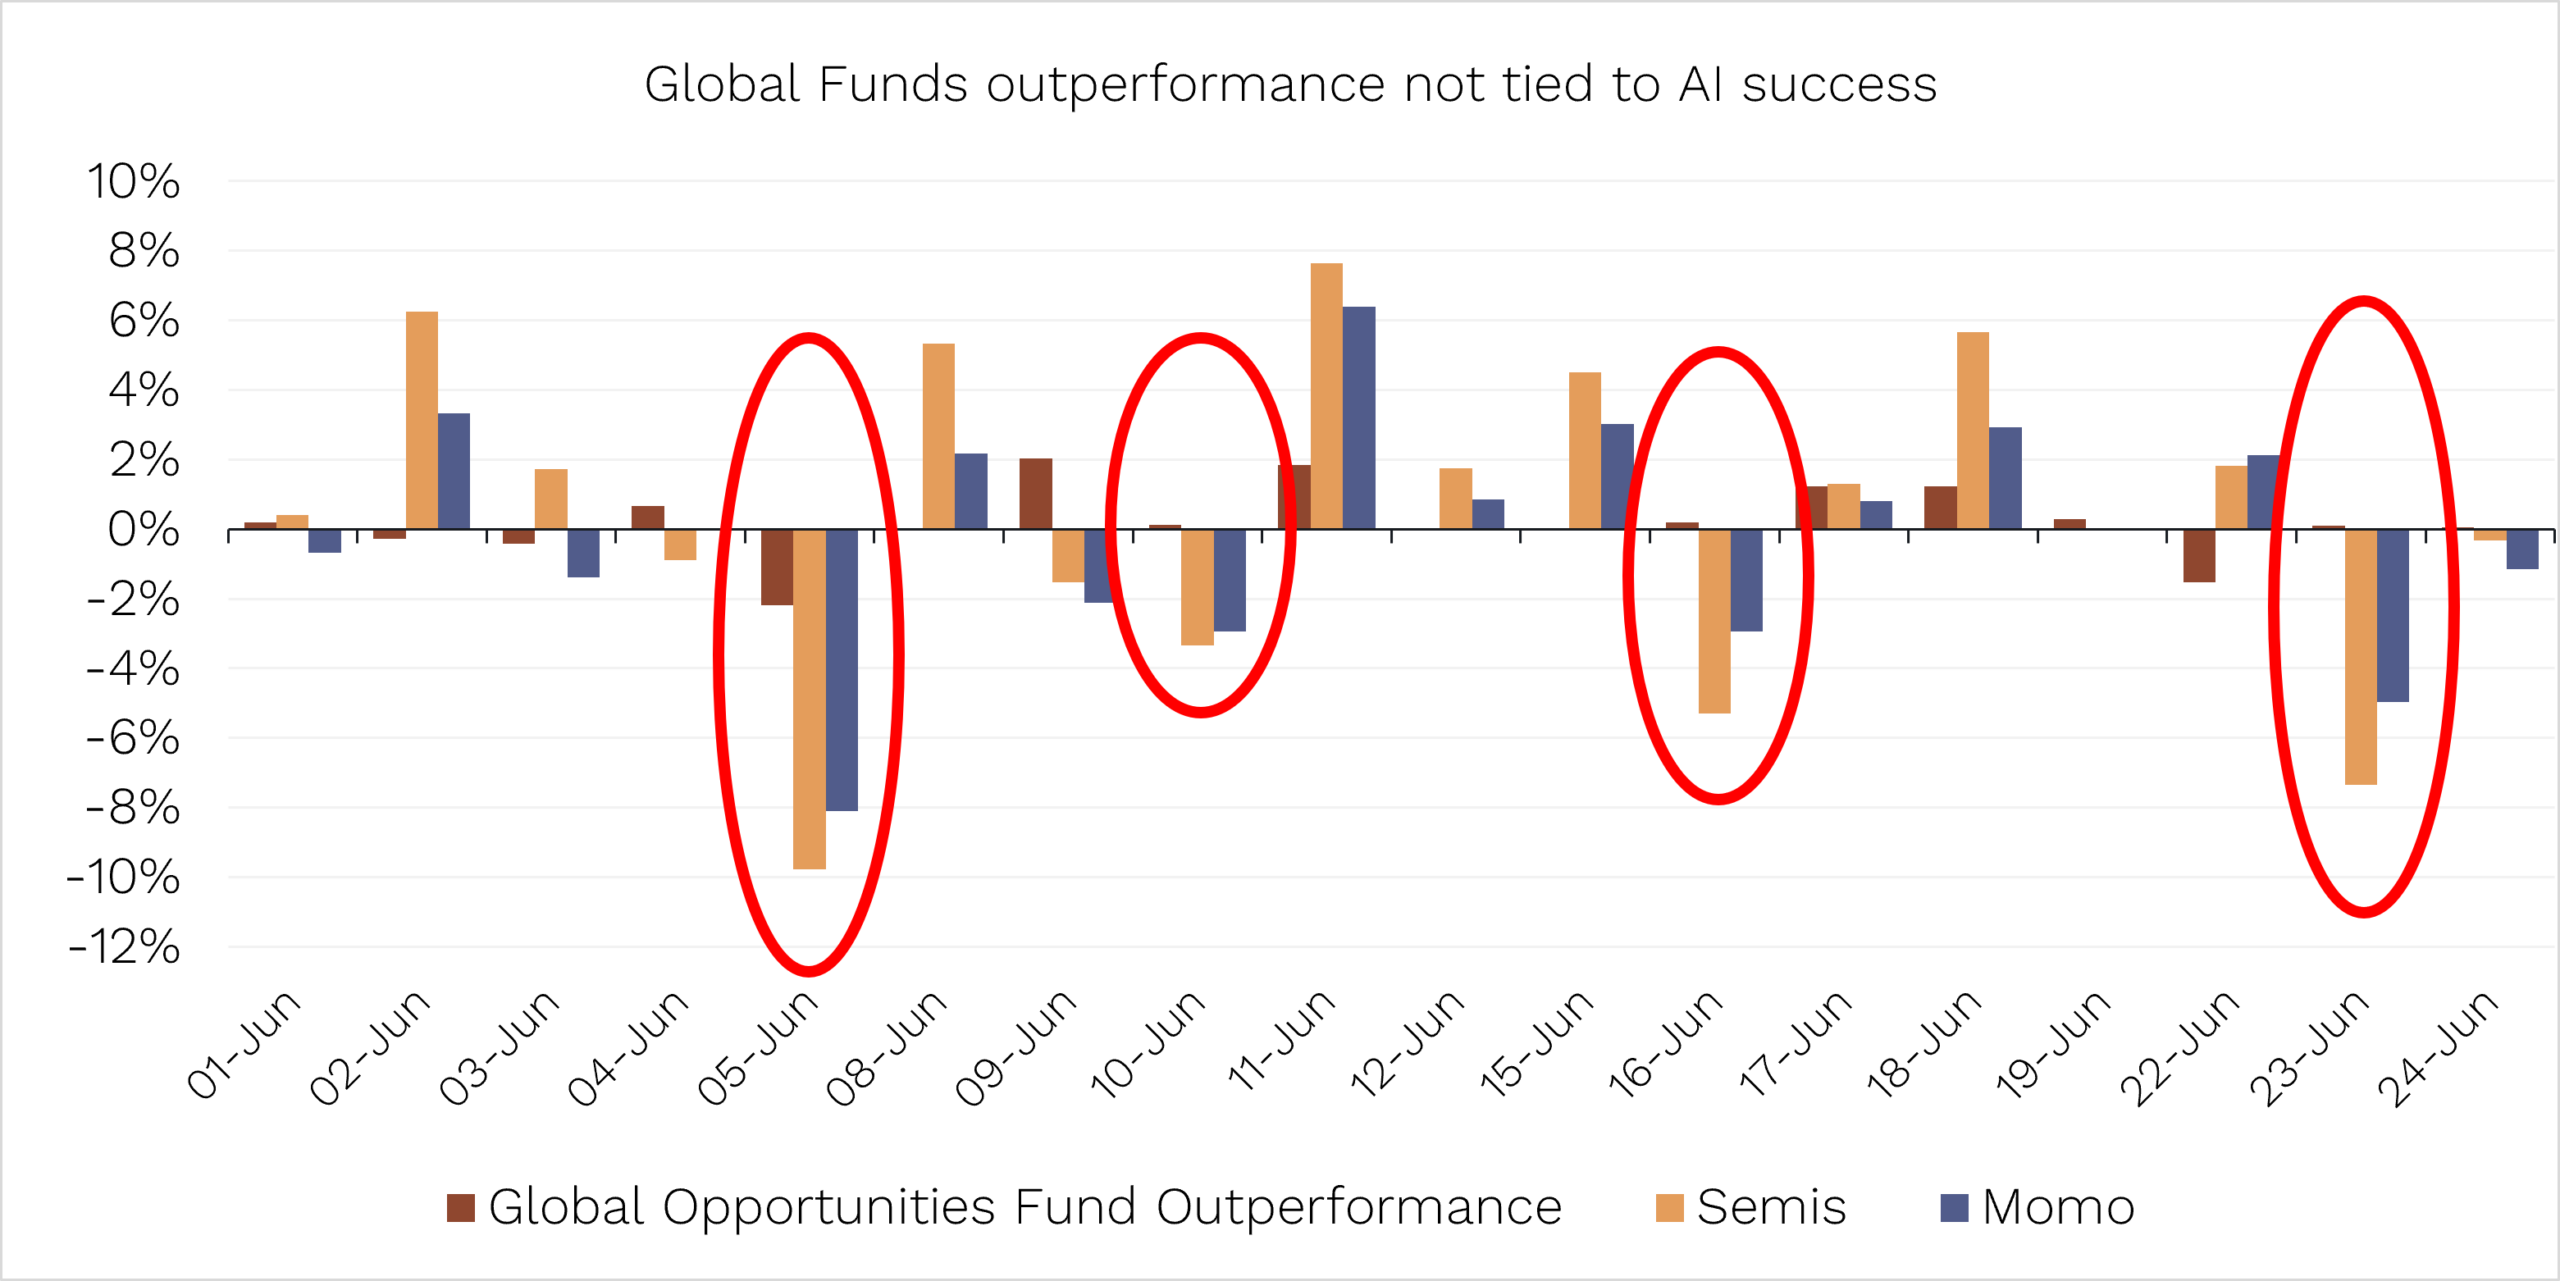
The chart below shows the Global Opportunities Fund’s daily outperformance in June against the daily returns of semiconductor and momentum stocks.
Source: Bloomberg. Data as of 30 June 2026.
On the days the AI complex was body slammed (circled in red), we still did just fine. In short:
- We hold roughly the index weight in the AI complex. We are not making hero bets either for an AI bubble or against … because we don’t pretend to know the answer.
- Our outperformance has come on AI up days and AI down days alike.
- Our returns are coming from idiosyncratic small caps marching to the beat of their own performance; not from stocks trading at 100 times revenue with a lot of expectations to deliver into.
That’s how we think about risk and portfolio construction today for our Global Funds.
A Deep Breadth, part two
Regular readers know we’ve been banging on about breadth for a while.
That is, we argued that the market’s rise would spread from a narrow number of stocks, most notably the Magnificent 7, to a broader range of stocks, including small caps, where we focus.
Well, here we are.
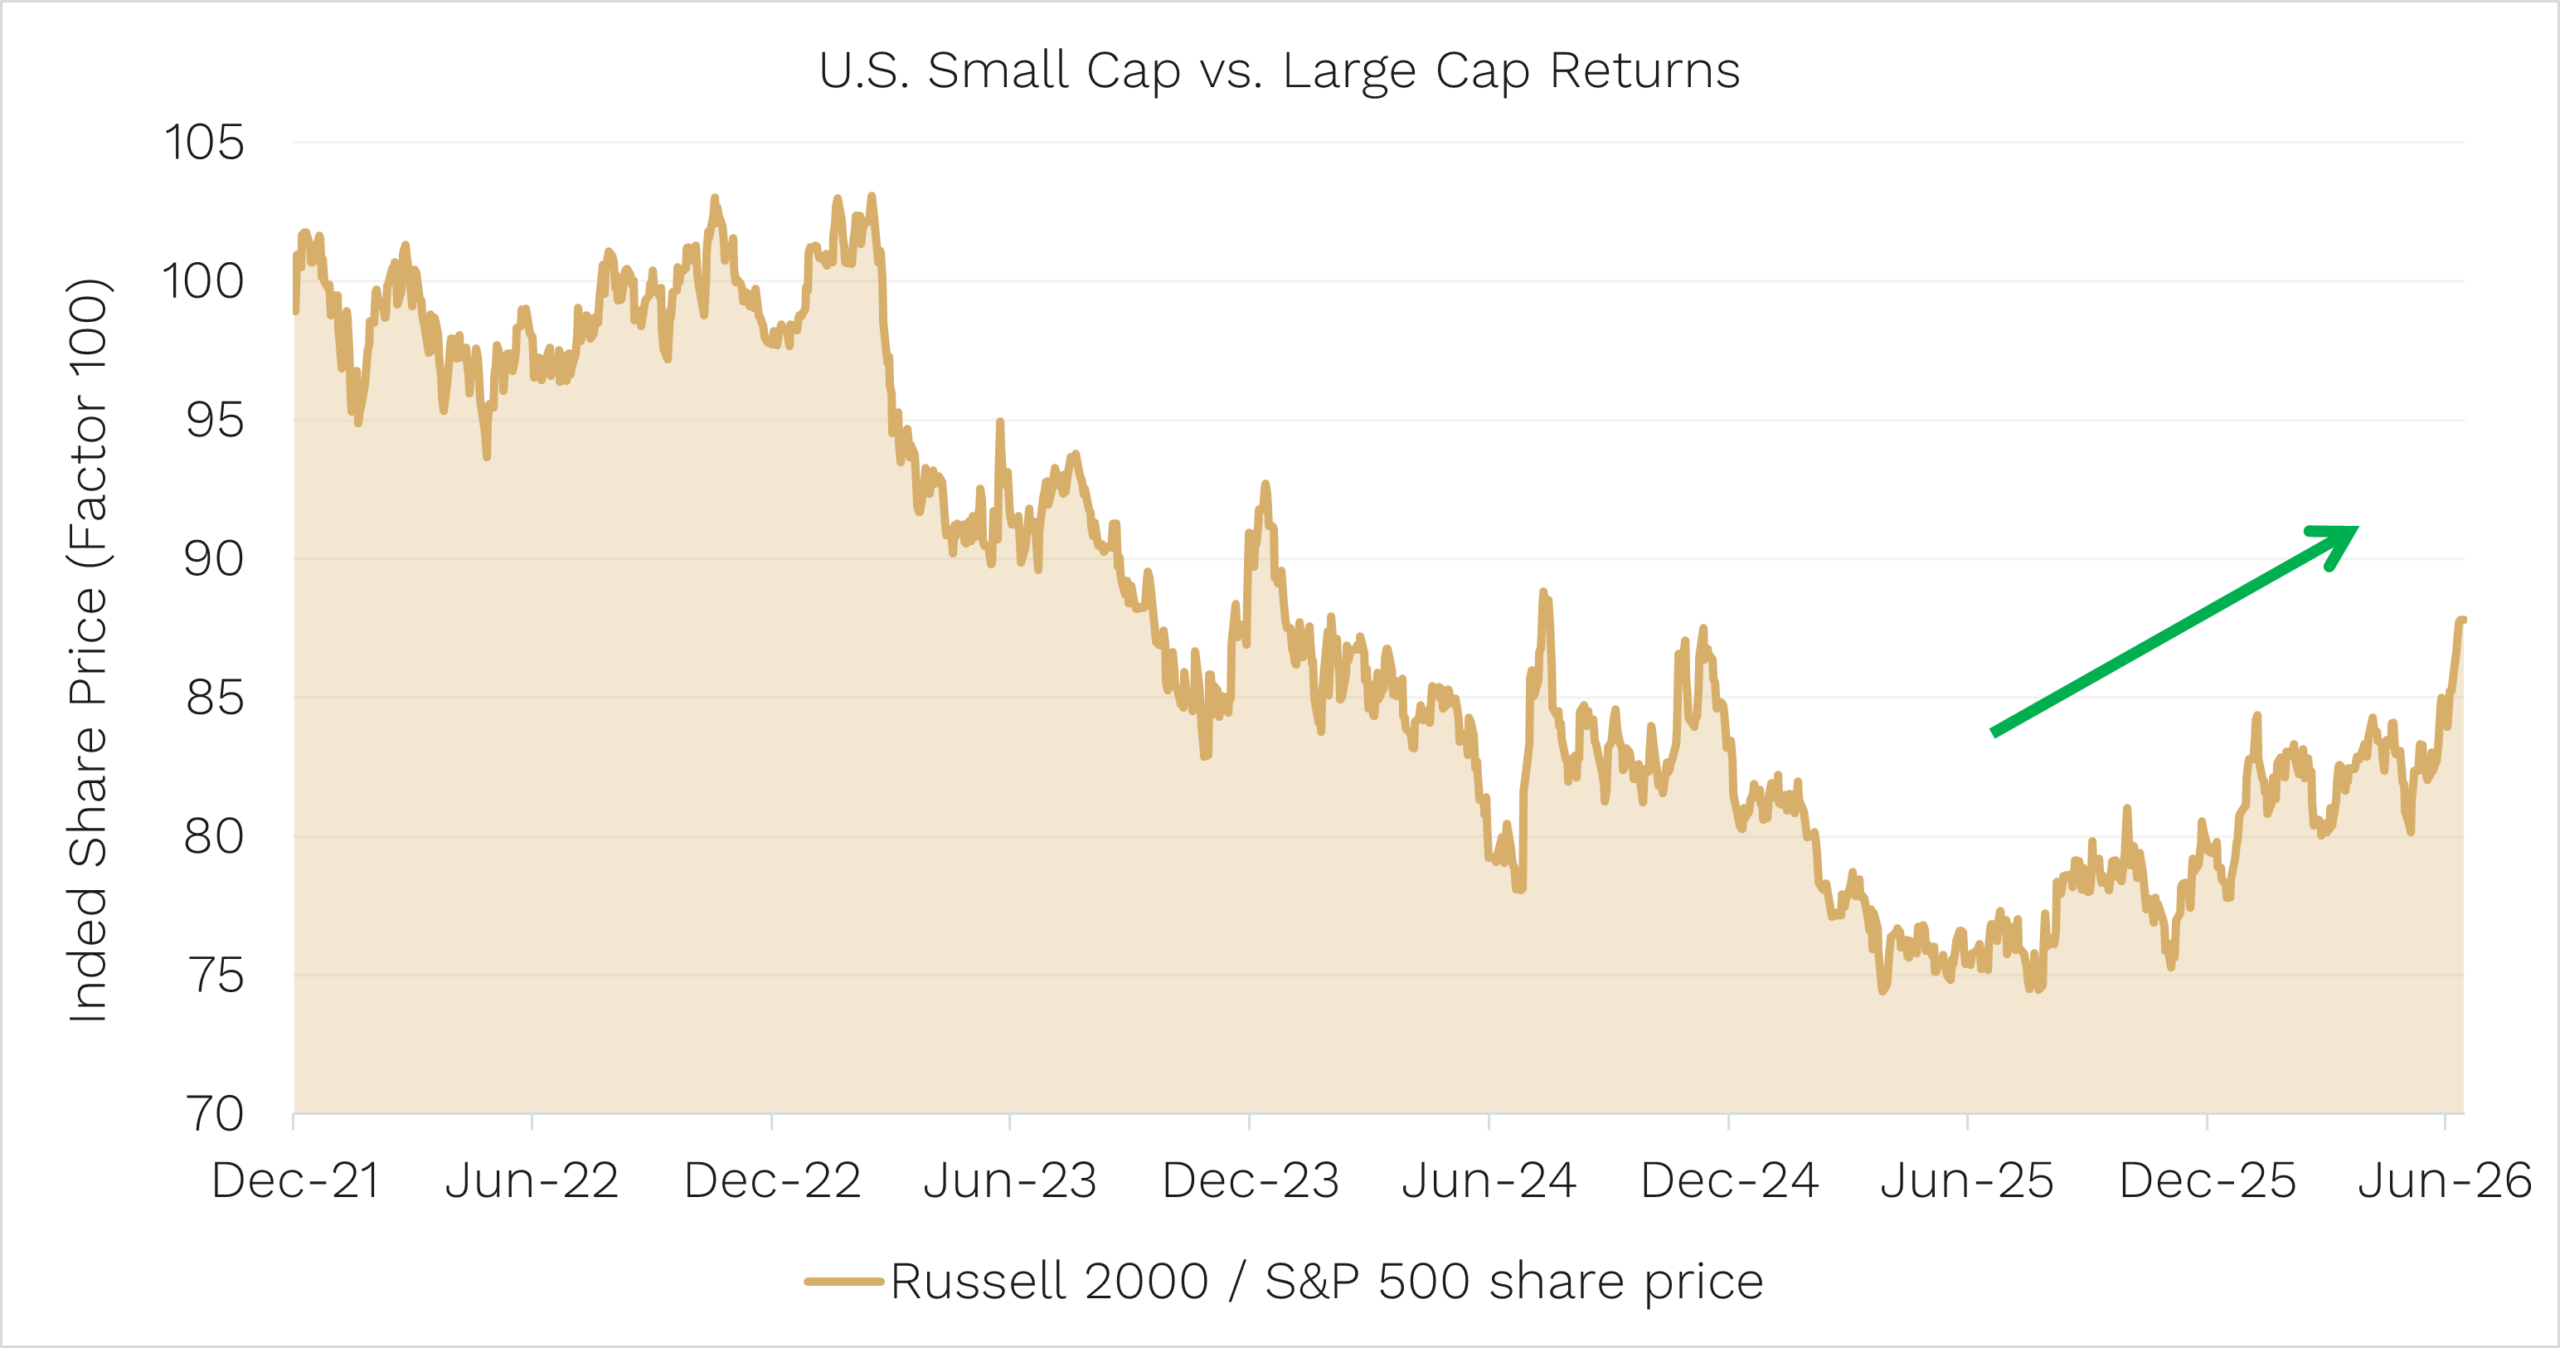
Source: Bloomberg. Data as of 30 June 2026.
After years of underperformance against the S&P 500, US small caps have finally turned the corner.
That continued in June, with the Russell 2000 index (small caps) up +3.7%. The S&P 500 index was actually down -1.0%, weighed down by the once-poster-child Magnificent 7, which fell -8.8%.
Last week in New York, we had lunch with Michael Kantrowitz of leading investment bank Piper Sandler. If he’s not the number one US equity strategist, he’s top three.
Michael’s big call: breadth is going to keep coming.
Hawkish Fed speak, dovish market speak
A key question that will help determine the likely persistence of breadth is: what will the new Fed Chair, Kevin Warsh, do next?
Warsh chaired his first meeting in June and struck a notably hawkish tone. Indeed, the Fed’s projections pencilled in one rate RISE this year.
You can blame the Iran war-induced inflation: oil, fertiliser and shipping costs all spiked as the Strait of Hormuz was choked off.
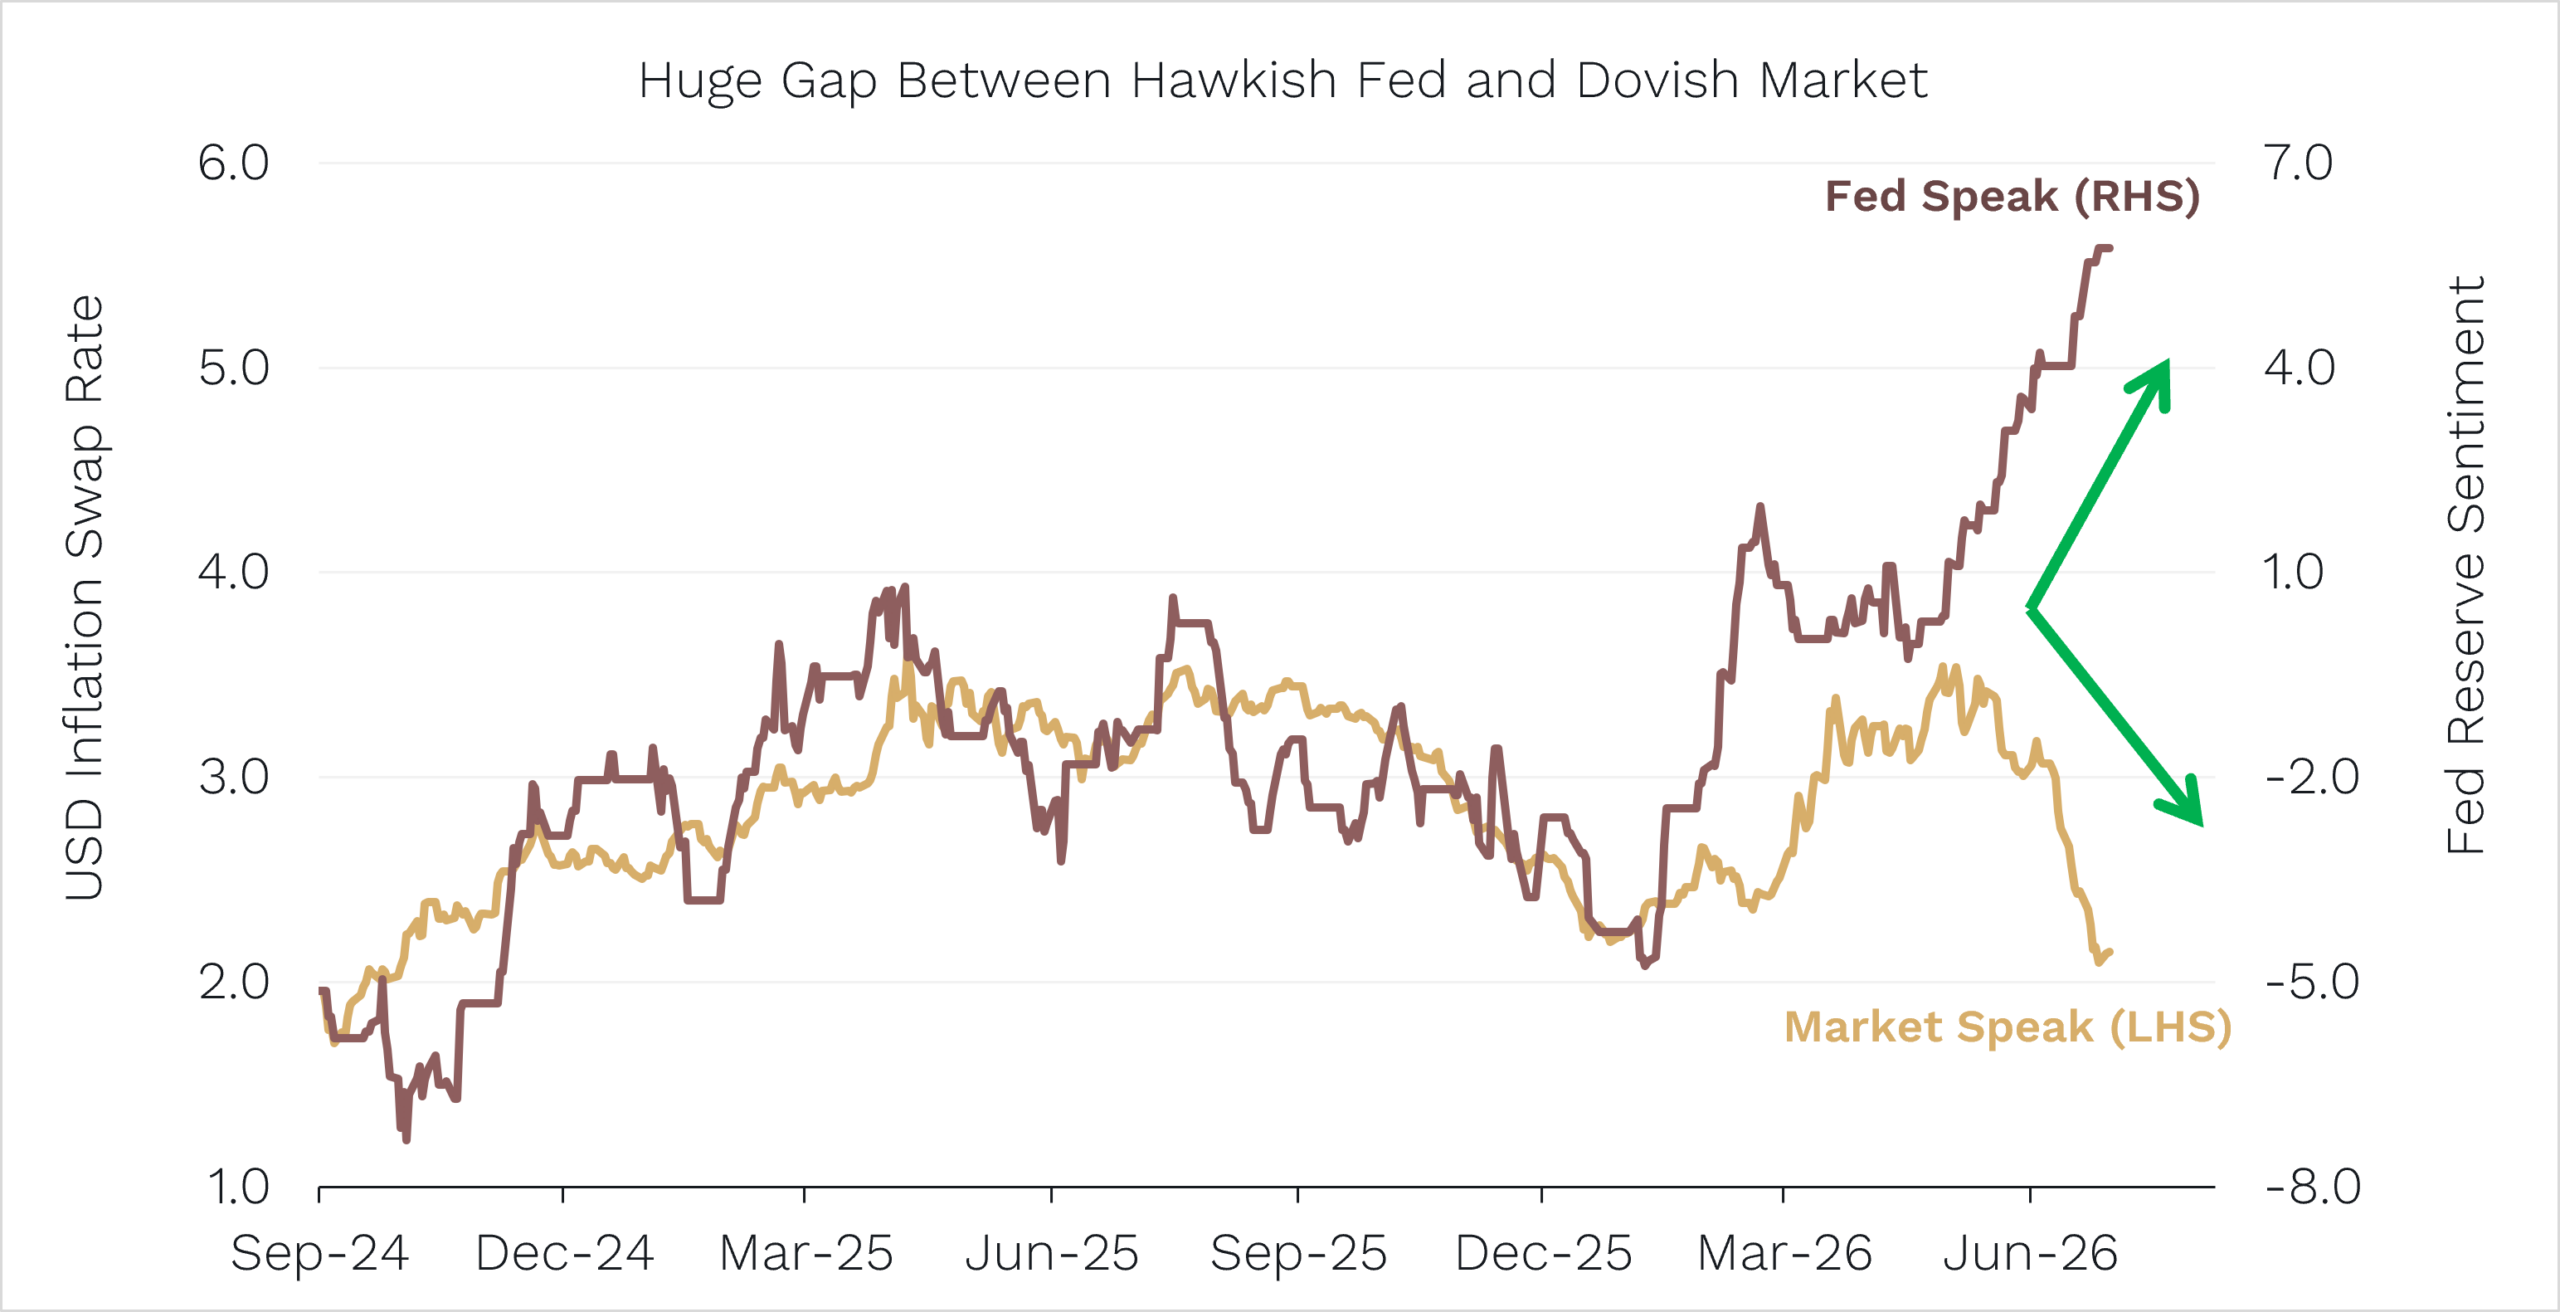
Source: Piper Sandler, June 2026.
Yet look at what markets are saying (the grey line above): inflation expectations are actually falling! Oil is now back near pre-war levels, and ships are getting through the Strait again.
Like Kantrowitz, we expect that the hike currently priced for late 2026 will likely not eventuate, which is positive for breadth and small caps.
Alongside falling inflation (and likely no rate rises), we also have other important conditions for breadth to continue:
- A US consumer who is looking stronger on the ground from all our recent company meetings.
- 75% of easings from the Fed over the last 18 months are still making their way through the economy.
- And Trump’s One Big Beautiful Bill household and business tax cuts.
Breadth is manna from heaven for small caps!
Is AI a bubble?
The big question we’re getting asked everywhere we go is whether AI is a bubble.
Sadly, if we are being honest, no one really knows with any high degree of confidence, including us.
What we do know is that this year not all ‘AI’ returns are the same.
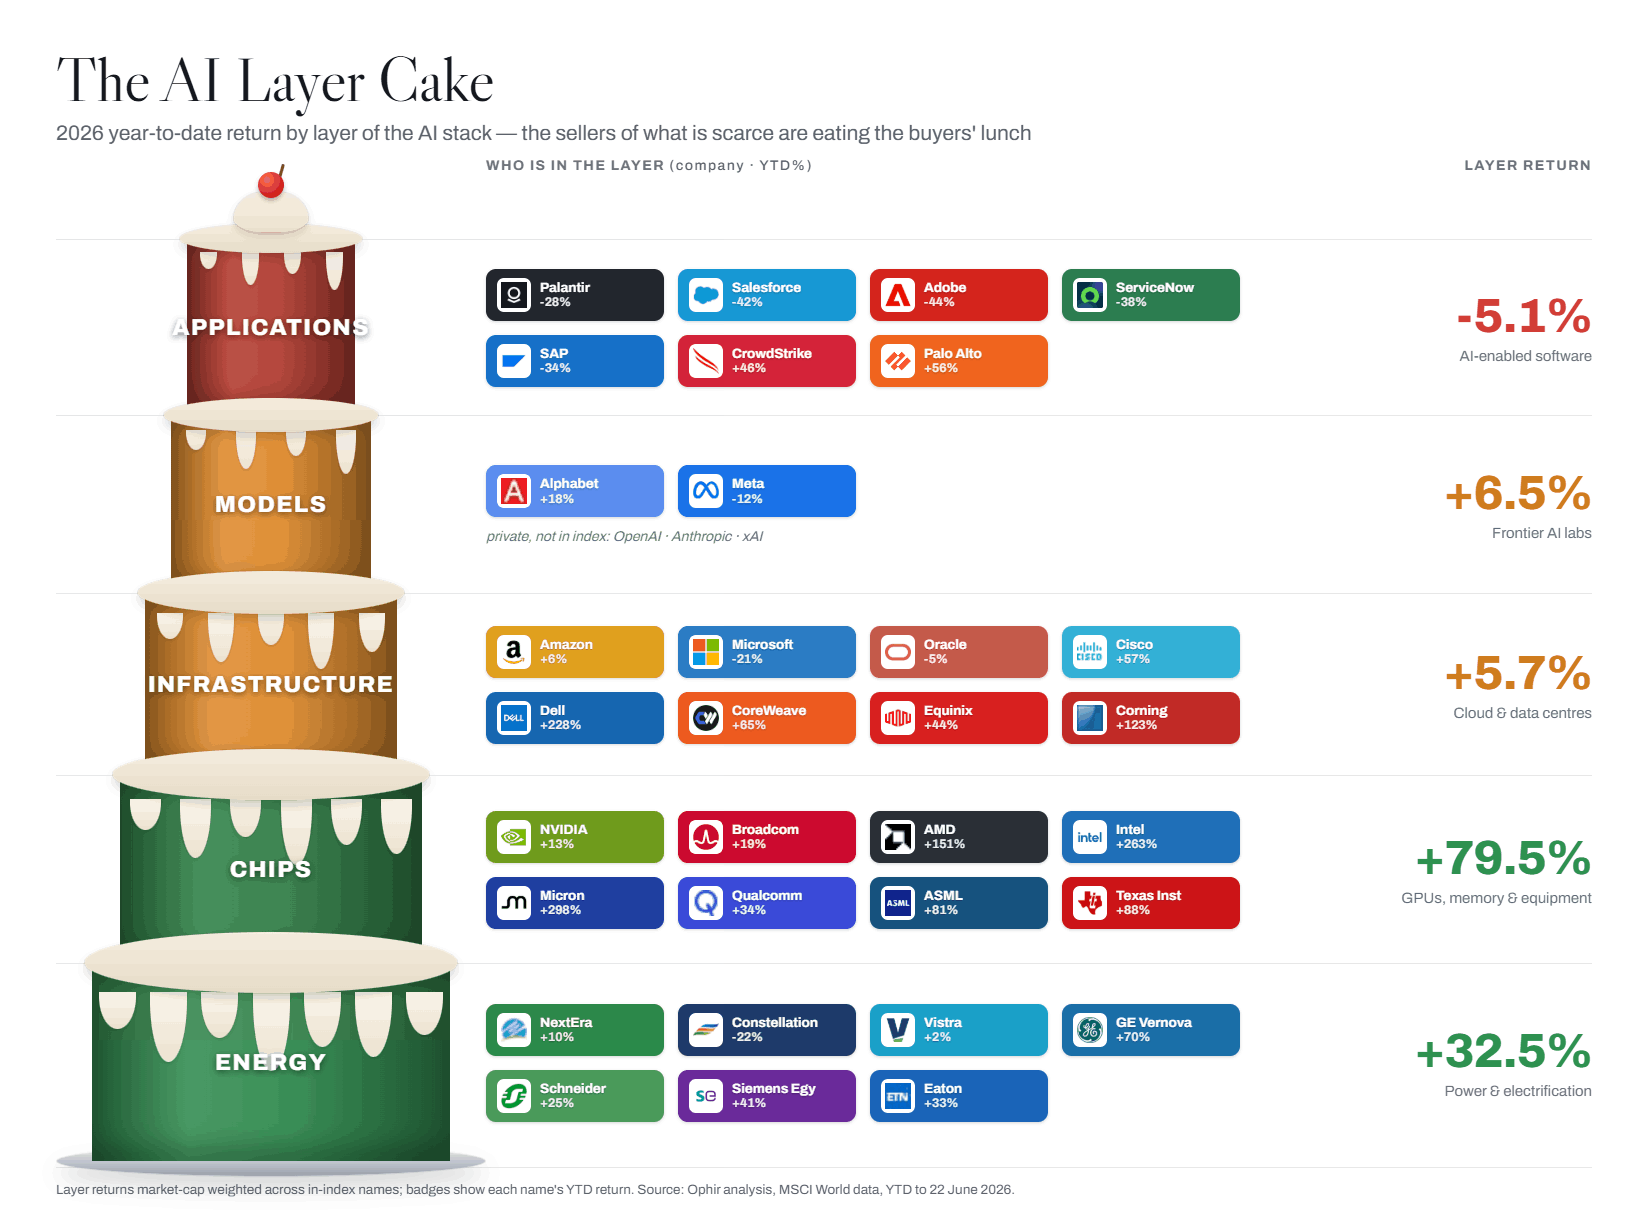
We mapped the AI stack from top to bottom. Then, to see each layer’s return weighted by market cap, we looked at what key players have actually returned so far in calendar 2026.
As you can see, in terms of returns, the cream is at the bottom of the cake:
- Energy and electrification names are up about a third, led by companies like GE Vernova at +70%.
- Chips and memory are up roughly 80%, with Micron nearly tripling, Intel up 263% and AMD up 151%.
The top of the cake – the shiny software companies now incorporating AI tools – is where money went to die. This Applications group is down 5%, but some members fared much worse – Adobe down 44%, Salesforce down 42% and ServiceNow down 38%.
There are some winners, but lots of potentially disrupted losers. Why? Well, it comes back to a simple idea: this year, companies are getting paid to sell what’s scarce, not buy it.
The cloud giants and software firms are the buyers. Their capex is revenue for the sellers – the chip, memory and power providers. (When there is a genuine shortage of something, the seller sets the price and keeps the margin. The buyer just keeps spending.)
The question investors need to ask is: does the cream stay at the bottom of the cake? Or does 2027 finally reward the layers doing the buying? In other words, will there be a ‘return on investment’ (ROI) from all that capex for the Application, Model and Infrastructure layers?
Our take is that there better be an ROI or this cake will crumble under its own weight.
Should I dump equities to avoid potential bubble trouble?
What if it is a bubble? Does that mean you should sell your equities?
Not necessarily. History suggests you shouldn’t abandon the share market.
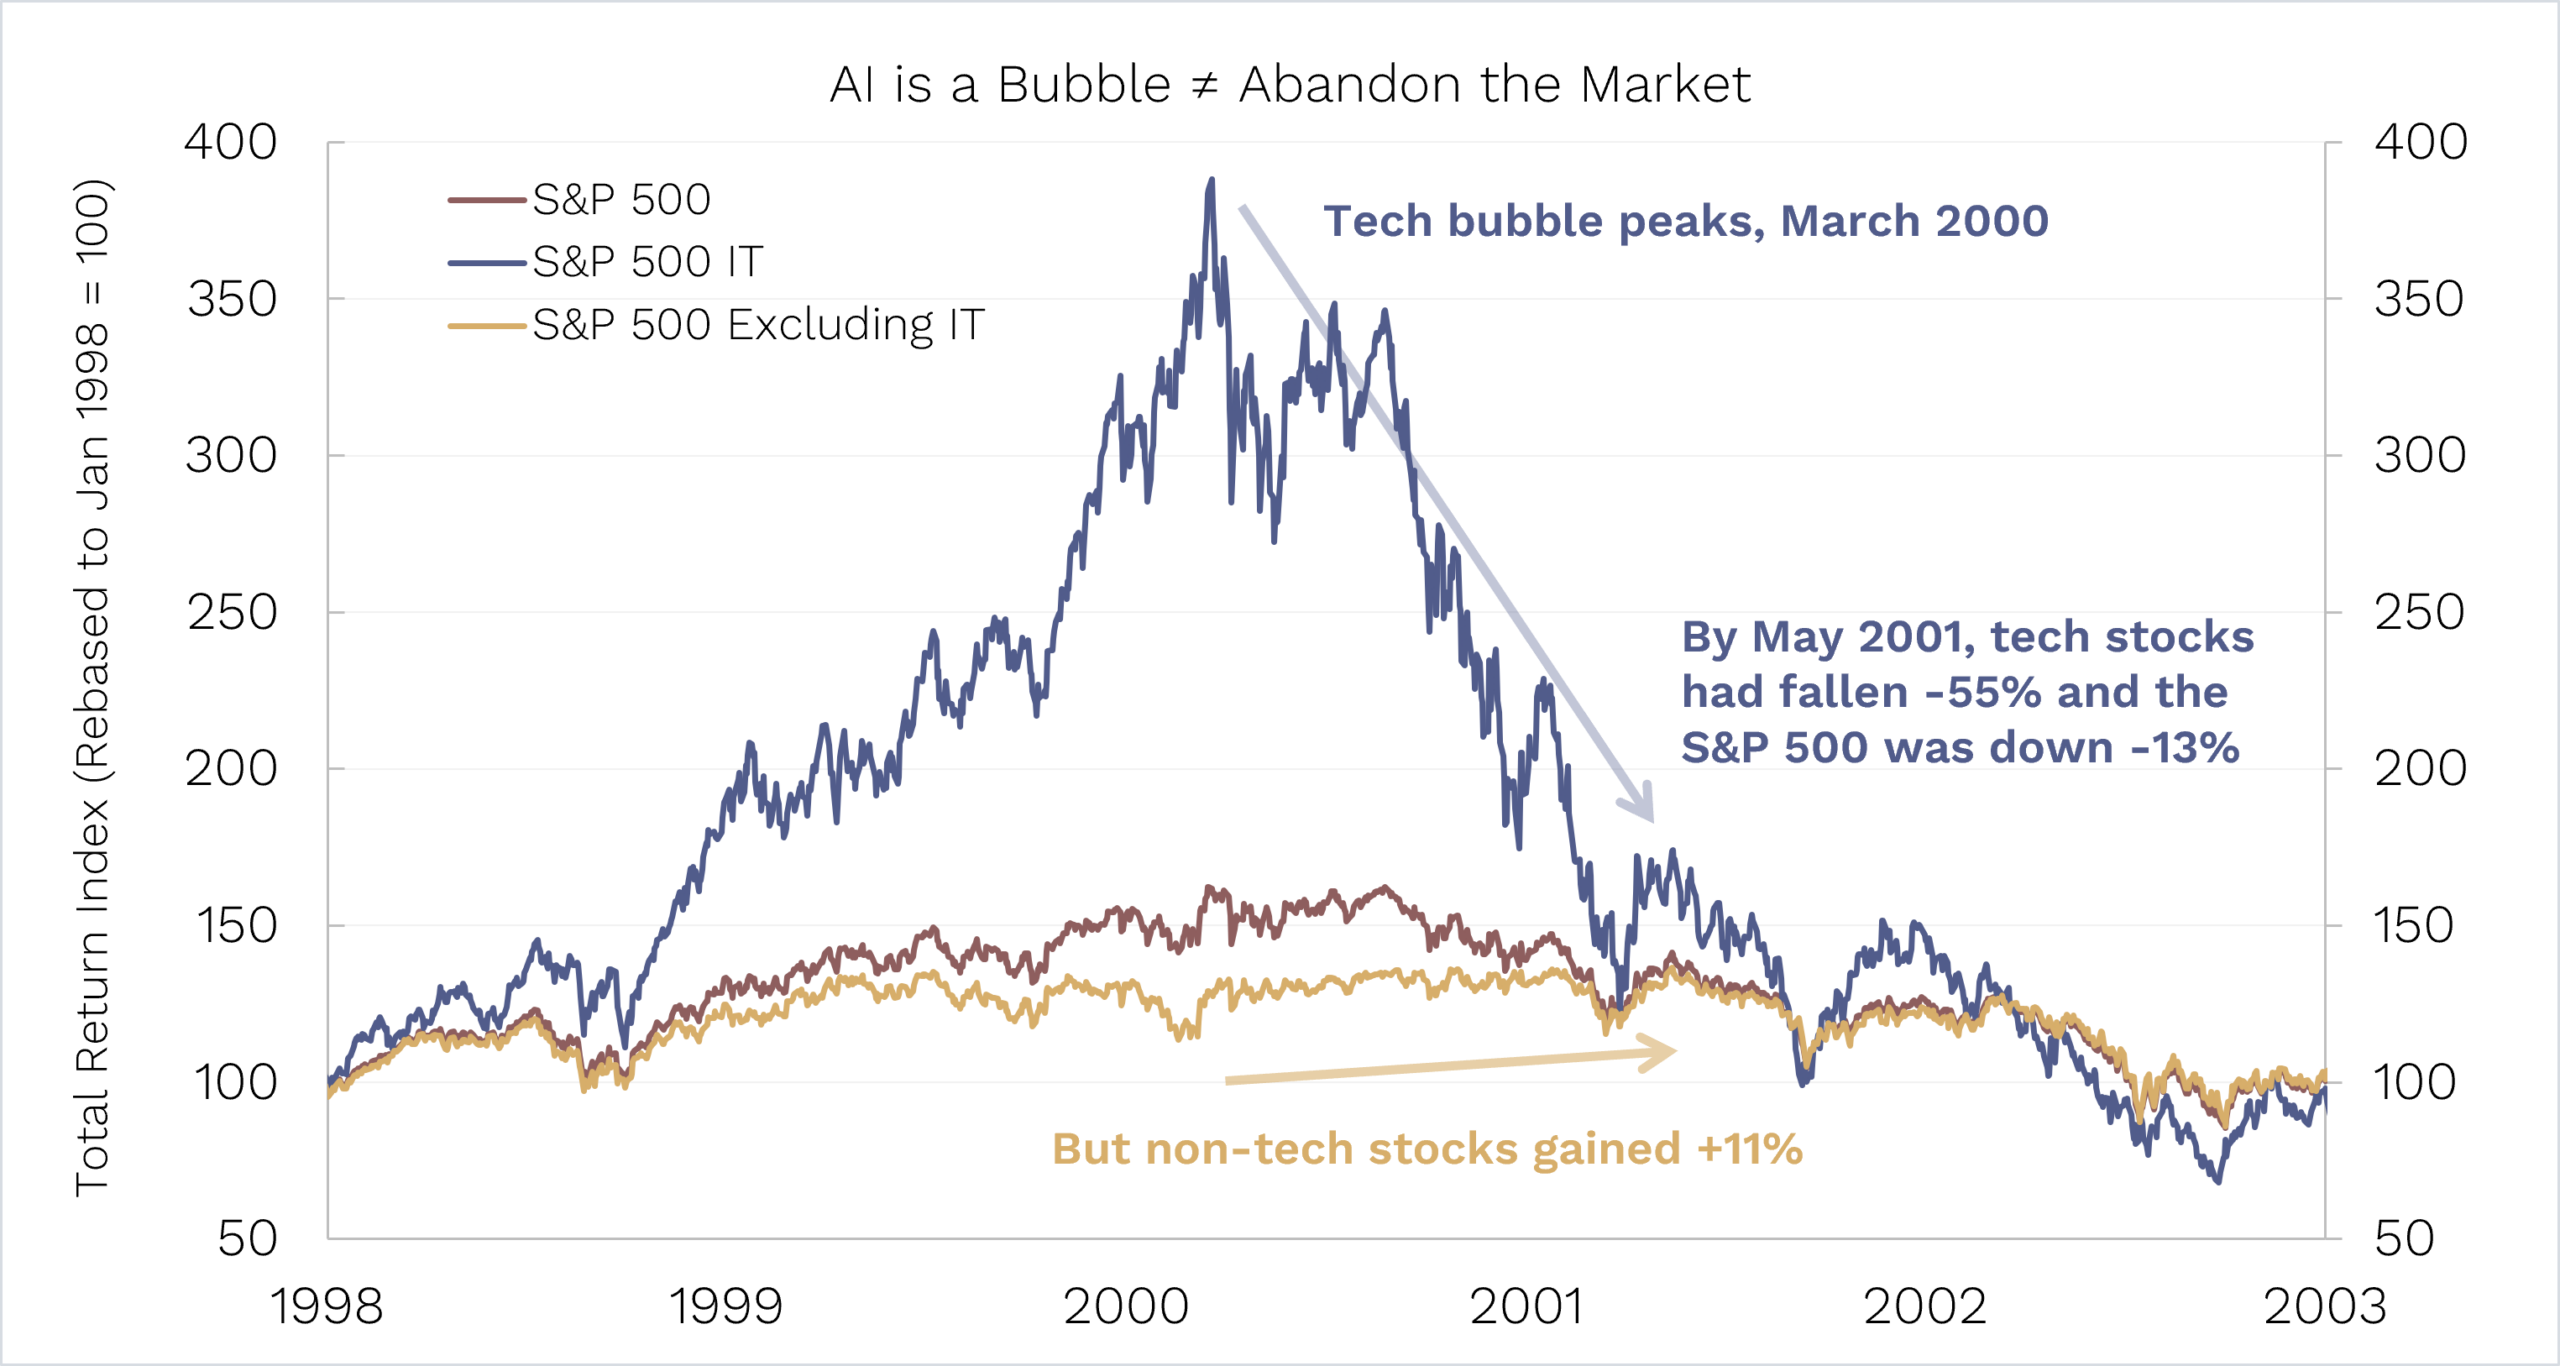
Source: BCA Research.
When the dot-com bubble burst, tech stocks fell 55% and the S&P 500 lost 13%. Yet over the following twelve months, the rest of the market rose around 11%.
Even in the textbook bubble, the one everyone points to, owning the rest of the market was a completely different experience to owning the thing that popped.
The bubble and the market are not the same animal. You don’t need to pick the top. You just need to avoid being overexposed to the froth when it pops.
To be clear: we don’t know that we are in an AI bubble.
The earnings sitting underneath these companies are tangible in a way that a lot of 1999 simply wasn’t. It might deflate. It might not. If Micron’s recent result is any indication, the AI theme doesn’t look to be slowing down today. Regardless, as we showed above, we’ve been able to outperform recently even on days when things like semiconductors at the heart of AI theme have been sold off.
Come see us: Meet the Managers is back
Finally, a date for your diary: Our annual Meet the Manager presentations run from late July into early August in every capital city around Australia. Seats are limited and we are near capacity for many of the events already.
If you’d like to hear how the Funds are positioned and grill us in person, email ophir@ophiram.com and we’ll save you a seat and a bite/drink.
As always, if you’d like to chat to us about any of the Funds, please feel free to call us on (02) 8188 0397 or email us at ophir@ophiram.com.
Thank you for entrusting your capital with us.
Kindest regards,
Andrew Mitchell & Steven Ng
Co-Founders & Senior Portfolio Managers
Ophir Asset Management
This document has been prepared by Ophir Asset Management Pty Ltd (ABN 88 156 146 717, AFSL 420082) (“Ophir”) and contains information about one or more managed investment schemes managed by Ophir (the “Funds”) as at the date of this document. The Trust Company (RE Services) Limited ABN 45 003 278 831, the responsible entity of, and issuer of units in, the Ophir High Conviction Fund (ASX: OPH), the Ophir Global Opportunities Fund and the Ophir Global High Conviction Fund. Ophir is the trustee and issuer of the Ophir Opportunities Fund.
This is general information only and is not intended to provide you with financial advice and does not consider your investment objectives, financial situation or particular needs. You should consider your own investment objectives, financial situation and particular needs before acting upon any information provided and consider seeking advice from a financial advisor if necessary. Before making an investment decision, you should read the relevant Product Disclosure Statement (“PDS”) and Target Market Determination (“TMD”) available at www.ophiram.com or by emailing Ophir at ophir@ophiram.com. The PDS does not constitute a direct or indirect offer of securities in the US to any US person as defined in Regulation S under the Securities Act of 1993 as amended (US Securities Act).
All Ophir Funds are deemed high risk within their respective Target Market Determination documentation. Ophir does not guarantee the performance of the Funds or return of capital. An investment may achieve a lower than expected return and investors risk losing some or all of their principal investment. Past performance is not a reliable indicator of future performance. Any opinions, forecasts, estimates or projections reflect our judgment at the date this was prepared, and are subject to change without notice. Rates of return cannot be guaranteed and any forecasts, estimates or projections as to future returns should not be relied on, as they are based on assumptions which may or may not ultimately be correct.
Actual returns could differ significantly from any forecasts, estimates or projections provided.
The Trust Company (RE Services) Limited is a part of the Perpetual group of companies. No company in the Perpetual Group (Perpetual Limited ABN 86 000 431 827 and its subsidiaries) guarantees the performance of any fund or the return of an investor’s capital.
1For small-cap investors, broader market participation may support investment returns; however, outcomes
remain uncertain and are subject to prevailing market conditions.