The 5 Most Important Charts Defining Markets Today
In this Letter to Investors, we look at
- How the bond market is causing Trump to Always Chicken Out (TACO) and what that means for the likely duration of the Iran War.
- Why small caps are in a much better position to weather the Iran oil price spike than the Russia/Ukraine spike of 2022.
- The curious case of Nvidia now being cheaper than a global oil giant.
- How the RBA’s rate hikes have put Aussie small caps on sale, and why that’s great news for future returns.
I must say, it’s been tough choosing when to sit down and write this Letter. With a new rolling deadline for the Iran war always “just hours away”, I kept putting it off.
A thought invariably rolled through my mind: “Before putting pen to paper, let’s wait for the arrival of the next big market-moving news.”
The reality, though, is in a one-variable market – with daily market moves almost solely dictated by war headlines – it’s best just to get on with it.
Why? Because the end of the war could be this week … or it could still be months away.
(HINT: As we’ll elaborate later, it’s more likely weeks than months. Polymarket has a 78% chance that Trump will announce the end of military operations against Iran by 30 June.)
But our edge is not trying to ‘outguess’ the millions of other investors about Trump’s next tweet; our edge is analysing small-cap companies, where few people are looking, through intensive research and travel.
So, while our Ophir Funds were down fairly in line with the market/their benchmarks in March, that’s ok with us.
Every one of the circa 80 global and regional share market indices we track were down in March due to the war, so it was hard to avoid!
(For us to have materially outperformed last month, we would have had to change our style from Growth to Value, and buy energy, financials, telcos and utilities! That’s not quite our core style.)
In this month’s Letter, we share five charts that have really caught our attention over the past month and helped shape our thinking about markets.
But first, thank the bond market for a happy TACO-versary
Trump Always Chickens Out, or TACO, has been used to describe President Trump’s tendency to escalate and threaten, then, when faced with pressure, to de-escalate and back down.
Just over a year ago, on his so-called ‘Liberation Day’, April 2, 2025, Trump tabled a broad package of reciprocal tariffs. Share markets plummeted. A few days later, Trump retreated and announced a 90-day grace period on tariffs.
What caused the about-face?
It’s widely speculated that he got a tap on the shoulder from his Treasury Secretary, Scott Bessent, who saw the 10-year bond yield shoot up to 4.5% and warned it would worsen the US’s already ballooning debt costs and fiscal deficit.
When you have US$39 trillion in government debt and are adding a US$2 trillion fiscal deficit to it every year, higher interest rates are like pouring kerosene on an already raging inferno.
Fast forward almost exactly a year, and on April 7, Trump warned he would obliterate Iran and a “whole civilisation will die” if Iran didn’t open the Strait of Hormuz. Then, a day later, he agreed to a last-minute two-week ceasefire.
As higher oil prices stoked inflation and rate rise worries, the 10-year bond yield rose from around 3.9% at the start of the war in late February to over 4.4% in late March.
Chart 1. TACOnomics
When the 10-year (or Bessent) speaks, Trump listens.
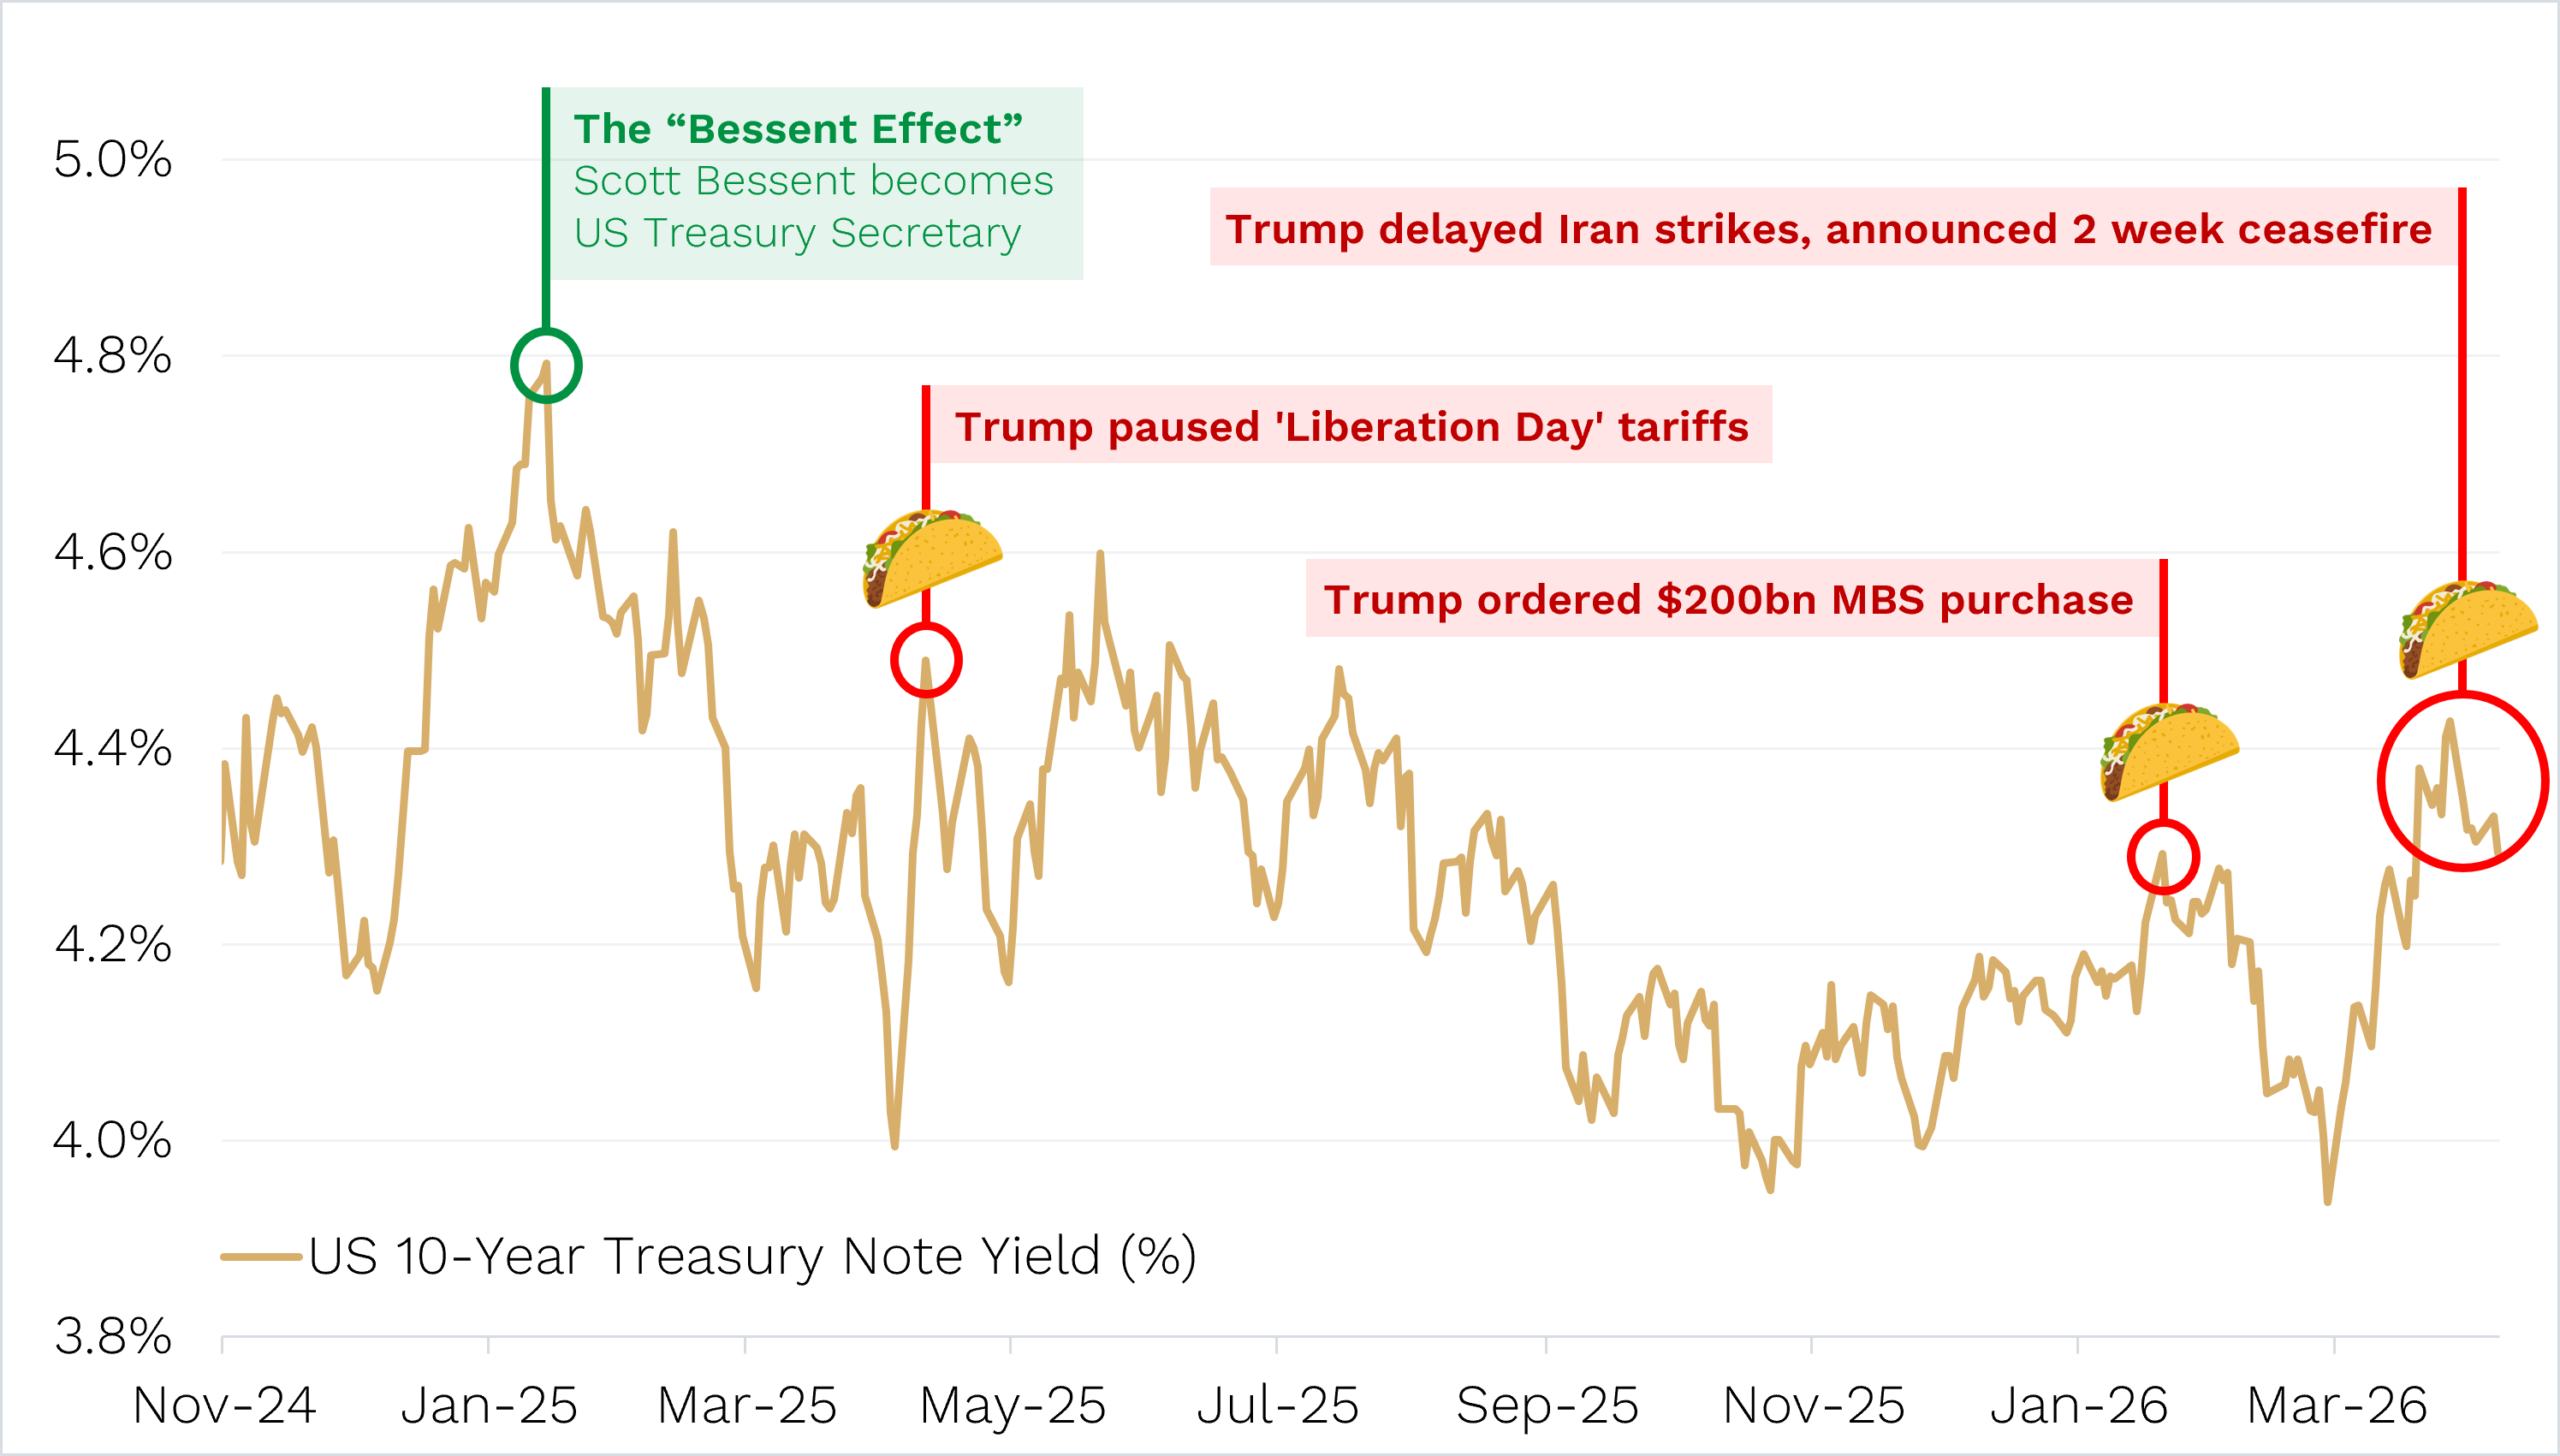
Source: Ophir. Bloomberg.
Again, it was the bond market and higher yields that caused Trump to TACO and not let the war go on too long.
It reminds us again of that famous quote by Bill Clinton’s political advisor, James Carville:
“I used to think that if there was reincarnation, I wanted to come back as the President or the Pope or as a .400 baseball hitter. But now I would like to come back as the bond market. You can intimidate everybody.”
Everybody, including Donald Trump.
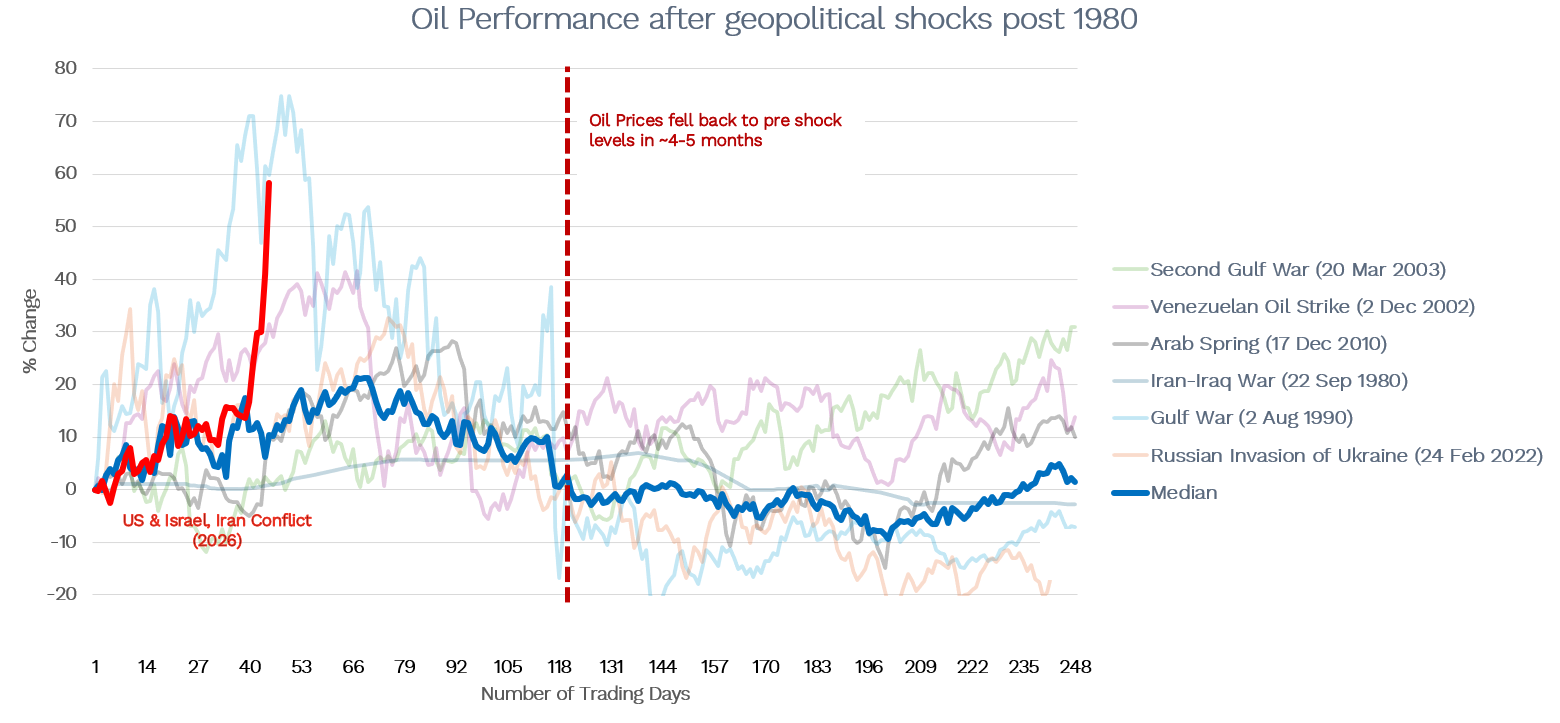
We think this is more likely to mean, like most geopolitical events, that the negative share market impact is relatively short lived before the recovery takes hold.
Charts 2 & 3. Margin of Safety
For small caps, this will not be a repeat of the 2022 oil spike.
While the war may not drag on too long, small-cap investors could be forgiven for having PTSD. The current oil price spike, after all, might remind them of 2022.
Almost exactly four years before the US and Israel launched coordinated military operations on Iran, Russia (the world’s third-largest oil producer) invaded Ukraine.
This led to a sequence of events you can see in the chart below. Oil (brown line) spiked and fuelled already-rising post-COVID inflation.
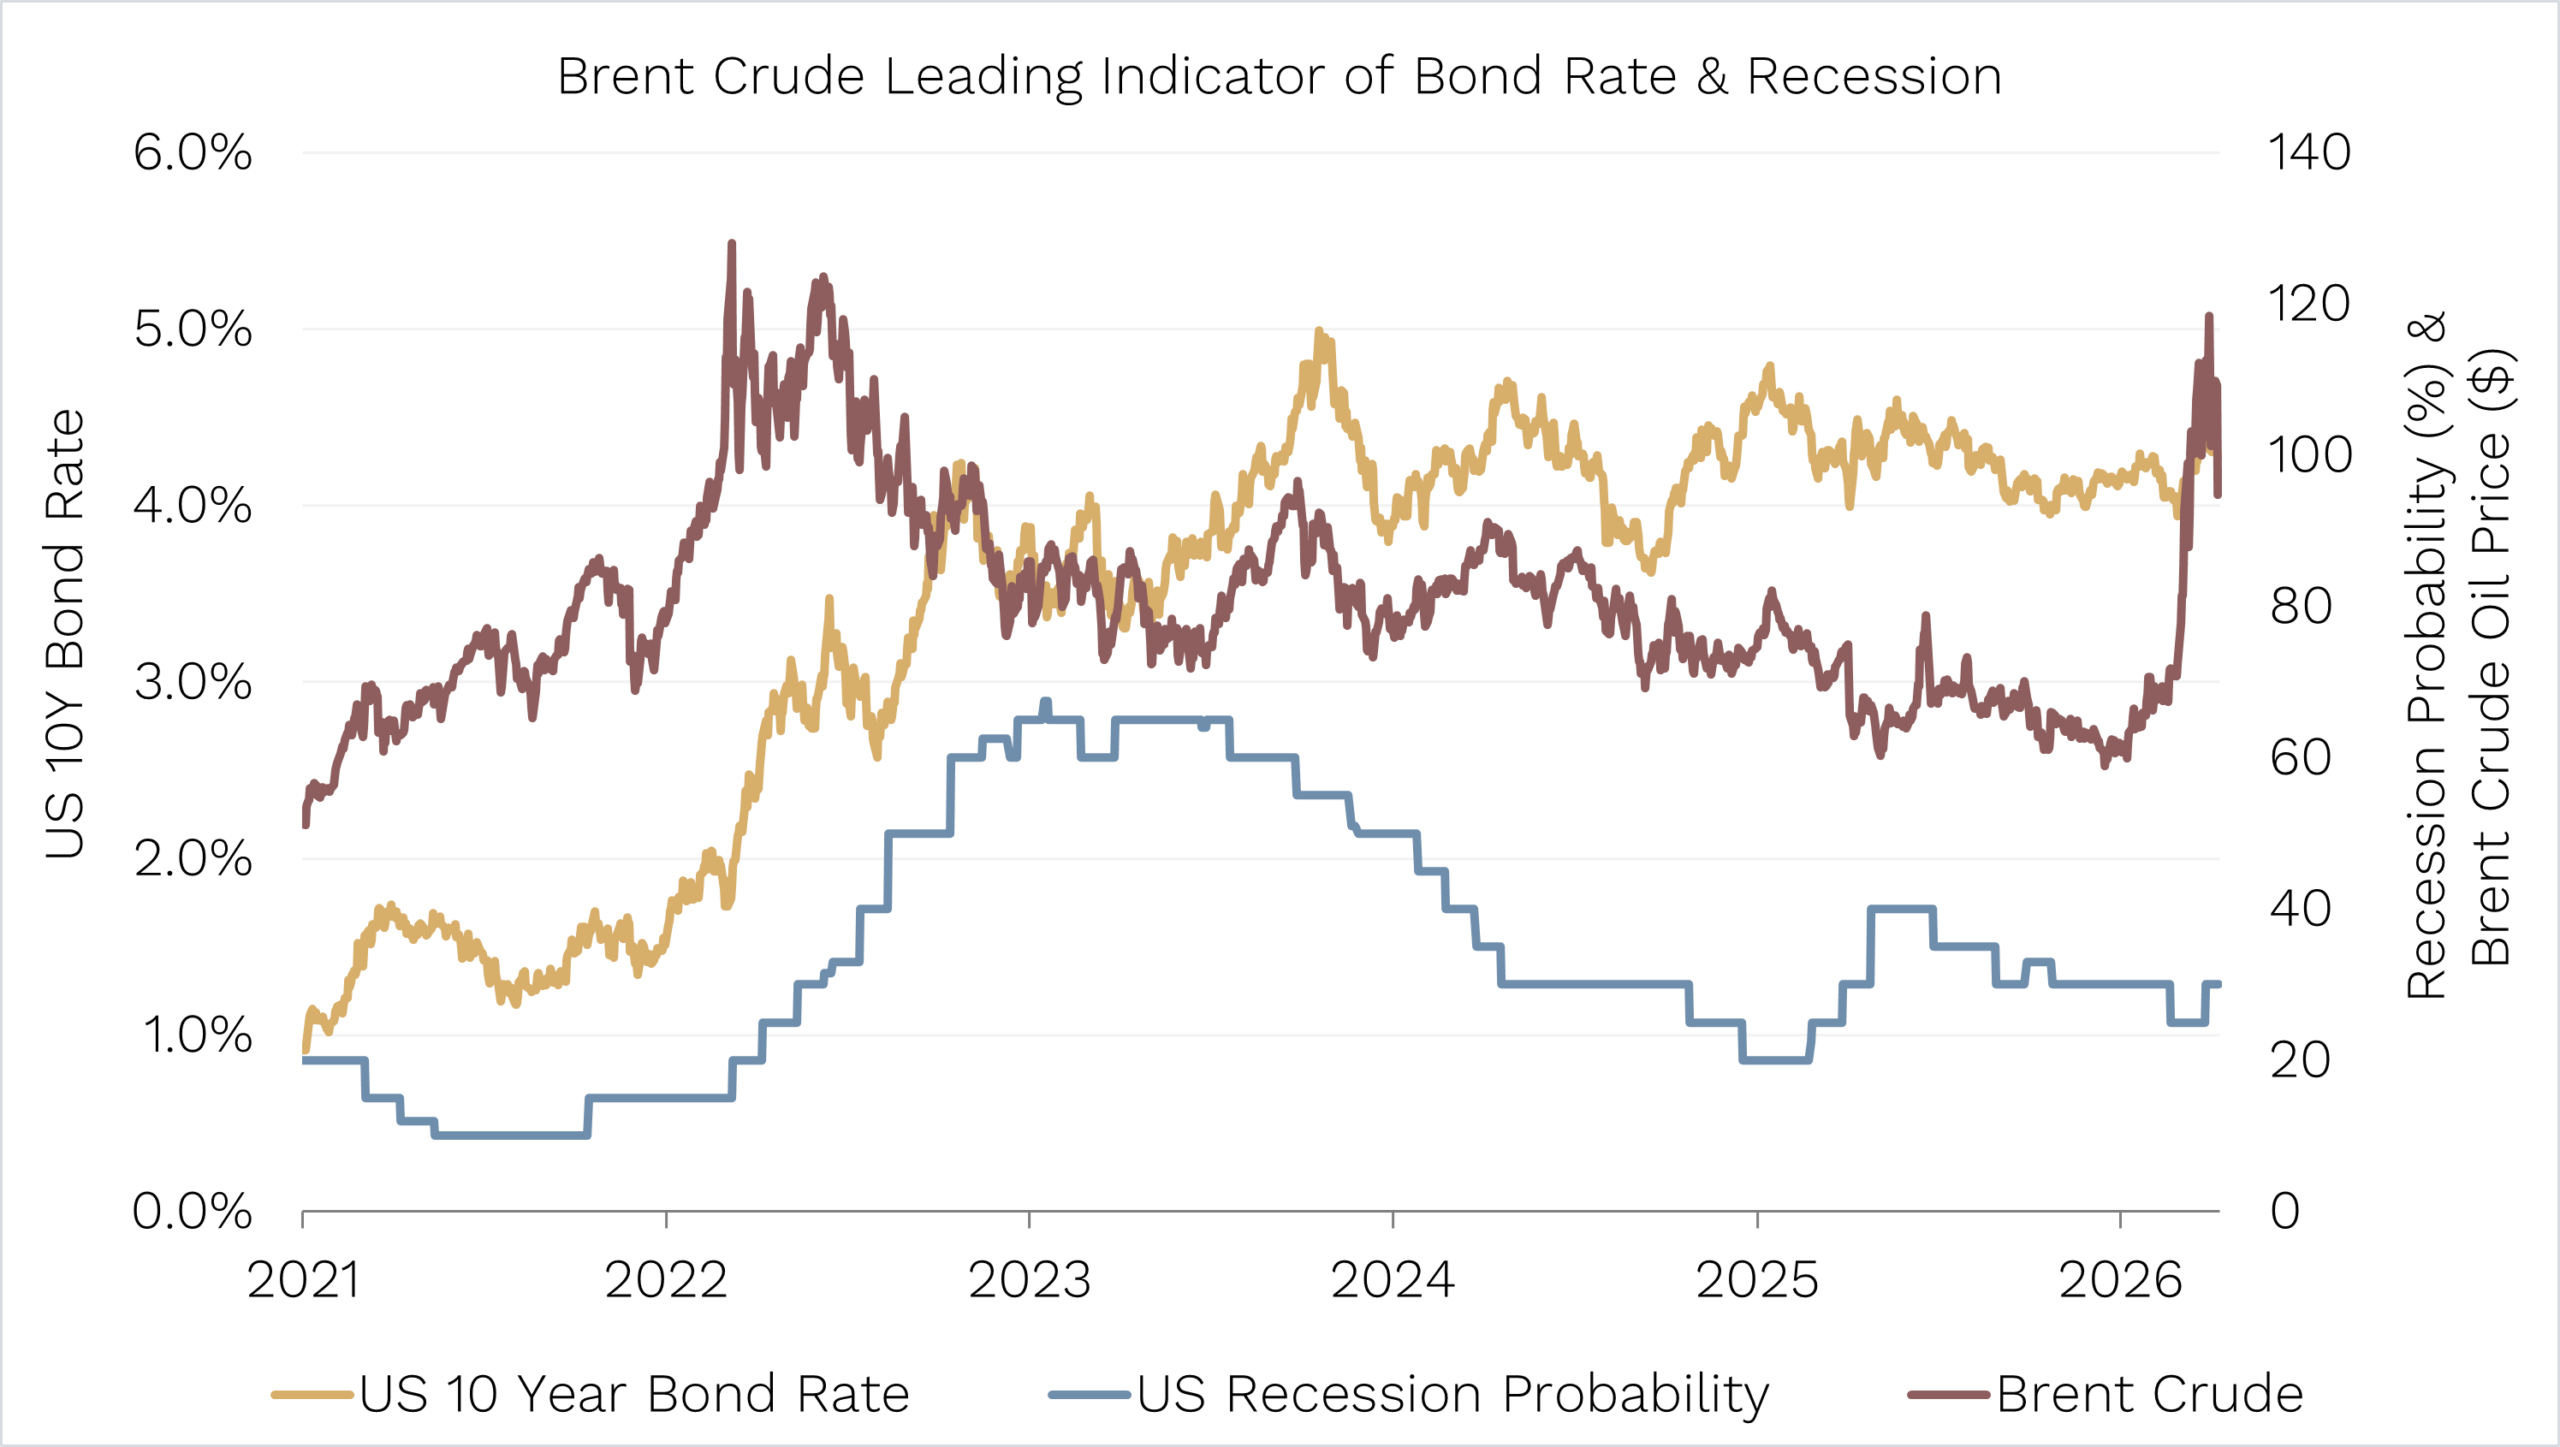
Source: Ophir. Bloomberg.
Both short-term interest rates (controlled by central banks) and long-term interest rates (controlled by the market) started rocketing higher. The gold line shows the US 10-year bond yield (the same one TACO’ing Trump in the first chart in this Letter).
Already sensing that rates would rise during the COVID recovery, equity markets had begun selling off in 2021, but the falls continued in 2022 on the back of the oil spike. You can see this for both US large caps (green line) and small caps (orange line) in the chart below, where we highlight the fall in their P/E ratios.
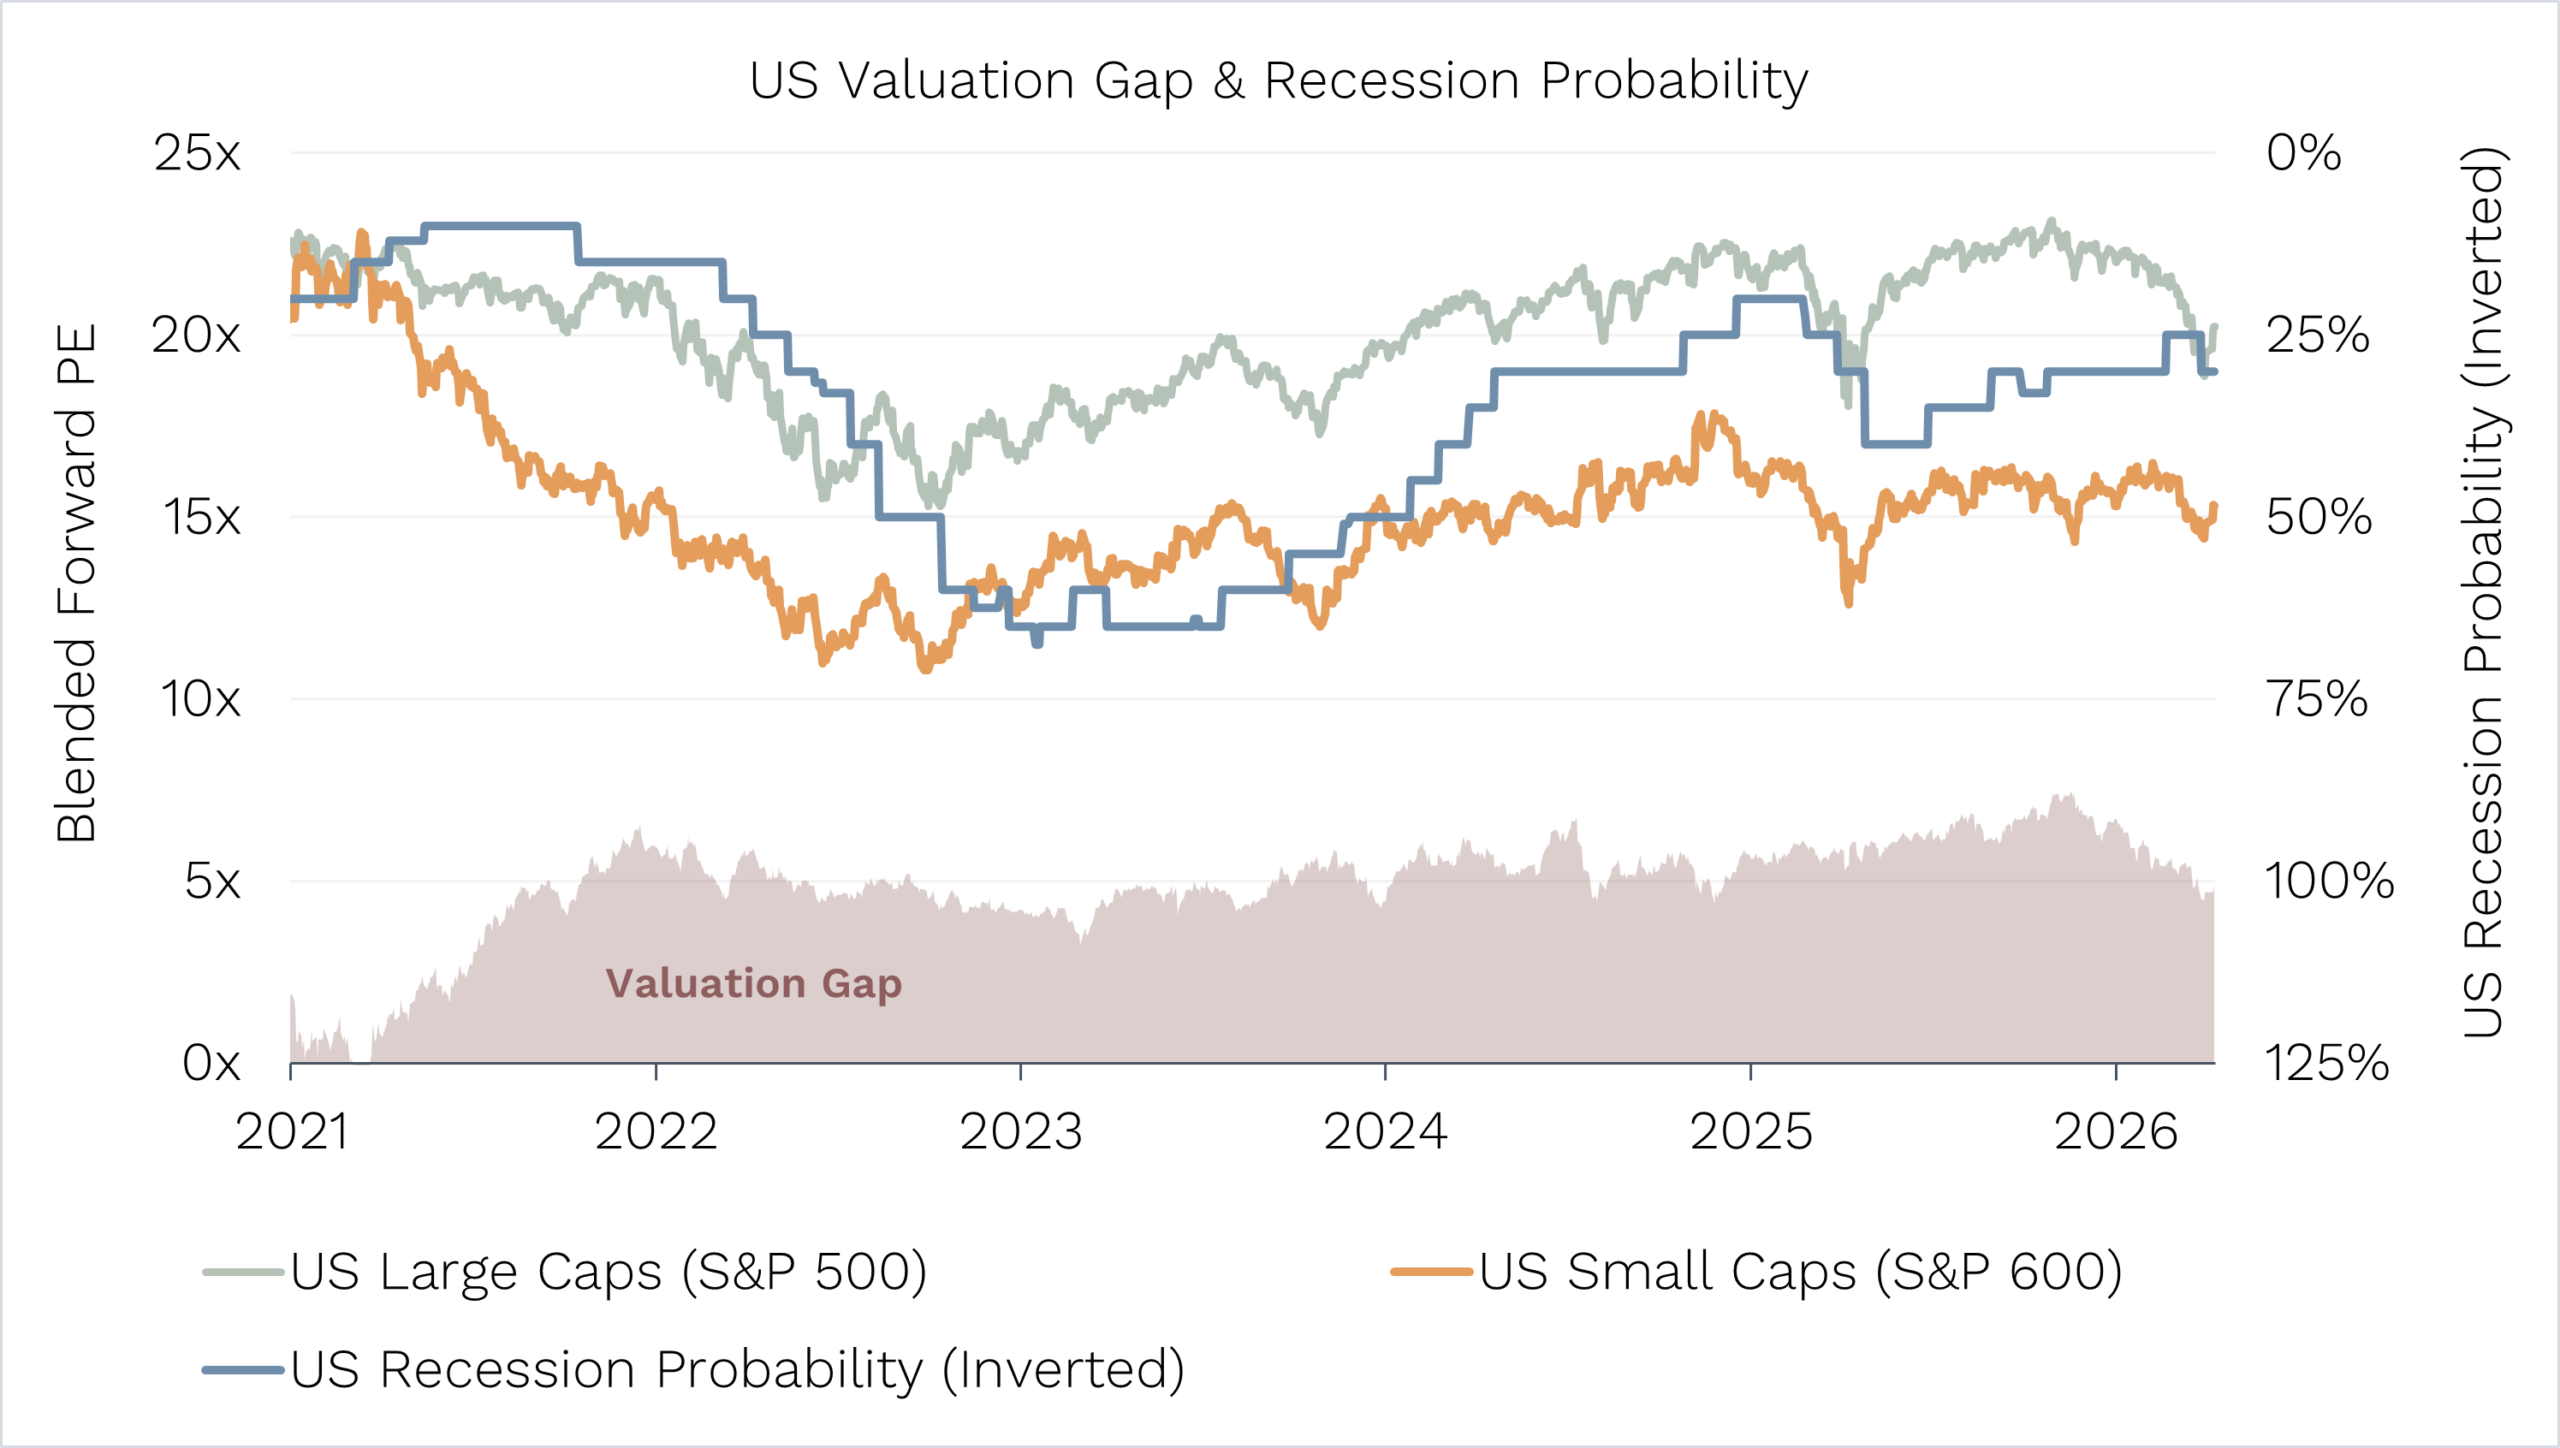
Source: Ophir. Bloomberg.
You can also clearly see that small-cap valuations fell much more – as we were painfully aware here at Ophir!
(All the while, the recession probability was rising in the US (inverted blue line) and peaked at over 60% in late 2022/2023.)
Which brings us to THE question.
Should we be afraid that today’s high oil prices are going to cause a replay sell-off of small caps?
If oil prices stay high enough for long enough, it’s certainly a possibility that central banks may have to raise interest rates to combat higher inflation, increasing the risk of recession and share market falls.
Markets today, however, are not really expecting that scenario for a couple of key reasons:
- 2022 was an oil price spike on top of already high and rising inflation from COVID. By contrast, this time, prior to the Iran war, US inflation had been falling, and there were expectations of Fed rate cuts, not hikes.
- Essentially, this current spike in oil is self-imposed by the US. It can wind down military operations and relieve pressure on the oil price.
In many ways, Trump will have to weigh a long, drawn-out war (if needed to reach objectives in Iran) against the economic cost to the US (higher inflation and interest rates and potential recession).
Most suspect that, because it will likely cost him dearly at the mid-term elections in November, Trump won’t think the cost of a long war is worth bearing.
That is likely why recession probabilities haven’t spiked and why the market is not yet pricing in rate hikes by the Federal Reserve.
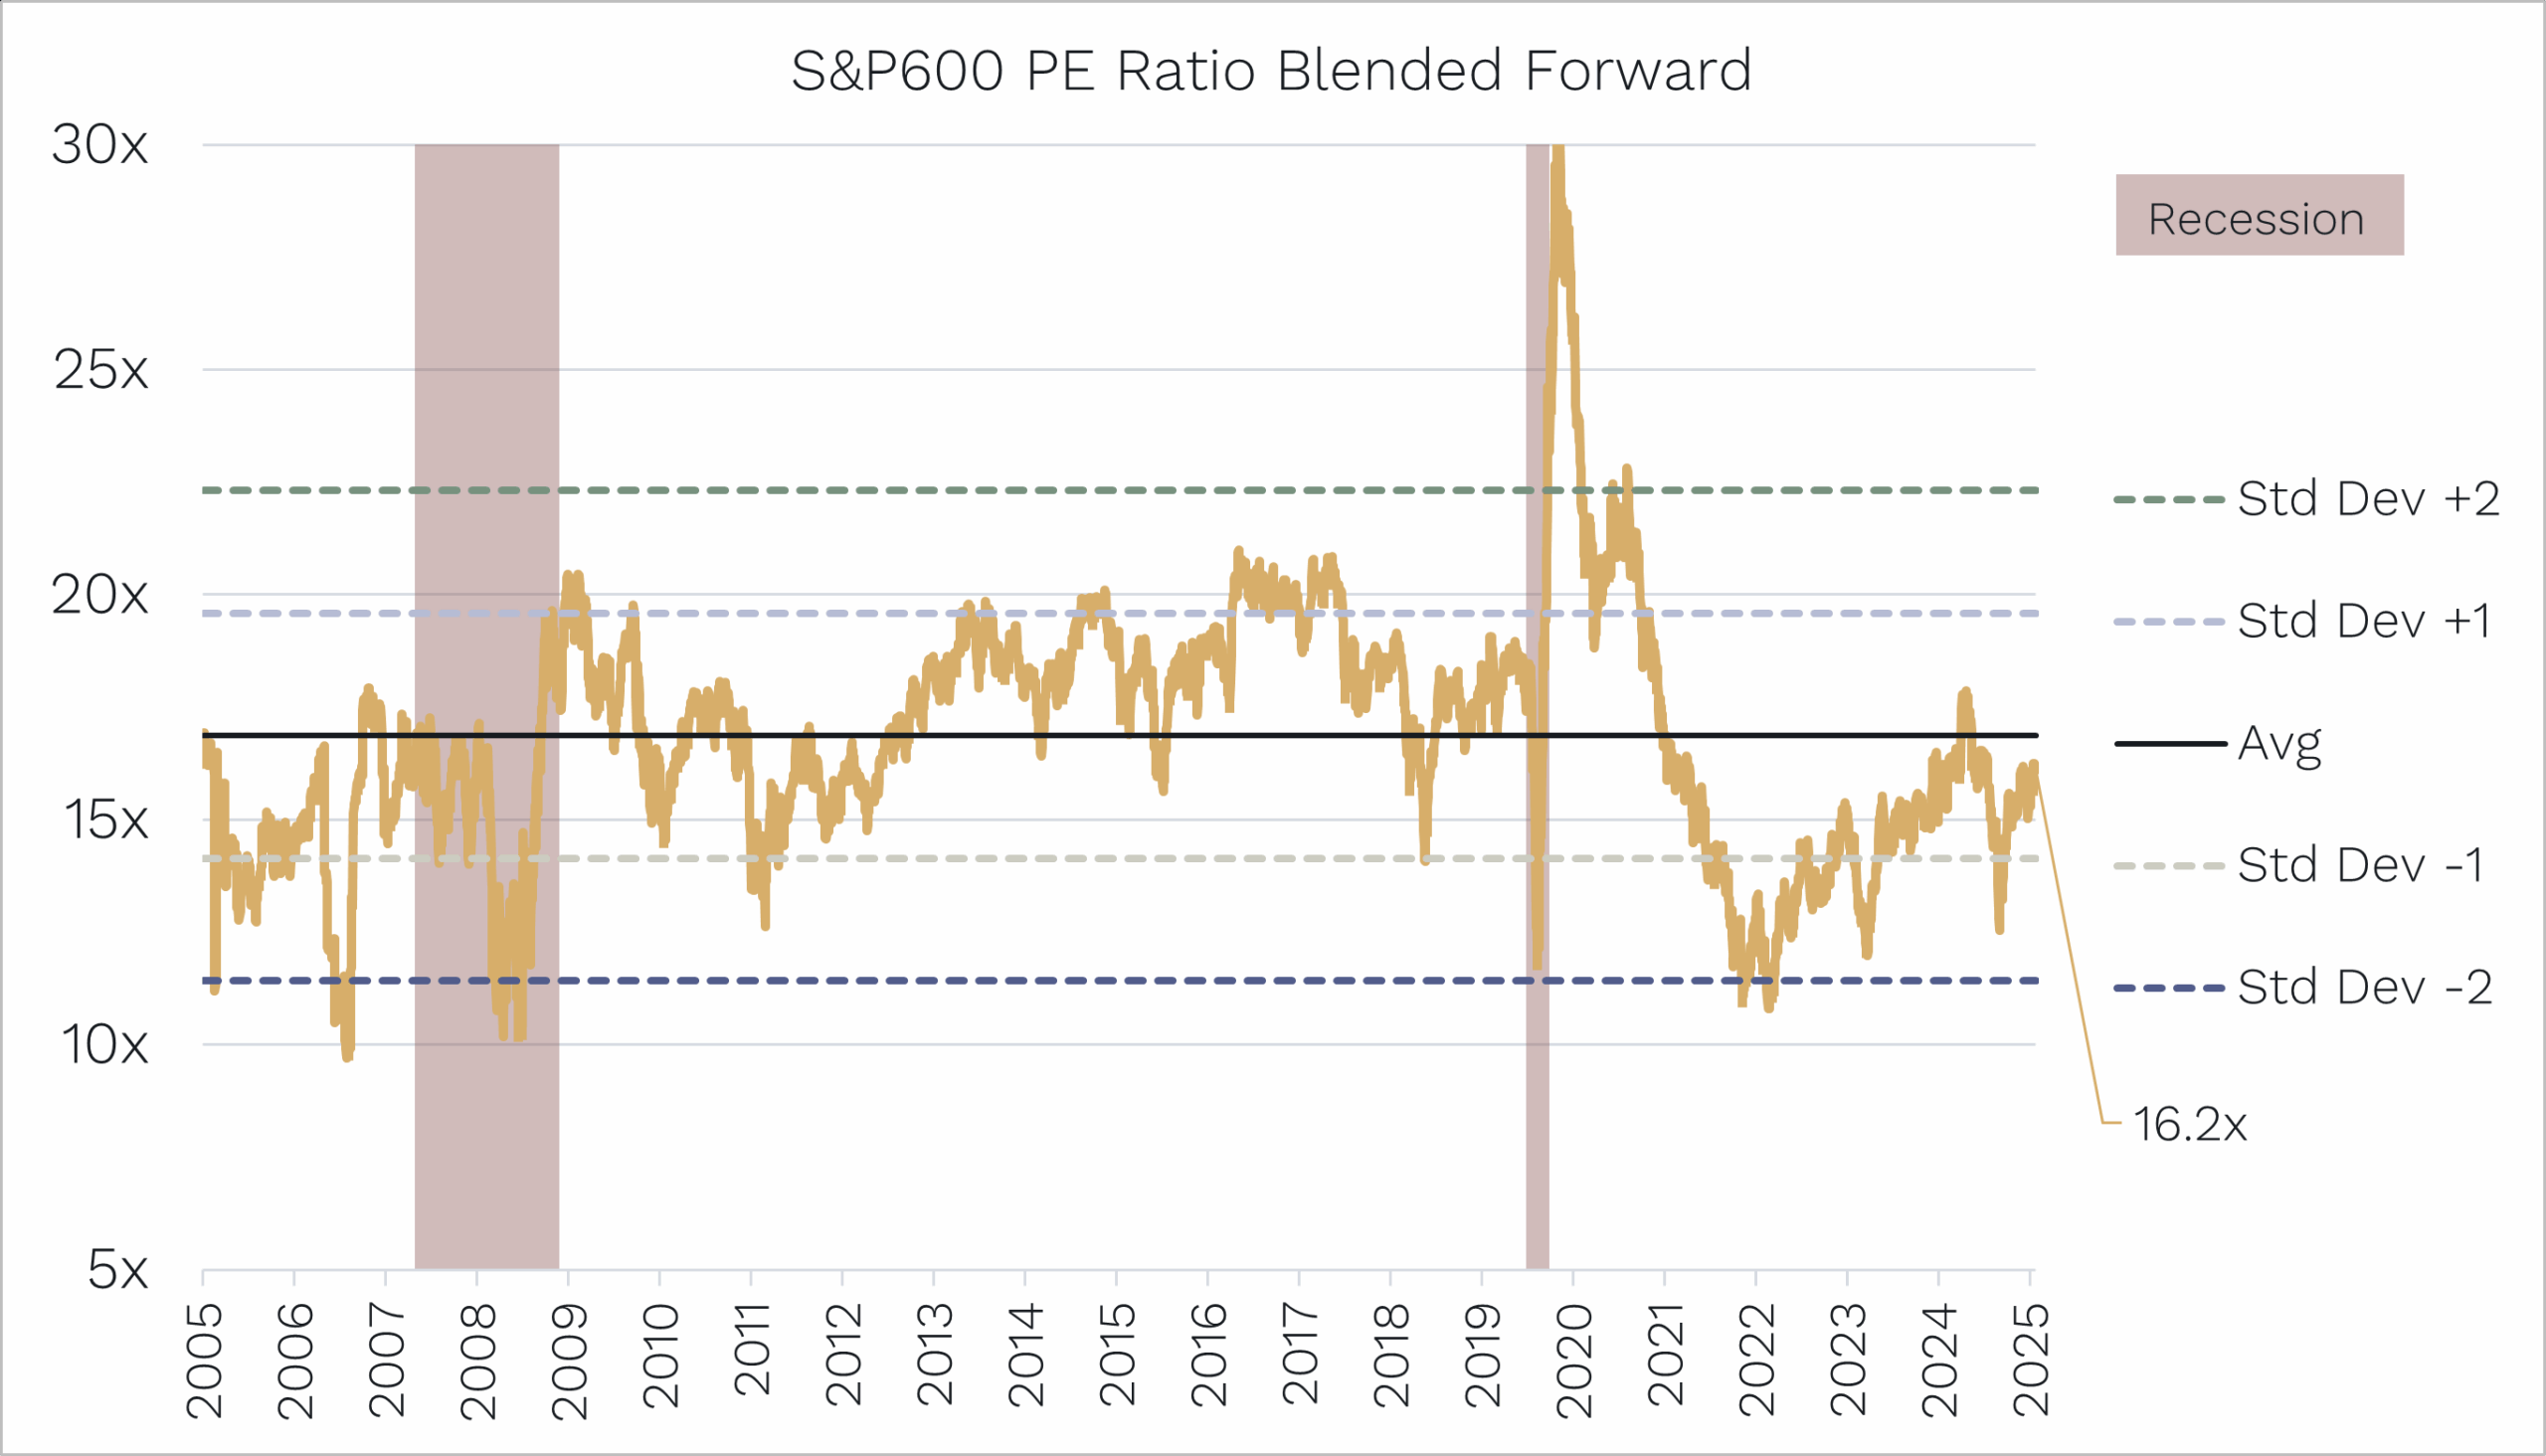
Moreover, with a P/E of around 15x, US small-cap valuations are relatively cheap and well below the more expensive 22-23x before the sell-off in 2021.
Given that the lowest small caps have reached in the last three bear markets are around 11-12x, small caps today have a lot more downside protection and margin of safety.
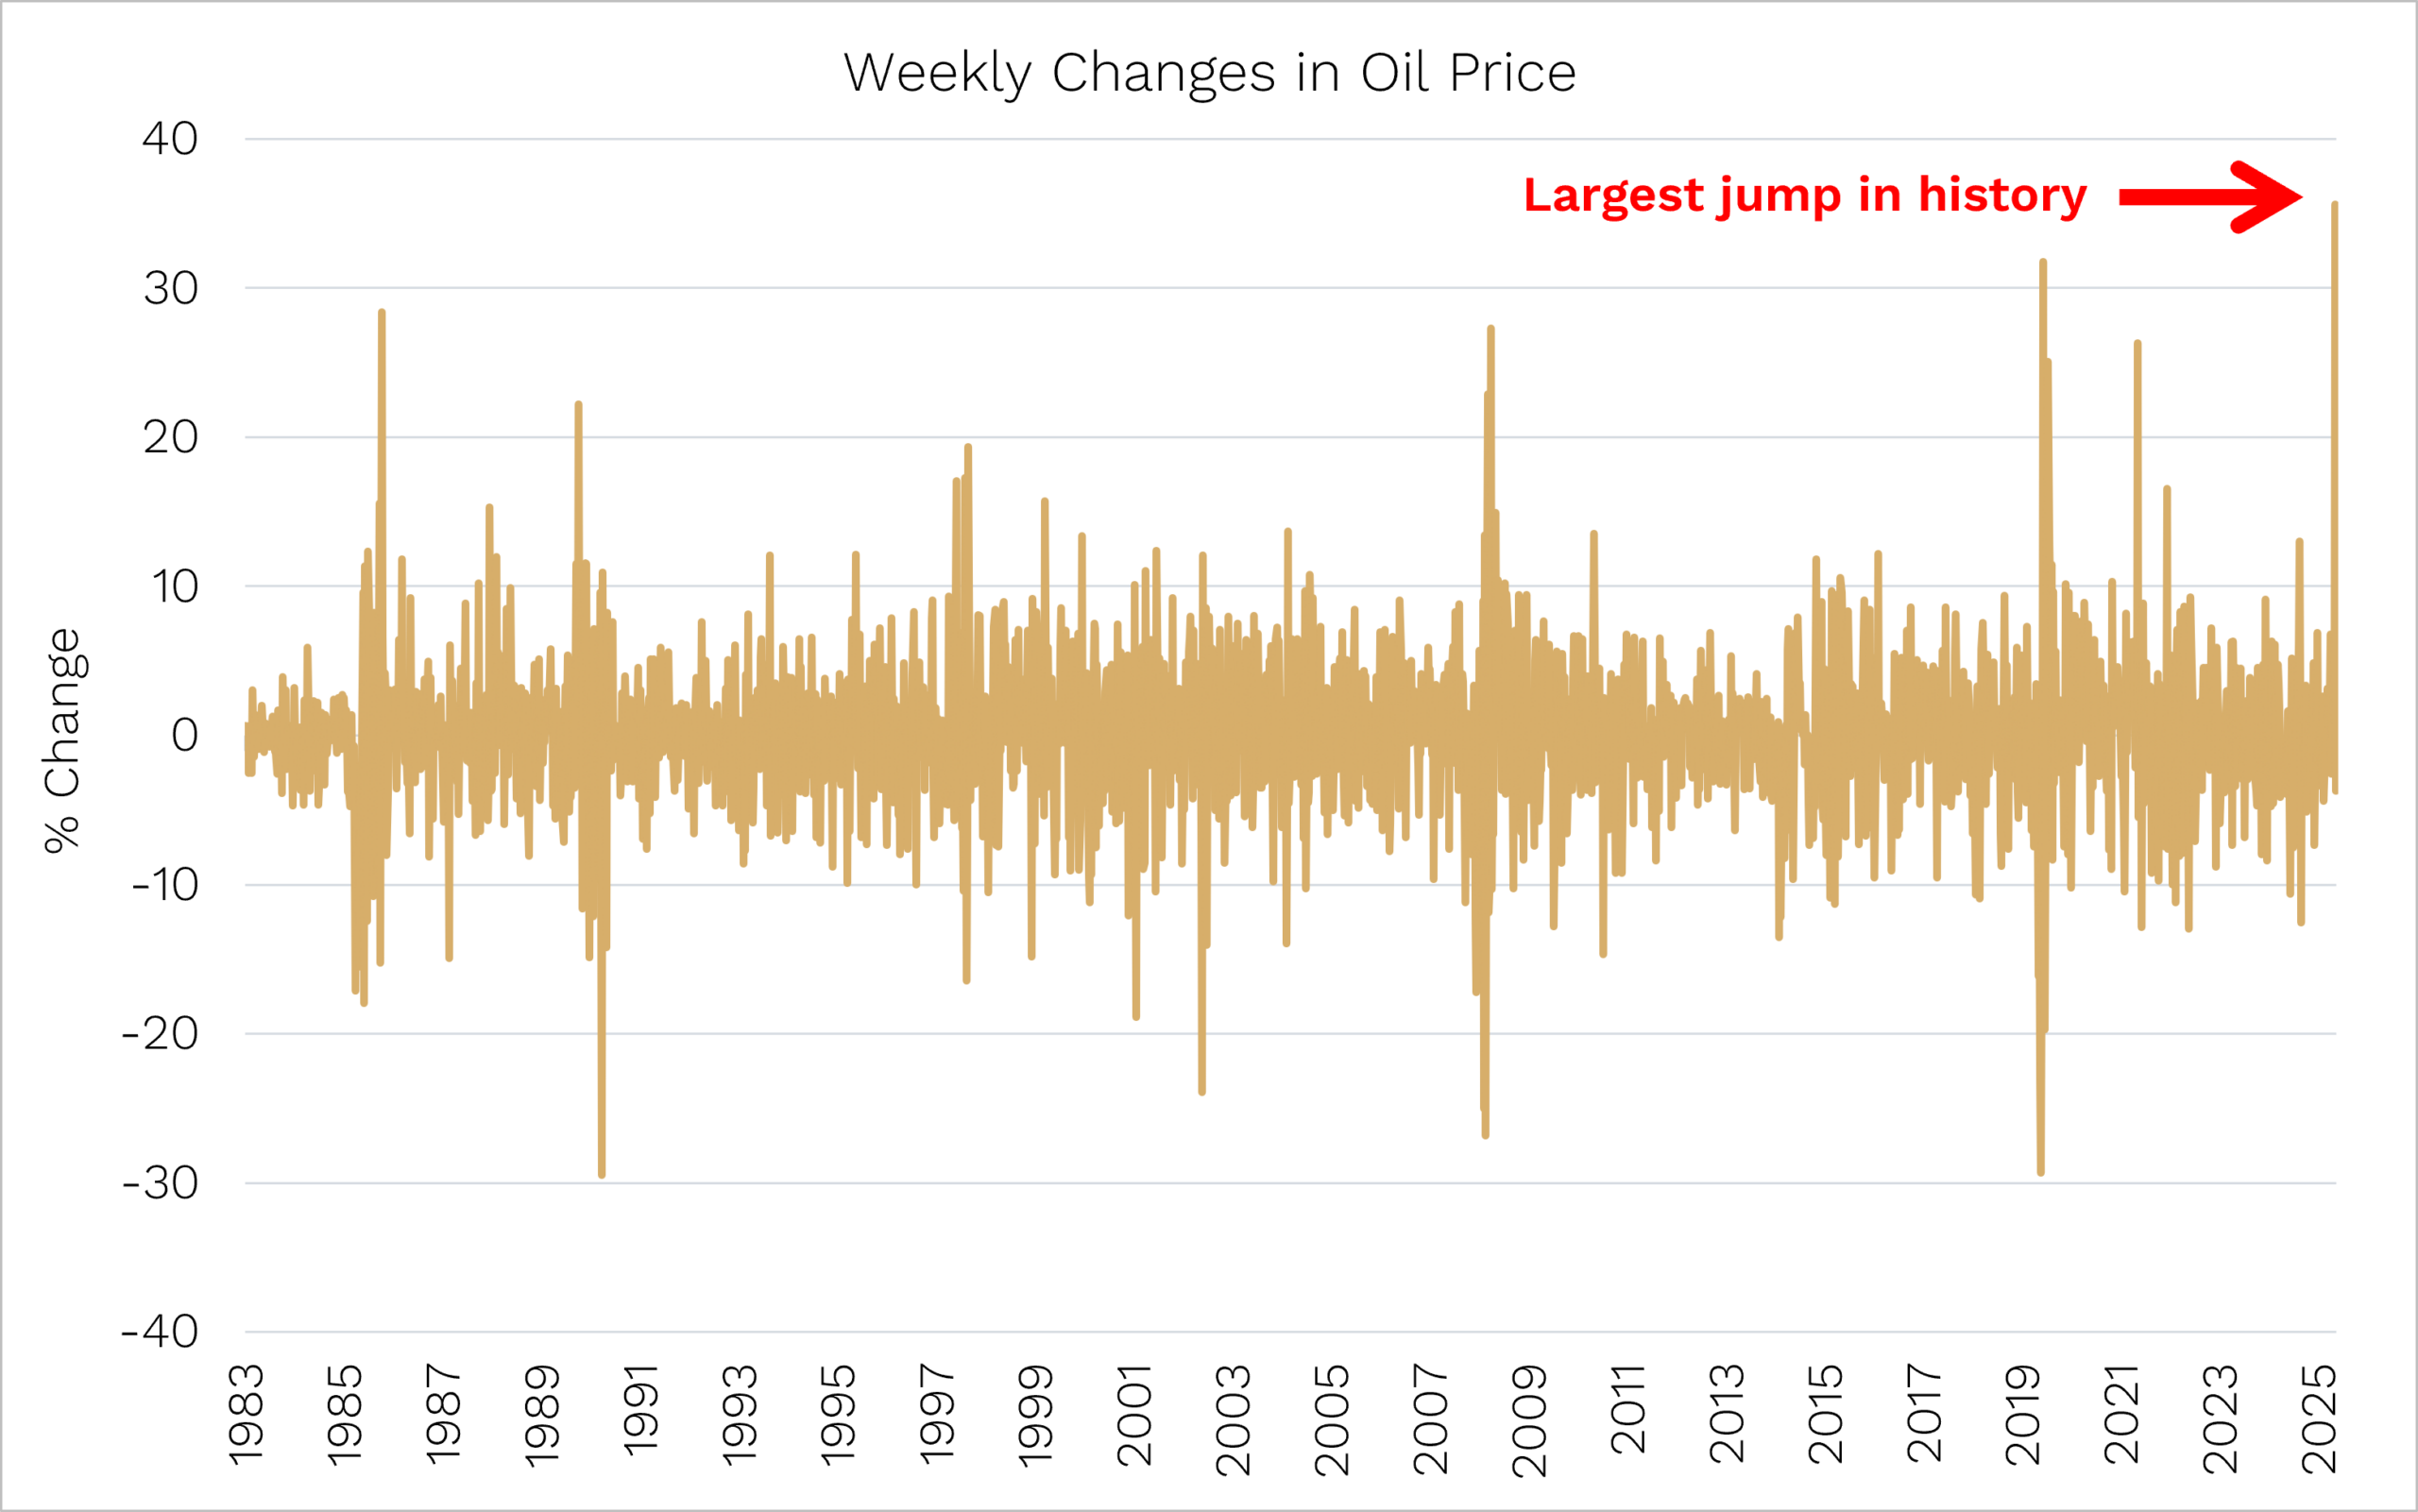
Chart 4. Nvidia’s Crude Awakening
This next chart shows one of the craziest stats we came across in the last month.
Nvidia’s one-year forward PE: 18.7x.
ExxonMobil: 20.2x.
That’s right, Nvidia stock is now cheaper than ExxonMobil.
Let that sink in.
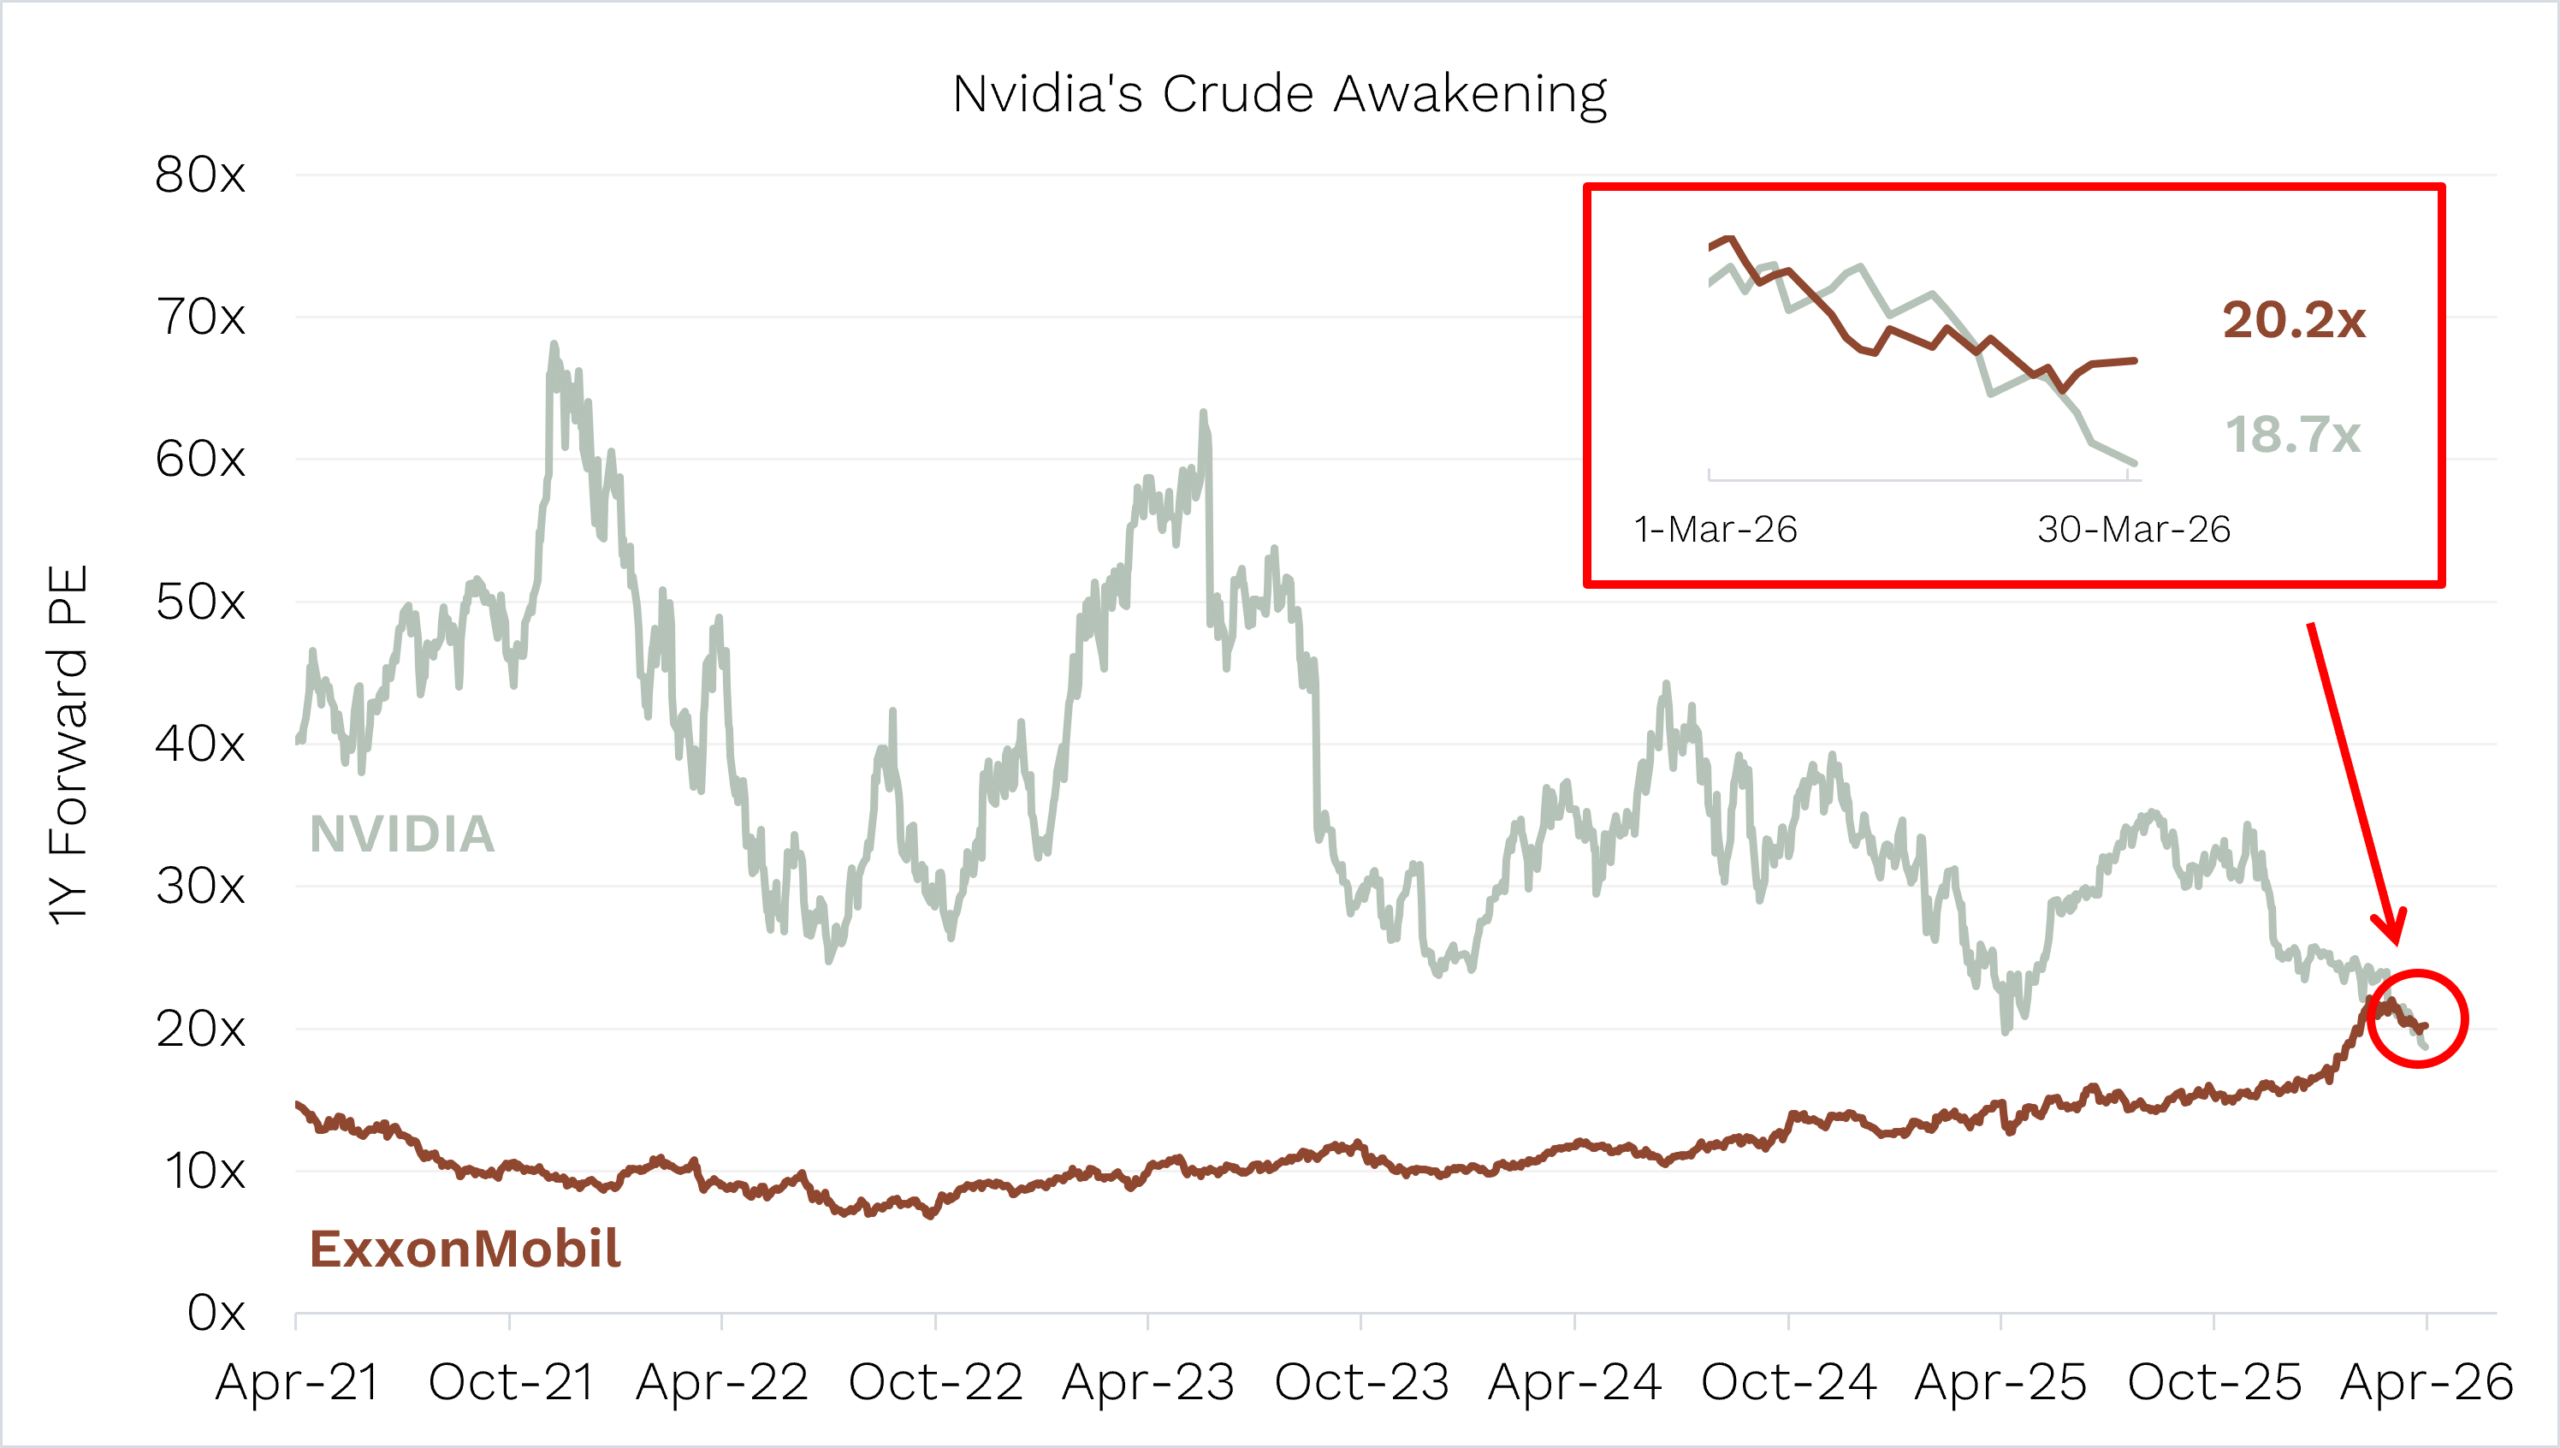
Source: Bloomberg. Data at 27 March 2026.
The company supplying the picks and shovels for the AI gold rush – the most important technology buildout of our lifetime – trades at a lower one-year forward P/E (price-to-earnings ratio) than an oil major that has roots back to the 1870s!
At Ophir, we watched Nvidia’s meteoric rise and kept asking ourselves: when does the valuation gravity eventually kick in?
Well, here we are.
Three years ago, the market was willing to pay almost anything for AI, and at a P/E of 60x had priced Nvidia to perfection and then some.
Today, despite expecting Nvidia’s earnings to almost double this financial year from US$113 billion to US$203 billion, the market is now pricing Nvidia more like a utility.
It’s not that Nvidia’s share price is down a lot that’s causing its valuation to fall – it’s only about 12% off its all-time highs. The market is just having a hard time maintaining Nvidia’s P/E. If the market did maintain the P/E, Nvidia’s market cap would double to over USD$8 trillion!
Investors are clearly questioning the durability of the AI capex cycle and whether it has gotten ahead of itself.
On the flip side, ExxonMobil’s P/E averaged 11x over the last 5 years. Then oil shot up on the back of the Iran war, and Exxon is now trading at almost twice that P/E.
We’re not saying Exxon is overvalued. Oil is a critical business and Exxon is no doubt exceptionally well run. But the optics of this comparison say something important about how dramatically sentiment can swing.
Have these two companies’ fortunes really changed that much over the last six months – when Nvidia’s P/E was twice that of Exxon – or is this one of the great mispricings of the decade?
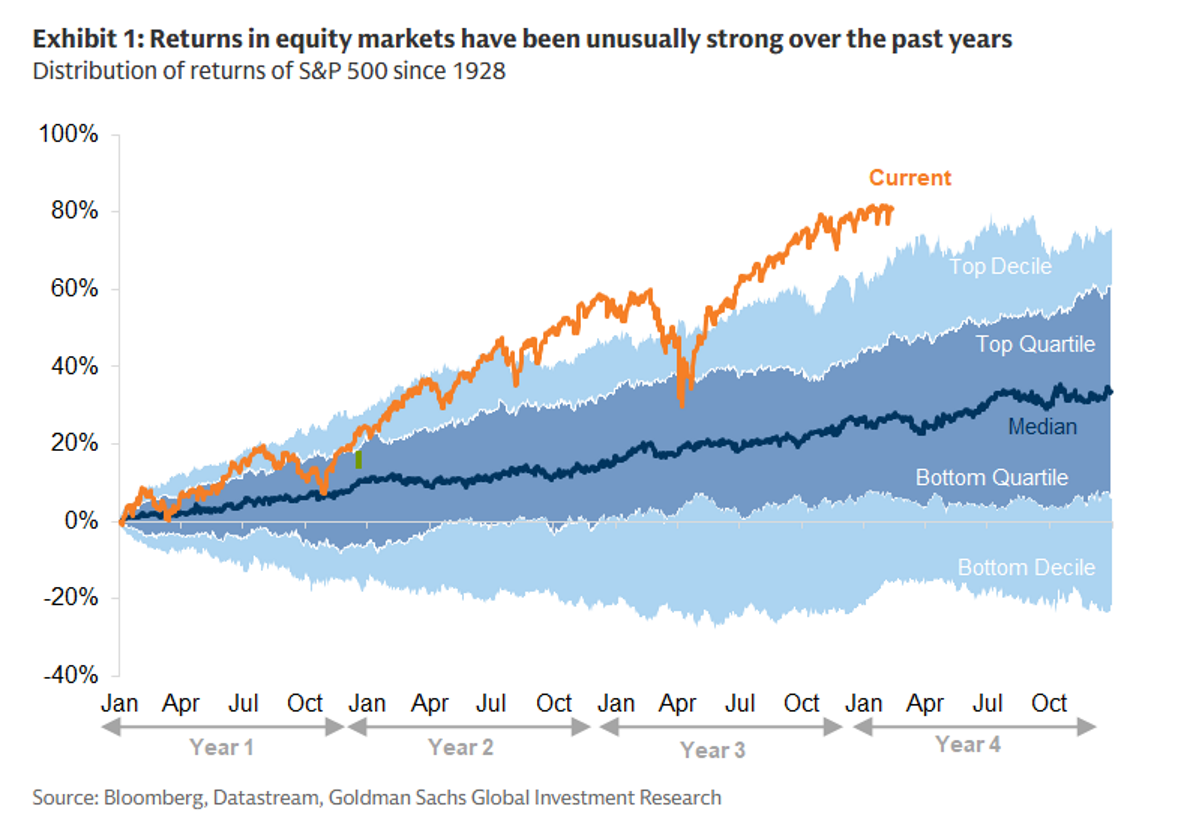
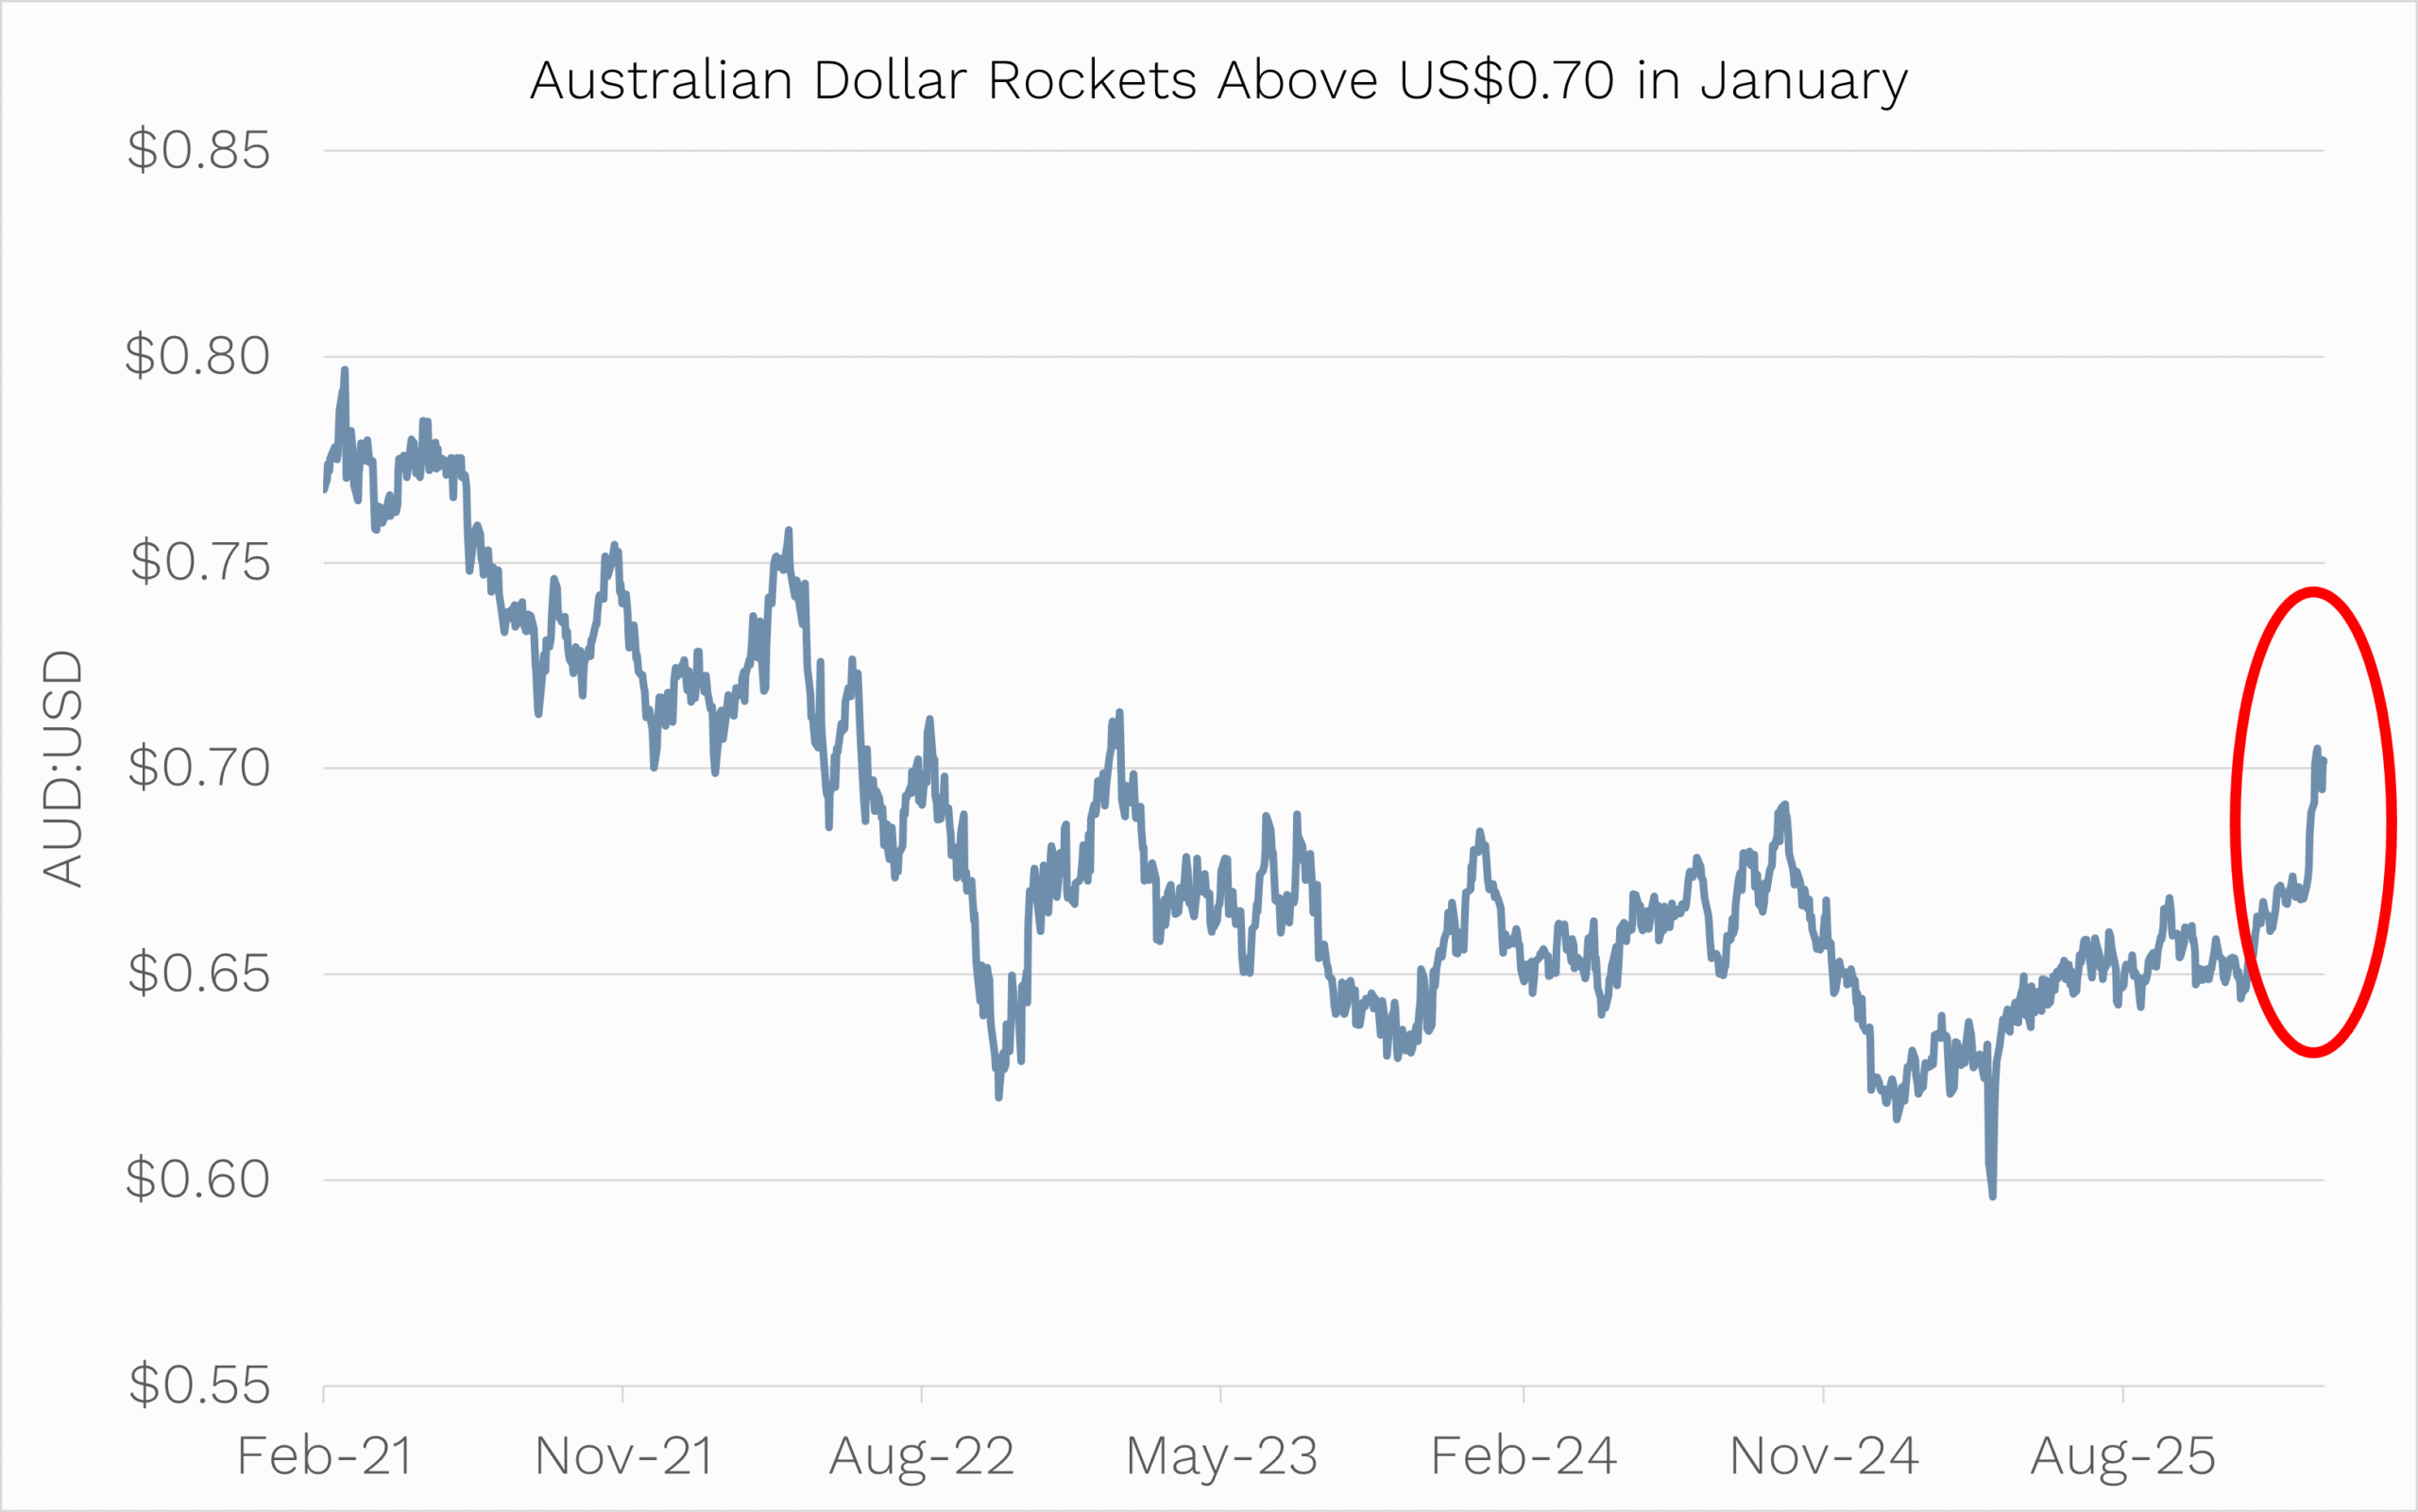
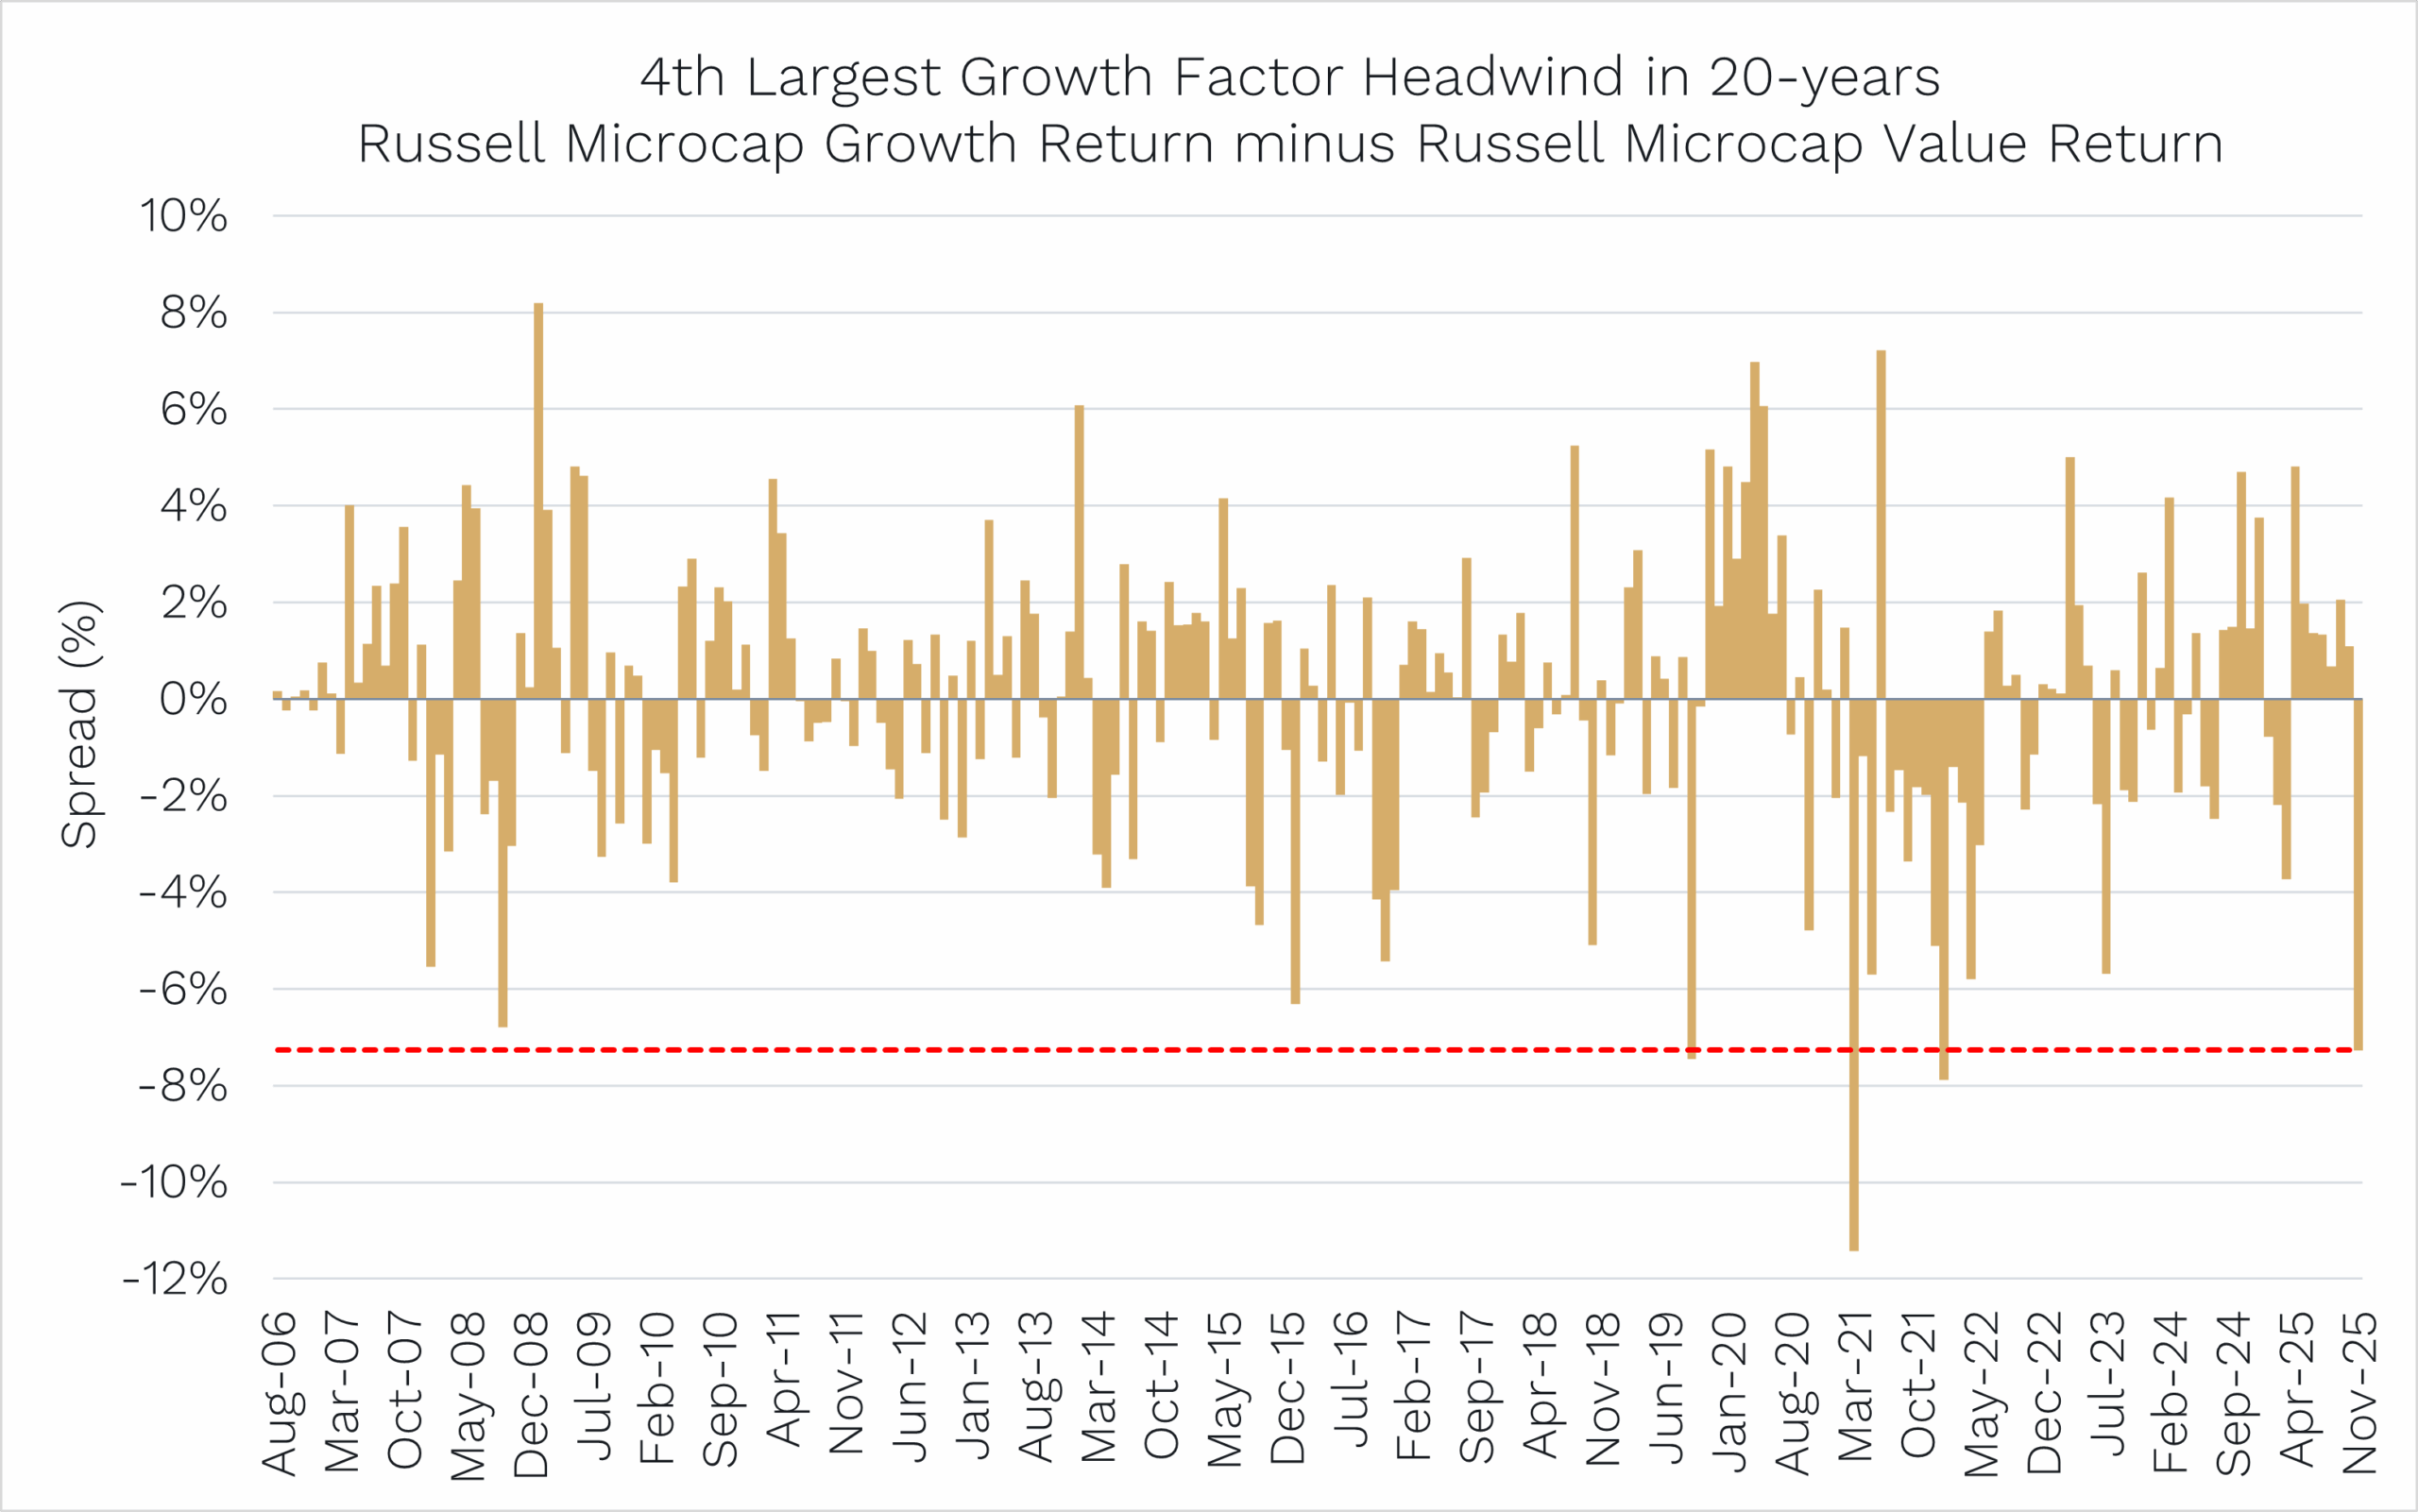
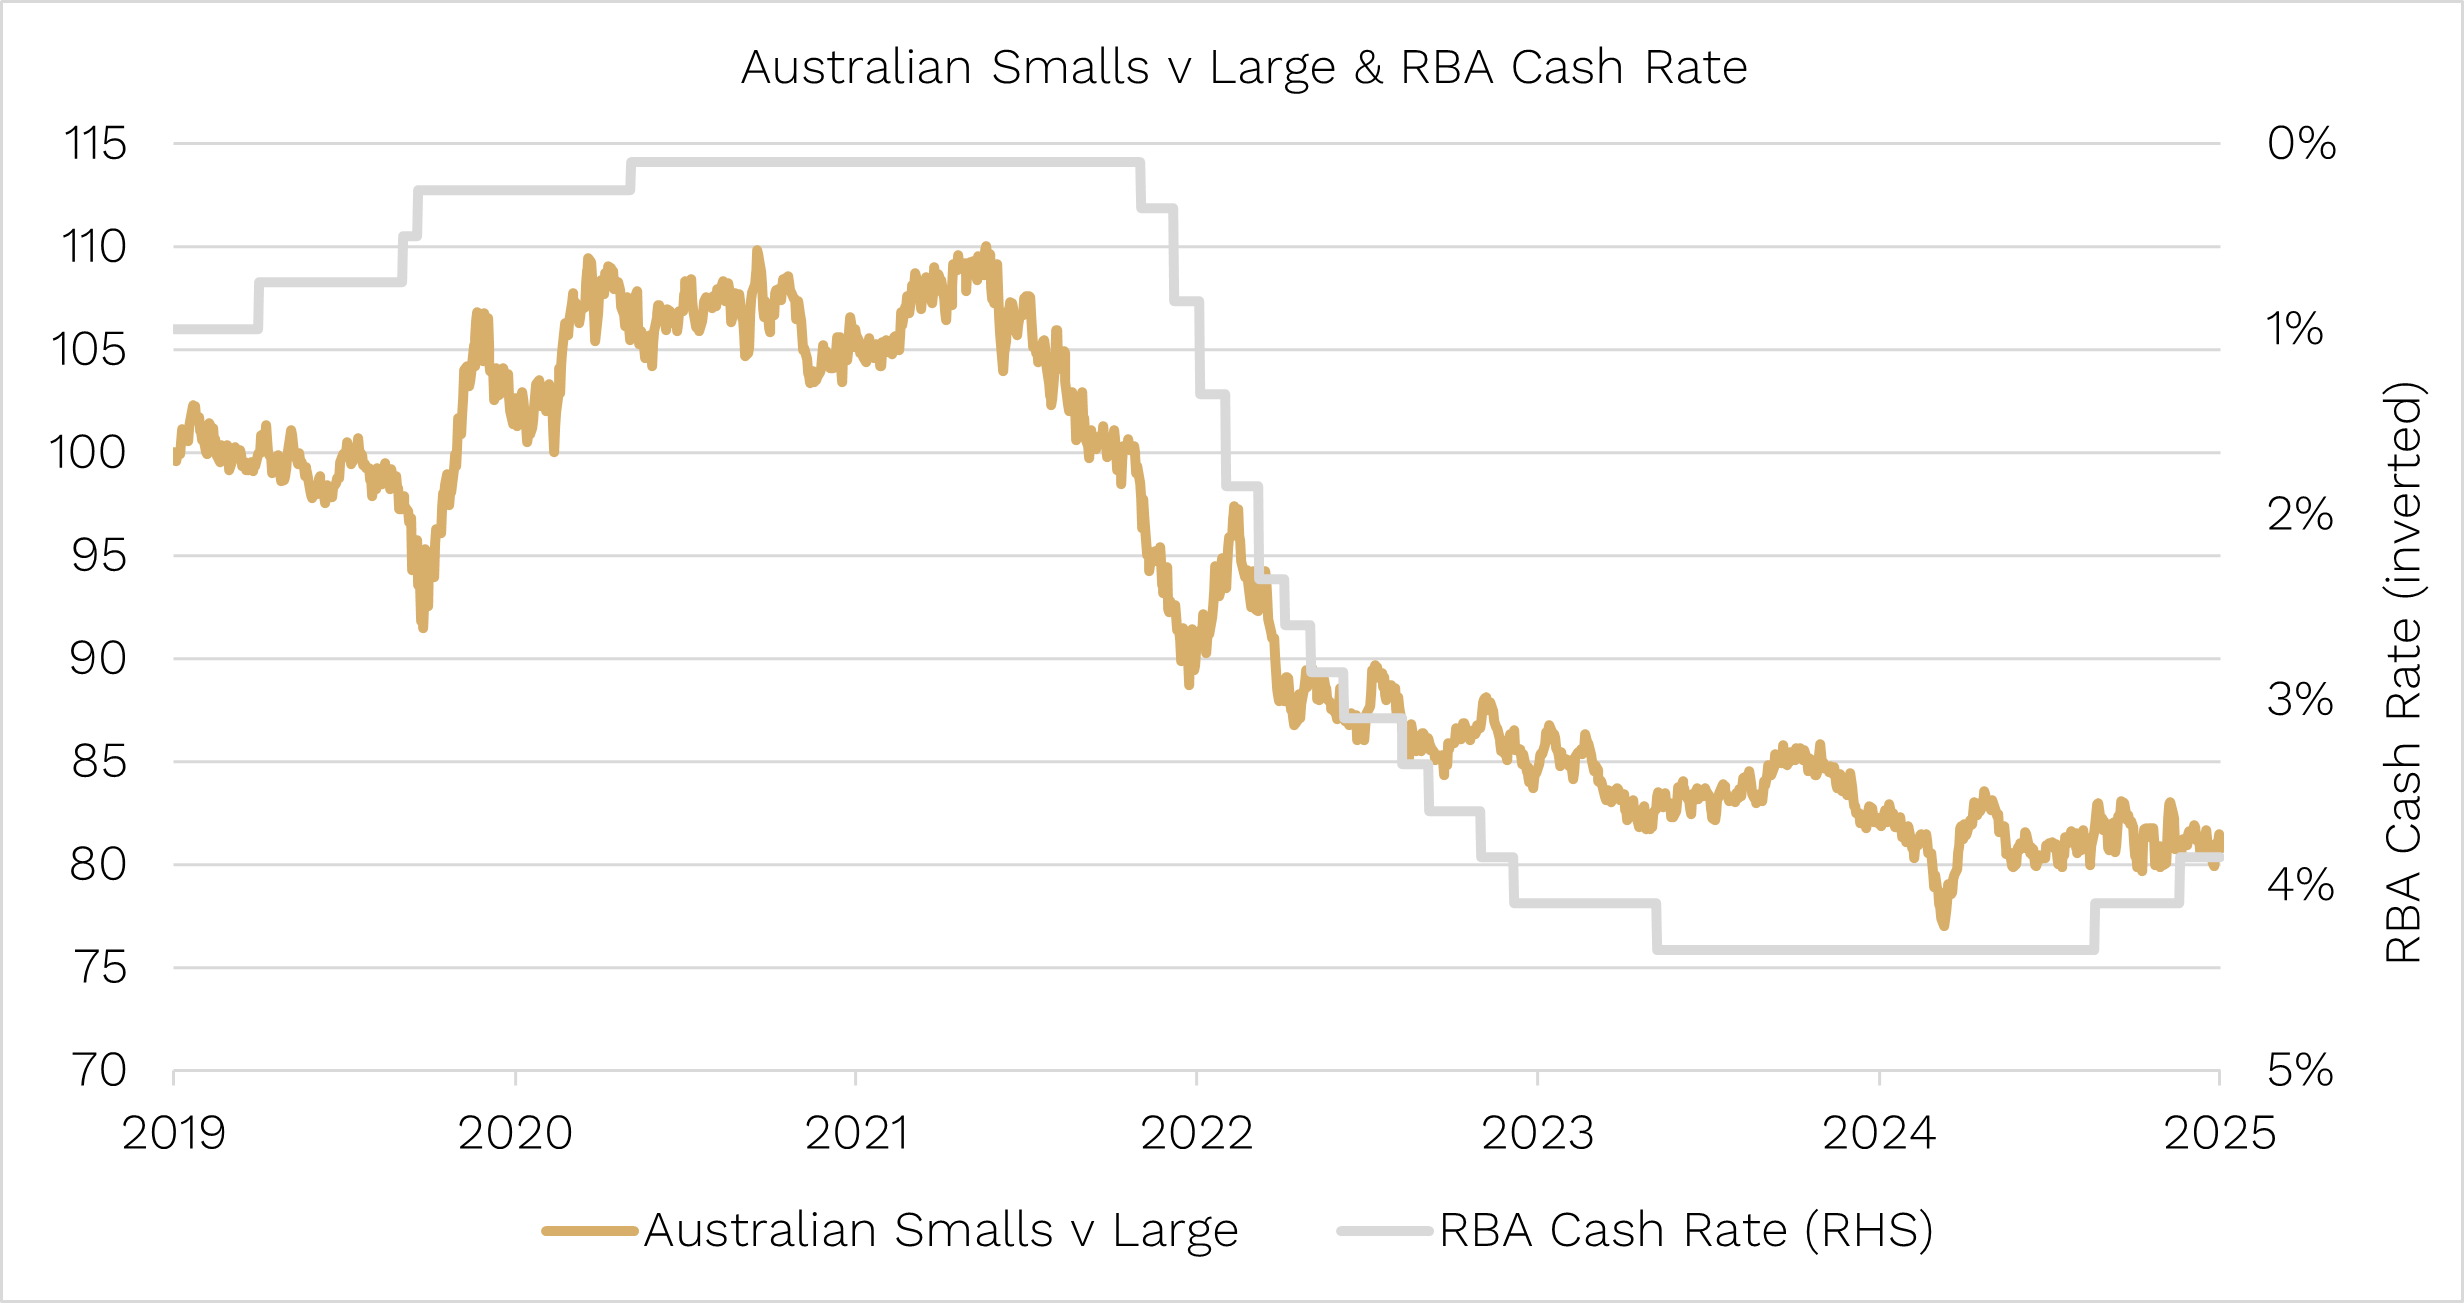
Chart 5. Aussie Small Caps Marked Down
For over a year now, we have been beating the drum about how cheap US and global small caps have been versus large caps.
But one of the great untold stories of the last couple of months is just how cheap Aussie small caps have become.
At a 13.9x price-to-earnings ratio (one-year forward earnings), the only two other times they have been this cheap in the last decade are:
- March 2020, when the COVID sell-off hit.
- Very briefly in June 2022, during the fastest global rate-hiking cycle in 40 years, when the consensus call from economists was recession.
Perhaps even more stark is Australian small caps’ valuation relative to Australian large caps.
Over the last 20 years, Aussie small caps have traded at an average P/E premium to large caps of +0.7x.
Today they are trading almost 4 P/E points lower – the LOWEST in the 20 years of data available.
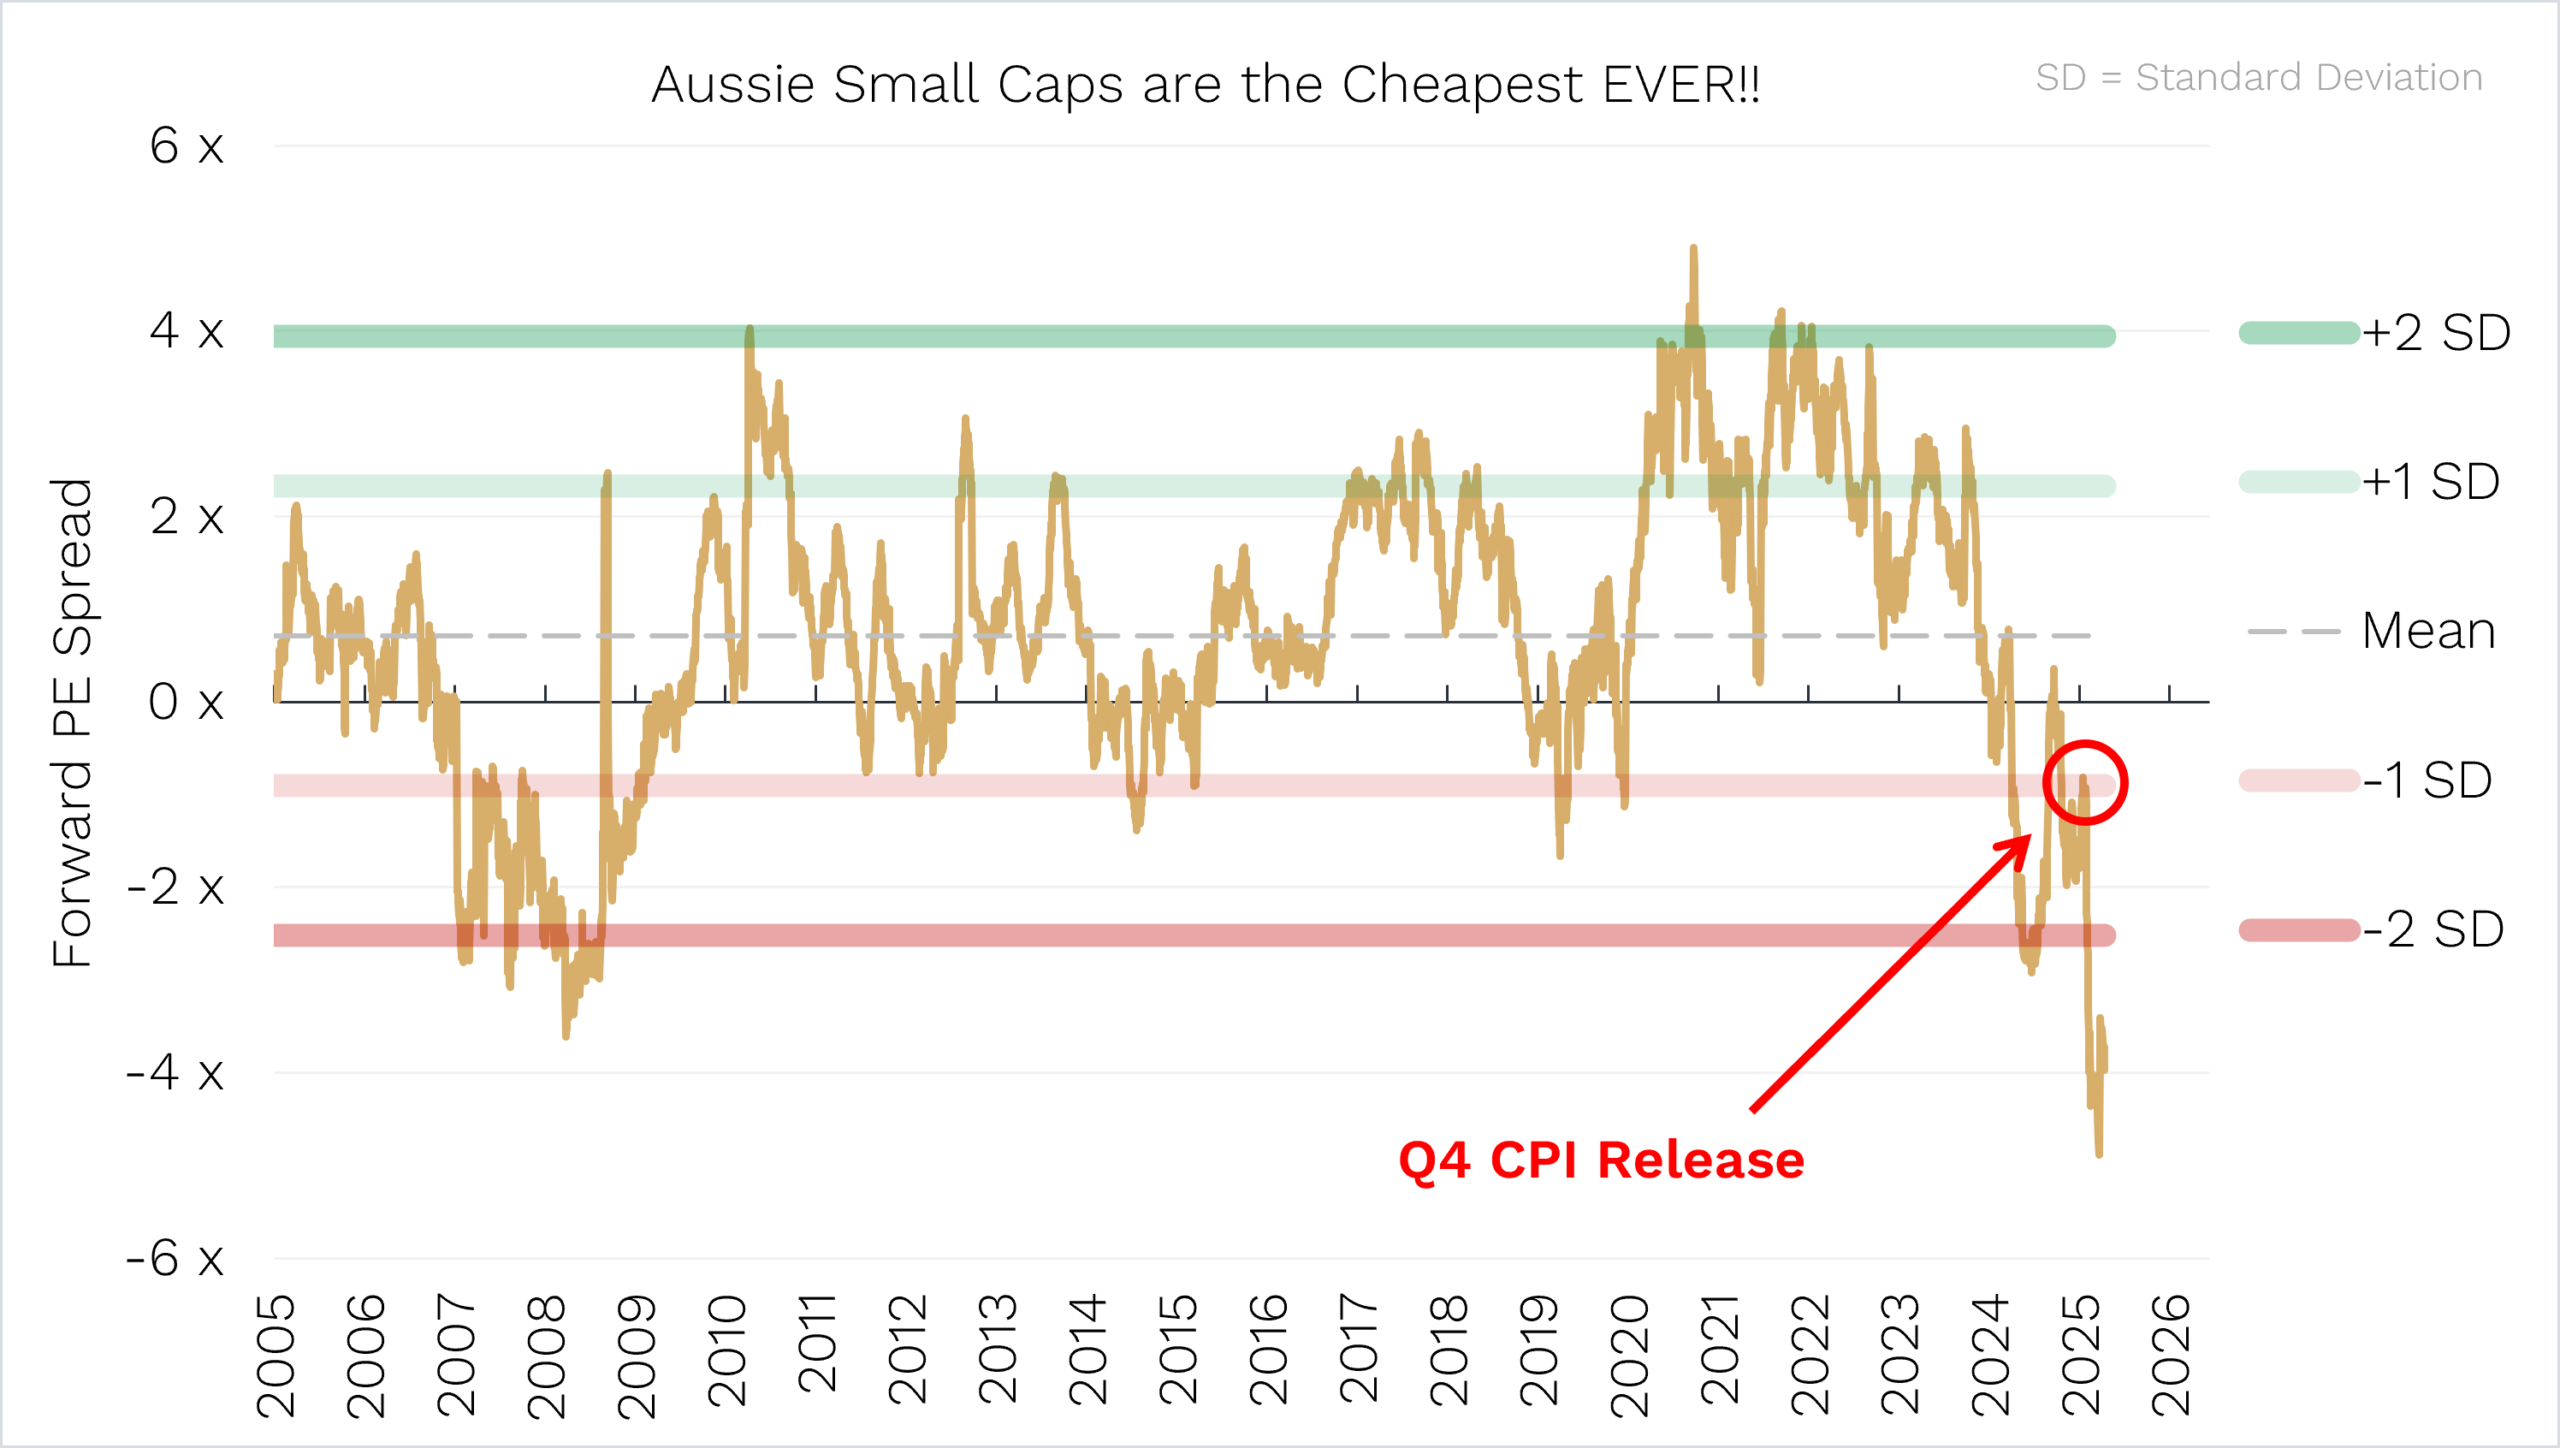
Source: Ophir. Bloomberg. ASX Small Ordinaries vs ASX 50.
A big cause has been the RBA rate-hike cycle. It started in early February after a sticky inflation reading for the December 2025 quarter (released 28th January 2026).
Since that late-January CPI report, the ASX Small Ordinaries index fell -16.6% to the end of March, while the ASX 50 index has fallen just -2.4%.
With Aussie small-cap valuations at 13.9x, they are now only marginally above the 13x they bottomed at after the 2022 sell-off, and the 12x they bottomed at in COVID.
So it appears much of the RBA hiking cycle and Iran war fears are priced in.
Are they at their lows?
Who knows.
But, absent any unforeseen events, they historically haven’t been much lower.
And as the research tells us: the single best predictor of an asset class’s return over the long term is its starting valuation.
And on that score, Aussie small caps have now started to look cheap, especially compared to Aussie large caps.
As Buffett said: “Whether we’re talking about socks or stocks, I like buying quality merchandise when it is marked down”.
We think that applies well to Aussie small caps today. It’s our job here at Ophir to find the quality merchandise within small caps.
As always, if you’d like to chat to us about any of the Funds, please feel free to call us on (02) 8188 0397 or email us at ophir@ophiram.com.
Thank you for entrusting your capital with us.
Kindest regards,
Andrew Mitchell & Steven Ng
Co-Founders & Senior Portfolio Managers
Ophir Asset Management
This document has been prepared by Ophir Asset Management Pty Ltd (ABN 88 156 146 717, AFSL 420082) (“Ophir”) and contains information about one or more managed investment schemes managed by Ophir (the “Funds”) as at the date of this document. The Trust Company (RE Services) Limited ABN 45 003 278 831, the responsible entity of, and issuer of units in, the Ophir High Conviction Fund (ASX: OPH), the Ophir Global Opportunities Fund and the Ophir Global High Conviction Fund. Ophir is the trustee and issuer of the Ophir Opportunities Fund.
This is general information only and is not intended to provide you with financial advice and does not consider your investment objectives, financial situation or particular needs. You should consider your own investment objectives, financial situation and particular needs before acting upon any information provided and consider seeking advice from a financial advisor if necessary. Before making an investment decision, you should read the relevant Product Disclosure Statement (“PDS”) and Target Market Determination (“TMD”) available at www.ophiram.com or by emailing Ophir at ophir@ophiram.com. The PDS does not constitute a direct or indirect offer of securities in the US to any US person as defined in Regulation S under the Securities Act of 1993 as amended (US Securities Act).
All Ophir Funds are deemed high risk within their respective Target Market Determination documentation. Ophir does not guarantee the performance of the Funds or return of capital. An investment may achieve a lower than expected return and investors risk losing some or all of their principal investment. Past performance is not a reliable indicator of future performance. Any opinions, forecasts, estimates or projections reflect our judgment at the date of this was prepared, and are subject to change without notice. Rates of return cannot be guaranteed and any forecasts, estimates or projections as to future returns should not be relied on, as they are based on assumptions which may or may not ultimately be correct.
Actual returns could differ significantly from any forecasts, estimates or projections provided.
The Trust Company (RE Services) Limited is a part of the Perpetual group of companies. No company in the Perpetual Group (Perpetual Limited ABN 86 000 431 827 and its subsidiaries) guarantees the performance of any fund or the return of an investor’s capital.