9 Jul, 2025

Stock in Focus - Vusion Group (VU: FP)

Stock in Focus • 5 mins read

Back to Insights Back to Insights

Read the PDF


20/20 Vusion

When you’re at the supermarket and you see all those price tags that change every other day with deals, specials, or to reflect higher prices have you ever thought to yourself, ‘I’m glad I don’t have to change them.’ Well what if they changed themselves… This transformation is underway for global retail and behind those familiar pricing labels on store shelves there is a multi-billion-dollar company you’ve probably never heard of that is leading the charge.

VusionGroup, (VU-FP), is a French technology company specializing in Internet of Things (IoT) and data solutions for physical commerce. The company has established itself as a global market leader for electronic shelf labels (ESL) and cloud-based software solutions (VAS), supplying retailers with its innovative solutions to enhance store digitalisation.

VusionGroup Product Features

Source: VusionGroup.

We first came across Vusion when spending a week on the ground in Paris to visit a long list of SMID-cap French companies around three years ago. What we discovered was one of the most compelling secular growth stories in global retail technology.

Shelf Control

After closely following the company for nearly a year, we took our position in June 2023. The catalyst? A short report that halved the stock price. At the heart of the bear case was the validity of its contract with Walmart – a major source of growth for Vusion in the U.S – and a large Chinese shareholder potentially selling down.

While definitely not our typical entry catalyst we were fortunately prepared and had done the following…

  1. Spent over a year engaging with the company and built trust in management’s delivery during that time.
  2. Spoke to multiple large U.S. and EU grocery chains about ESL and were already comfortable with the unit-level economics being generated.
  3. Ran channel checks on the company’s Chinese shareholder
  4. Conducted detailed discussions with management to address the other accounting concerns in the report

This allowed us to quickly conclude the short report was weak and the market had overreacted. We bought in on day two, once the dust had settled, at a time when the stock was trading at around €80.

A clear front-runner

Globally, there are four major providers of ESL’s: Vusion and Pricer in Europe, and Hanshow and Solum in Asia. We’ve conducted translated investor calls with Solum, met with Pricer management on multiple occasions, and held industry expert calls on Hanshow.

Through this work, one thing has become clear: Vusion has a material lead in the U.S. market.

The U.S. currently represents only ~5% of the global ESL market compared to ~40–50% for Europe. But with Walmart as a marquee customer and ESL adoption still in its infancy stateside, the U.S. is on track to overtake Europe by 2029 as the largest market globally.

Source: VusionGroup, Ophir.

This market share head start, combined with Vusion’s differentiated software offering, gives the company a substantial runway for growth.

Growth remains in its infancy

Adoption of ESLs in the U.S. remains in the low single digits, with Walmart acting as a first-mover. But the macro backdrop is increasingly favourable: rising labour costs, supply chain volatility, and stockkeeping unit (SKU) proliferation are all improving the payback profile for ESL rollouts.

Importantly, the use case is expanding. ESLs are moving beyond grocery into pharmacy, hardware and other specialty retail, effectively doubling Vusion’s total addressable market.

Source: VusionGroup, Ophir.

We model 25%+ revenue CAGR through 2027, supplemented by high-margin value-added services (VAS) products that Vusion bundles with its hardware. These software solutions, which include dynamic pricing, inventory automation, and theft prevention, are creating recurring revenue streams and best-in-class EBITDA margins that we believe increase Vusion’s competitive moat and customer stickiness.

Source: VusionGroup, Ophir.

Beyond the fundamentals, the technology itself is genuinely exciting. VAS features now enable:

  • Optimised picking for online orders
  • Time-of-day dynamic pricing
  • Real-time inventory auto-replenishment
  • Theft detection and loss prevention

These aren’t just bells and whistles, they’re solutions to real pain points for retailers, helping drive adoption and pricing power. And importantly, they deliver software-like margins on top of hardware deployments.

ESL penetration in the U.S. remains well below Europe despite a significantly larger store and SKU base, a recipe for catch-up growth.

  • U.S. stores: Significantly more locations per chain; often with broader inventory complexity.
  • Pharmacy and hardware: These verticals are still largely untouched and represent major future growth. Just picture an ESL replacement program on your next trip to Chemist Warehouse…

With ESLs moving from “nice to have” to operational necessity, we see a multi-year adoption curve ahead.

Why We Still Hold – The Price is Right!

Despite recent strength in the share price, valuation remains attractive. Vusion trades on ~12x forward EBITDA with 35%+ EBITDA CAGR expected over the next few years. With increasing operating leverage from software and international expansion, we believe this multiple does not reflect the quality or visibility of future earnings.

Source: Bloomberg, Ophir.

We feel like we’ve been told to “Come on Down” and we’re on to a winner with structural tailwinds, an expanding TAM, and operational leverage still ahead. You don’t need 20/20 vision to see further upside from here.

Previous

9 Jul, 2025 Letter to Investors - June 2025
9 Jul, 2025

Letter to Investors - June 2025

Letter to Investors • 12 mins read

Back to Insights Back to Insights

Read the PDF


A big FY25 but small cap rate cut benefit still ahead

Financial Year 2025 generated some great returns in the Ophir Funds and in this Letter to Investors we:

  • Reveal what drove our Funds to achieve 20-40% returns – the punchline….it was stock picking!
  • Cover what our returns look like in up and down markets
  • Show how breadth of contributors is a good sign of performance repeatability
  • Highlight how rate cuts ahead might help small caps outperform


June 2025 Ophir Fund Performance

Before we jump into the Letter, we’ve provided a detailed monthly update for each of the Ophir Funds below.

The Ophir Opportunities Fund returned +0.3% net of fees in June, underperforming its benchmark which returned +0.8%, and has delivered investors +23.2% p.a. post fees since inception (August 2012).

Download Factsheet

The Ophir High Conviction Fund (ASX:OPH) investment portfolio returned -0.3% net of fees in June, underperforming its benchmark which returned +0.8%, and has delivered investors +13.9% p.a. post fees since inception (August 2015). ASX:OPH returned -0.9% for the month.

Download Factsheet

The Ophir Global Opportunities Fund (Class A) returned +6.0% net of fees in June, outperforming its benchmark which returned +2.3%, and has delivered investors +18.1% p.a. post fees since inception (October 2018).

Download Factsheet

The Ophir Global High Conviction Fund (Class A) returned +5.0% net of fees in June, outperforming its benchmark which returned +2.3%, and has delivered investors +13.9% p.a. post fees since inception (September 2020).

Download Factsheet


A Good Year

Despite four years on the trot now of global small cap underperformance versus large caps, it was a good FY25 (12 months to June 2025) for global and Australian small cap markets, producing total returns in the low to high teens.

But it was an even better year for the Ophir Funds, each of which was up between about 20-40% – see table below.

Longer term we assume the market, and our benchmarks, return about 10% per annum, which is what they have approximately done over the very long term. So, by this standard it was an above average 12 months for the small cap market.

We also target 5% outperformance, or 15% total returns, over the long term for all our funds. All four of our core funds below bested this mark in FY25, led by the Ophir Global Opportunities Fund up 41.8% after fees.

Of course, this is not a return investors should extrapolate out into the future as we are acutely aware virtually no one can achieve those types of returns on average over the long term, with the great Warren Buffett achieving more like 20% pa returns in the very long term.

We’d always caution investors that we seek to achieve 15% pa but that comes with risk. And the only thing we can guarantee is that the return in any one given year will not be exactly 15%!

Ophir Funds – Performance to 30 June 2025

While headline results of 1 year returns are great, its long-term returns that matter most for investors. Here our Australian and Global Opportunities Fund’s at 23.2% net p.a. and 18.1% net p.a. since their respective inceptions in 2012 and 2018 are the clear No.1 performers in their asset classes available in Australia (FE Fundinfo data).

The Ophir Opportunities Fund is hard closed, though the Global Opportunities Fund is still open (learn more here).

So if we can’t extrapolate 1 year returns, what can we learn from them? The answer is a lot!

Stock picking rules the day

Below we “pop the hood” on the Global Opportunities Fund’s 41.8% after fee return in FY25. The Global small and mid cap market, as shown by its benchmark, returned 18.7% over the same period so we outperformed by 23.1%. The below chart shows multi-factor performance attribution from Bloomberg which is really just a fancy way of saying, you outperformed the market by 23.1%, what factors caused it?

We haven’t shown the long list of 35 odd factors that Bloomberg tracks, that’d be a really ugly chart, so many of them are just clumped under “Other”. It’s clear the outperformance wasn’t due to the “Size” of companies we invested in as Mid Caps outperformed Small Caps but we are more invested in Small Caps. It wasn’t due to us allocating more to certain countries over others compared to the benchmark – we broadly mirrored the benchmarks/markets allocations to different countries based on their size, with the U.S. being about 60%.

Anyone who tells you they can pick which country is likely to have a better performing share market over the short term is in our view likely lying to themselves, or worse, to you. Good luck to them. And it wasn’t due to taking on more market risk as Beta only contributed 0.4%, or virtually nothing, to the 23.1% outperformance.

Source: Bloomberg. Data as of 30 June 2025. Benchmark MSCI World SMID Index.

In fact, more than 100% of the outperformance was due to Selection Effect which, like we’ve covered previously, means it can’t be explained by standard investment characteristics or styles, but rather from stock picking by the team. That’s good and important because outperformance from stock picking, if you have a genuine edge versus the market, is more likely to be sustainable than outperformance due to some specific factor or style of company like “Size”, or “Growth” or “Industry”.

Those factors and styles might work for a while, but often mean revert (subsequently underperform) and there is not a lot of great evidence that one of them always outperforms in all markets or over the short and long term.

Protecting the downside and outperforming in up markets

Another attribute that investors often crave is to not fall as much as the share market when it inevitably does. The share market is volatile enough, if you can protect during the dips then that’s a trait virtually all investors would put their hand up for.

After a tough 2022 for our style of investing when smaller faster growing businesses saw their valuations get hit when interest rates rose rapidly, we are pleased to show that we’ve fallen less than the global small and mid cap market when there has been pull backs. Over the last year when our benchmark has been down, we have only been down on average 76% of that amount, meaning we fell only about three quarters the amount of the market, protecting value for investors (green bar in chart below). For example, if the market fell -4% in a month we tended to only fall about -3%.

Source: Ophir. Bloomberg. Data as of 30 June 2025.

On the flip side when the market has been up, we have been up 183% of the market’s return. So here if the market was up +4% in a month, we were up 7.3% on average.

As the chart shows this is not just a trait of the last year, but the last three years. That is we’ve both fallen less in down markets and outperformed more in up markets, but the size of the outperformance is more when the market is up.

This outperformance in both up and down markets is something we also notice in our Australian small and mid cap funds that have been running for even longer.

What do we put it down to?

At the end of the day we are looking for companies that can structurally grow and beat the market’s expectations on both revenues and profits. Sure, there might be shorter term periods where other styles of investing might be more in vogue (think Dot.com bubble where nobody cared about fundamentals if you had “.com” in your name!) but if you’re growing cash flows for owners more than the market expects, that’s going to be pretty attractive no matter if the market is in the red or black.

You don’t want to be a one trick pony or a lucky duck

One of our favourite ways to tell if a fund manager is more likely to be skilful or just lucky is to ask them this “How many different (uncorrelated) bets led to your outperformance?” The more there are, the more likely there is to be a repeatable skill in their investment process.

Why?

It’s pretty simple. Even a novice can beat a World Series of Poker Champion on one hand. You can get lucky once. Play enough times though and the novice will lose all their dough.

If you have only one or two stocks doing all the heavy lifting contributing to your outperformance then, though its still not certain, but you’re more likely to have just gotten lucky.

Put another way, the greater the spread of stocks contributing to your outperformance, the more comfortable you should be that outperformance is likely to continue in the future. And before you ask, yes they still need to be uncorrelated. Owning 40 gold stocks out of a supposed diversified 50-stock portfolio when the gold price does well, doesn’t mean you got 40 separate calls right, you got one!

In FY25, we had 19 stocks give over 1% contribution to the 41.8% return of the Global Opportunities Fund, with the biggest 3 contributors providing less than 10% of the fund’s return.

Source: Ophir. Bloomberg. Data as of 30 June 2025.

9 of the 10 industry sectors we invested in provided a positive return in FY25, with our industry allocation compared to our benchmark contributing virtually nothing to our outperformance (no big gold bet here!).

The key point being there was a wide spread of contributors to the return of our Global Opportunities Fund in FY25. While that doesn’t guarantee results in the future, we think it makes it more likely our investment process can sustainably produce outperformance in the long term, as it has in the past.

Cuts remain key

To close we thought we’d leave you with a chart that caught our eye this month. We don’t think we necessarily need small caps to be outperforming large caps to generate attractive returns for investors, and ourselves. FY25 is an example of that. But it sure would be nice if they did after 4 years of small cap market underperformance.

As we have argued for a while now (like in our May Letter to Investors), lower interest rates should certainly help.

Why? For one it reduces interest costs on smaller companies more (as they have more floating rate debt on average than large caps) and secondly it also spurs more risk taking by investors to venture further down the market cap spectrum.

The below chart shows Small Cap versus Large Cap performance in Australia (indexed to 100) in orange since 2019. A falling line means Small Caps are underperforming Large as has happened since late 2021. That coincided with interest rates rising in Australia (RBA Cash Rate inverted in grey). But now Small Caps have just more recently stopped their obvious underperformance as the RBA has begun their rate cutting cycle. A further 0.75%-1% of RBA rate cuts is priced by the market to occur over the next year.

Sometimes the investment world can get too technical in its analysis. Maybe it is just as simple this, as higher rates have hurt Small Caps relative to Large over the last few years. Perhaps more rate cuts are the antidote?

(The chart below looks very similar for U.S. Small versus Large Caps).

Source: Ophir. Bloomberg. Data as at 30 June 2025.

After strong returns in FY25 investors might be asking “is there more juice left in the stocks you hold in the funds, or has it all been squeezed out?” It’s the right question to ask.

The reality is the funds, and more so the global funds, which have a truly enormous investment pond to fish from, are fresh with several high conviction new ideas with big upside, replacing companies that did well and we sold in FY25, after hitting our valuation targets. This keeps us very excited for what lies ahead in FY26.


As always, thank you for entrusting your capital with us.

Kindest regards,

Andrew Mitchell & Steven Ng

Co-Founders & Senior Portfolio Managers

Ophir Asset Management

This document has been prepared by Ophir Asset Management Pty Ltd (ABN 88 156 146 717, AFSL 420082) (“Ophir”) and contains information about one or more managed investment schemes managed by Ophir (the “Funds”) as at the date of this document. The Trust Company (RE Services) Limited ABN 45 003 278 831, the responsible entity of, and issuer of units in, the Ophir High Conviction Fund (ASX: OPH), the Ophir Global Opportunities Fund and the Ophir Global High Conviction Fund. Ophir is the trustee and issuer of the Ophir Opportunities Fund.

This is general information only and is not intended to provide you with financial advice and does not consider your investment objectives, financial situation or particular needs.  You should consider your own investment objectives, financial situation and particular needs before acting upon any information provided and consider seeking advice from a financial advisor if necessary. Before making an investment decision, you should read the relevant Product Disclosure Statement (“PDS”) and Target Market Determination (“TMD”) available at www.ophiram.com or by emailing Ophir at ophir@ophiram.com. The PDS does not constitute a direct or indirect offer of securities in the US to any US person as defined in Regulation S under the Securities Act of 1993 as amended (US Securities Act).

All Ophir Funds are deemed high risk within their respective Target Market Determination documentation.  Ophir does not guarantee the performance of the Funds or return of capital.  An investment may achieve a lower than expected return and investors risk losing some or all of their principal investment.  Past performance is not a reliable indicator of future performance.  Any opinions, forecasts, estimates or projections reflect our judgment at the date of this information and video was prepared, and are subject to change without notice.  Rates of return cannot be guaranteed and any forecasts, estimates or projections as to future returns should not be relied on, as they are based on assumptions which may or may not ultimately be correct.

Actual returns could differ significantly from any forecasts, estimates or projections provided.

The Trust Company (RE Services) Limited is a part of the Perpetual group of companies. No company in the Perpetual Group (Perpetual Limited ABN 86 000 431 827 and its subsidiaries) guarantees the performance of any fund or the return of an investor’s capital.


Previous

16 Jun, 2025 Fund Update - Distribution Estimates FY25

Next

9 Jul, 2025 Stock in Focus - Vusion Group (VU: FP)
16 Jun, 2025

Fund Update - Distribution Estimates FY25

Fund Update • 4 mins read

Back to Insights Back to Insights

Reinvest for Long-term Growth

Historically, for our longer running funds, investors have been substantially better off by reinvesting distributions back into the Fund than investing them in cash or into an investment achieving the broad asset class return.

We demonstrate this below with a hypothetical $100,000 investment into the Ophir Opportunities Fund (OOF) at inception in August 2012.

Source: Ophir, Bloomberg. “Bbill”=Bloomberg AusBond Bank Bill Index – a proxy for Cash return.

Distribution reinvestment into the Fund has provided:

  • More than twice the wealth of distribution reinvestment into Cash.
  • 76% more wealth than distribution reinvestment into an investment achieving the broad asset class return.


Ophir Funds – FY25 Estimated Distribution Per Unit 

As we approach the end of the 2025 financial year, we’re pleased to share preliminary distribution estimates for the Ophir Funds, based on data as at 30 April 2025.

Final distribution figures will be confirmed in July once official calculations are completed. Until then you can view the current estimates below.

Please note these estimates are indicative only and subject to change.


Put your distributions to work

All Ophir Funds offer a Distribution Reinvestment Plan (DRP) to help investors capture the full benefits of compounding and maximise long-term wealth creation.

The DRP offers a range of benefits:

  1. Automatic reinvestment – your distributions are used to purchase additional units in the Fund with no paperwork or payment.
  2. Cost efficiency – DRP units are issued without incurring buy/sell spreads.
  3. Remain fully invested – no time out of the market means your capital continues working for you.
  4. Maintain investment discipline – supports a consistent, long-term approach to investing.


We encourage you to consider electing to participate in the DRP, if you have not done so already, to make the most of your investment in the Ophir Funds. You can update your election via the Automic Investor Portal or this paper form, your investment platform, or by contacting your adviser.

If you have any questions, please contact us via email (ophir@ophiram.com) or phone (+61 02 8188 0397).


This has been prepared by Ophir Asset Management Pty Ltd (ABN 88 156 146 717, AFSL 420082) (“Ophir”) and contains information about one or more managed investment schemes managed by Ophir (the “Funds”) as at the date of this document. The Trust Company (RE Services) Limited ABN 45 003 278 831, the responsible entity of, and issuer of units in, the Ophir High Conviction Fund (ASX: OPH), the Ophir Global Opportunities Fund and the Ophir Global High Conviction Fund. Ophir is the trustee and issuer of the Ophir Opportunities Fund.

This is general information only and is not intended to provide you with financial advice and does not consider your investment objectives, financial situation or particular needs.  You should consider your own investment objectives, financial situation and particular needs before acting upon any information provided and consider seeking advice from a financial advisor if necessary. Before making an investment decision, you should read the relevant Product Disclosure Statement (“PDS”) and Target Market Determination (“TMD”) available at www.ophiram.com or by emailing Ophir at ophir@ophiram.com. The PDS does not constitute a direct or indirect offer of securities in the US to any US person as defined in Regulation S under the Securities Act of 1993 as amended (US Securities Act).

All Ophir Funds are deemed high risk within their respective Target Market Determination documentation.  Ophir does not guarantee the performance of the Funds or return of capital.  An investment may achieve a lower than expected return and investors risk losing some or all of their principal investment.  Past performance is not a reliable indicator of future performance.  Any opinions, forecasts, estimates or projections reflect our judgment at the date of this information and video was prepared, and are subject to change without notice.  Rates of return cannot be guaranteed and any forecasts, estimates or projections as to future returns should not be relied on, as they are based on assumptions which may or may not ultimately be correct.

Actual returns could differ significantly from any forecasts, estimates or projections provided.

The Trust Company (RE Services) Limited is a part of the Perpetual group of companies. No company in the Perpetual Group (Perpetual Limited ABN 86 000 431 827 and its subsidiaries) guarantees the performance of any fund or the return of an investor’s capital.

Previous

10 Jun, 2025 Letter to Investors - May 2025

Next

9 Jul, 2025 Letter to Investors - June 2025
10 Jun, 2025

Letter to Investors - May 2025

Letter to Investors • 13 mins read

Back to Insights Back to Insights

Download PDF


May was a record-setting month for Ophir. In this Letter to Investors, we:

  • Reveal the exact above-market returns our Funds generated for investors this month, making it our best ever
  • Examine 4 crucial lessons from this month of big outperformance
  • Highlight two Australian stocks that delivered outsized gains for the Funds after reporting very strong results
  • And for the Stock in Focus this month, we look at former market darling, Bravura Solutions. After several years in the wilderness, we explain why it is now one of the most exciting holdings in our Aussie Funds


May 2025 Ophir Fund Performance

Before we dive into the Letter, we’ve provided a detailed monthly update for each of the Ophir Funds below.

The Ophir Opportunities Fund returned +11.9% net of fees in May, outperforming its benchmark which returned +5.8%, and has delivered investors +23.3% p.a. post fees since inception (August 2012).

Download Factsheet

The Ophir High Conviction Fund (ASX:OPH) investment portfolio returned +11.4% net of fees in May, outperforming its benchmark which returned +5.9%, and has delivered investors +14.1% p.a. post fees since inception (August 2015). ASX:OPH returned +11.3% for the month.

Download Factsheet

The Ophir Global Opportunities Fund (Class A) returned +8.7% net of fees in May, outperforming its benchmark which returned +5.0%, and has delivered investors +17.3% p.a. post fees since inception (October 2018).

Download Factsheet

The Ophir Global High Conviction Fund (Class A) returned +7.8% net of fees in May, outperforming its benchmark which returned +5.0%, and has delivered investors +13.0% p.a. post fees since inception (September 2020).

Download Factsheet


Our best month ever

At Ophir, amongst the hundreds of emails we receive daily, there is only one that is guaranteed to be read by every single member of the Ophir team.

It is our daily performance email of the Ophir Funds versus their benchmarks, which gets sent around at about 4.15pm after market close.

Now you might think a day is way too short a timeframe to be judging performance, and in many ways it is. But as much as anything we are trying to see two things:

  1. How much any stock news helped or hurt fund performance, and
  2. Whether there were any market factors (like quality, growth, size, momentum, sectors or geographies) that had a big influence.

But if you think daily performance gets our attention, monthly performance gets exponentially more focus by us – particularly the months where we have many companies report.

For our Aussie Funds that’s mostly February and August, and for our Global Funds it’s those same months, plus May and November.

So, May is a really important month for us, and we are pleased to report May was our best month EVER for Ophir investors!

All our Funds were up between about 8-12%, net of fees, in May; and all outperformed their benchmarks which were each up 5-6%.

The benchmarks and share markets, in general, had a very good month in May with the TACO (Trump Always Chickens Out) trade in full force. Markets bet that we’ve seen the worst of tariff news from the U.S. and that an Armageddon scenario is seemingly now off the table.

Setting records

It was the best month ever because we generated about AUD$115 million of above-market returns (outperformance) for our investors.

From when we started in 2012, that result represents a record.

Based on absolute returns, each of our four Funds in May ranked near their best-ever month, as shown in the chart below.

One of Ophir’s Top Performing Months – Gross Returns

Source: Ophir. Data as of 31 May 2025.

Most of those small number of months with better returns were ones driven by the market ripping higher and not necessarily because of strong outperformance by us.

Last month we had both strong market returns AND strong outperformance.

Our flagship Fund, ‘the Ophir Opportunities Fund’, led the way. While the market was up +5.8% in May, the Opportunities Fund surged +11.9% after fees. That was the third-highest-returning month for investment performance from the 154-month history of the Fund!

So, which months beat May 2025?

As you can see from the chart below, it was April and May 2020 when the market recovered from the Covid Collapse in March 2020 after central banks slashed interest rates.

Source: Ophir.

4 Lessons from May

Our four key observations from the May result across the Ophir Funds are:

1. Position sizing matters

Our biggest positions, like Life360, were our biggest winners in May.

As George Soros said: “It’s not whether you’re right or wrong, but how much money you make when you’re right and how much you lose when you’re wrong.

While May typically isn’t a big news or reporting season month for Australian companies, we did have a smattering of companies report quarterly results, and some of our biggest positions delivered good news for our Australian Funds, two in particular:

  • Life360 – the family safety app – reported a great Q1 result on the back of surging user subscription numbers.
  • Also, Generation Development Group, led by former Olympic champion Grant Hackett, announced a tie-up with Blackrock, one of the world’s largest financial services companies, to provide retirement solutions to the Australian market. It also received a boost for its tax-effective investment bonds business, which will become more attractive with the government’s $3m super tax still on the agenda, a policy that lowers the attractiveness of super for the uber wealthy.

Below, we show the average return in each quartile of the Ophir Opportunities Fund by weight for May. So, for example quartile 1 (Q1), which is the top 25% of the Fund by average weight over May (in this case the largest 10 stocks by weight out of the 40 in the Fund) – or in other words our highest conviction stocks – provided an average return of +21.5%.

Whereas our fourth quartile (Q4) stocks – the bottom quarter of the fund by weight – only provided a +0.7% return on average.

Source: Ophir. Bloomberg.

Bottom line: the stocks with the biggest weights in the Fund generally had the best returns; and stocks that lost ground on the month or just treaded water were generally our lowest-weight positions.

As a fund manager, this is exactly what you want.

Our highest-weight positions are generally the stocks we have done the most work on, that we have the biggest edge in, and that the market is most underappreciating.

It’s best to knock it out of the park on a big bet and keep your losers (of which there will always be some) to those stocks where you’ve got less money at risk.

For the Ophir Global Funds, May was a key month because the majority of our stocks reported their March quarter Q1 results.

Again, here our biggest weights were often our best.

For example, iRhythm, a stock we wrote about last month here, was one of our top-3 holdings going into May. The company posted a cracking result that saw its share price up just over +30% for the month.

2.  Compounding is a marvellous thing

A foundation investor who invested $100,000 into our Ophir Opportunities Fund when we started in 2012 saw their investment increase by around $170,000 in May alone.

That’s an almost doubling of their initial investment in a single month!

This clearly illustrates that returns on your returns (ie compounding) truly is the 8th wonder of the world, as Einstein supposedly said.

You just need to start early, be consistent, and let time and hopefully high returns work their magic.

Over a lifetime, you can think of investing as a marathon, with compounding essentially acting like a slowly building tailwind at your back as the race rolls on.

3.  The best months usually accompany the worst months as the market recovers from the bottom.

If you miss the best months trying to time the market, it is very costly.

In investment speak, volatility “clusters”. That is, the best and the worst months often happen side by side.

As we showed in a chart above, we had two of our best months in April and May 2020, right after two of the worst in February and March 2020 when Covid hit.

If you get scared out on the way down, you often don’t get back into the market in time to benefit from the rebound, and you destroy the ability of compounding to work its magic.

The siren song of trying to time the ups and downs of markets is a strong one. In theory billions could be made from successfully doing it.

But as Yogi Berra said, “In theory there is no difference between theory and practice – in practice there is”.

Just because market timing COULD be done doesn’t mean it CAN be done.

One of the best investors of all time Peter Lynch said:

 “I can’t recall ever once having seen the name of a market timer on the Forbes’ annual list of the richest people in the world. If it were truly possible to predict corrections, you’d think somebody would have made billions by doing it”.

And we’d add that, if anyone could time the market, they are not going to sell/tell you their way of doing it. They’d keep that almighty secret to themselves, lest the benefit get competed away if others knew about it.

4. Never get ahead of yourself

We have no doubt that tough months will be ahead at Ophir.  It’s part and parcel of investing. And there are always new lessons to learn.

Good months of performance can easily reverse, particularly if it’s not driven by sustainable increases in the earnings of the companies in which you are invested (pleasingly, though, better earnings drove much of our May result).

We always have new investors who haven’t benefited from past results and have high expectations. This, along with our love of investing, is what keeps us motivated to keep generating attractive returns.

For the remainder of this month’s Letter to Investors we wanted to take you through one of our key holdings in our Aussie Funds that we are particularly excited about: Bravura Solutions.

A Brave New Solution

Bravura Solutions (ASX:BVS) is an enterprise software business that provides the funds and wealth management industries with mission-critical software. Bravura counts as clients some of the largest global investment management firms and Australian superannuation funds.

Back from the brink

After many years of poor capital allocation and mismanagement, Bravura had a near-death experience in 2023.

With revenue going backwards and costs going up, it seemed the writing was on the wall.

Bravura wasn’t winning any new business, and their existing clients were delaying investment decisions over fears Bravura wasn’t a going concern.

At the same time, cost inflation was out of control and the business was burning cash on unscalable Research & Development.

Following an emergency capital raise in March 2023, things needed to change.

Up stepped Pinetree Capital.

Pinetree are an investment firm founded by the Chairman and founder of $100bn+ global software behemoth, Constellation Software, one of the most respected operators in global software.

Action was swift and decisive …

Source: Bravura FY24 presentation

The Board and management team underwent an immediate overhaul.

New management embarked on an aggressive cost-out program where:

  1. A large number of staff that hadn’t been doing much were tapped on the shoulder
  2. Excessive R&D spend was reined in
  3. Lavish London offices full of empty desks were replaced with more appropriate surroundings; and
  4. Specific roles and operations were shifted to the much cheaper jurisdictions of India and Poland.

… and we believe there are more efficiencies to be achieved.

Source: Bravura 1H25 presentation

Revenue starting to grow again

When businesses take such aggressive cost-cutting measures, it’s not uncommon to see revenue growth suffer.

However, with the business now a going concern Bravura’s clients have regained enough confidence to reallocate spend to in-house software development, which means revenue for Bravura.

Despite the reduction in staff numbers, customer feedback has also improved.

As you can see in the chart below, the company has upgraded guidance twice during FY25, with an expected increase in revenue the primary contributor to the guidance upgrades (driven by both the business and FX movements).

Source: Bravura FY25 presentation, Ophir

With Bravura now able to focus on building a pipeline, the next phase of the revenue growth story will be new customer wins. The wins will likely come across both smaller, modular-type sales (shorter sales cycle) and larger-ticket enterprise sales (longer sales cycle).

Should Bravura’s existing customers continue to increase their activity levels, and some new customers start to land, it’s possible for revenue growth to move from the current mid-single digits to low-to-mid double digits in FY27.

Rule of 40?

While Bravura isn’t a pure SaaS (software as a service) business, we see it on a trajectory to becoming a Rule of 40 stock – a software business where profit margin and revenue growth combined equal or exceed 40%.

If Bravura can continue to manage costs well, and they can hit double-digit revenue growth, 25% cash EBITDA margins would be within reach.

And Rule of 40 software companies don’t trade on 3x sales – they trade on 6-7x.

So we think there is big upside for Bravura.

As always, thank you for entrusting your capital with us.

Kindest regards,

Andrew Mitchell & Steven Ng

Co-Founders & Senior Portfolio Managers

Ophir Asset Management

This document has been prepared by Ophir Asset Management Pty Ltd (ABN 88 156 146 717, AFSL 420082) (“Ophir”) and contains information about one or more managed investment schemes managed by Ophir (the “Funds”) as at the date of this document. The Trust Company (RE Services) Limited ABN 45 003 278 831, the responsible entity of, and issuer of units in, the Ophir High Conviction Fund (ASX: OPH), the Ophir Global Opportunities Fund and the Ophir Global High Conviction Fund. Ophir is the trustee and issuer of the Ophir Opportunities Fund.

This is general information only and is not intended to provide you with financial advice and does not consider your investment objectives, financial situation or particular needs.  You should consider your own investment objectives, financial situation and particular needs before acting upon any information provided and consider seeking advice from a financial advisor if necessary. Before making an investment decision, you should read the relevant Product Disclosure Statement (“PDS”) and Target Market Determination (“TMD”) available at www.ophiram.com or by emailing Ophir at ophir@ophiram.com. The PDS does not constitute a direct or indirect offer of securities in the US to any US person as defined in Regulation S under the Securities Act of 1993 as amended (US Securities Act).

All Ophir Funds are deemed high risk within their respective Target Market Determination documentation.  Ophir does not guarantee the performance of the Funds or return of capital.  An investment may achieve a lower than expected return and investors risk losing some or all of their principal investment.  Past performance is not a reliable indicator of future performance.  Any opinions, forecasts, estimates or projections reflect our judgment at the date of this information and video was prepared, and are subject to change without notice.  Rates of return cannot be guaranteed and any forecasts, estimates or projections as to future returns should not be relied on, as they are based on assumptions which may or may not ultimately be correct.

Actual returns could differ significantly from any forecasts, estimates or projections provided.

The Trust Company (RE Services) Limited is a part of the Perpetual group of companies. No company in the Perpetual Group (Perpetual Limited ABN 86 000 431 827 and its subsidiaries) guarantees the performance of any fund or the return of an investor’s capital.


Previous

10 Jun, 2025 Podcast - Andrew Mitchell on the Rules of Investing “The market always wins”

Next

16 Jun, 2025 Fund Update - Distribution Estimates FY25
10 Jun, 2025

Podcast - Andrew Mitchell on the Rules of Investing “The market always wins”

Podcasts • 6 mins read

Back to Insights Back to Insights

Andrew Mitchell on the Rules of Investing Podcast – “The market always wins”

Last month Ophir Co-Founder Andrew Mitchell was invited on the Rules of Investing podcast by Livewire Markets where he was interviewed by Livewire’s Founder James Marley. (Duration 51 mins)

Click here to access the podcast: https://www.livewiremarkets.com/wires/andrew-mitchell-the-market-always-wins

The key highlights are:

Macro environment

  1. Tariff risks have been priced out by the market, but should they? The recent market rebound has occurred virtually solely through multiple expansion and not higher market earnings, despite higher bond yields. The TACO trade (Trump Always Chicken’s Out) is alive and well at present with many investors believing we have seen the worst of the tariff news.
  2. Pullbacks like we saw in early April after Liberation Day are an opportunity as the market always wins in the long term. The market is also betting on Trump not going down the “Armageddon” path which is helping calm investors’ nerves…
  3. We think growth orientated companies become the rare diamond ahead. There is likely lower growth in the U.S. in the second half of 2025 and therefore companies that can grow, like the ones Ophir deliberately targets, are likely to become rarer and command higher valuations by investors. Cyclical businesses might not benefit from the rising tide lifting all boats.
  4. During company blackout in early April we were talking to private company contacts. They were saying it was a scary time. We were preparing for pulling of guidance/downgrades of guidance at U.S. company Q1 results, given in late April/May. We were cautious/pessimistic. Trump backed down on tariffs though and it has taken out some of the “left tail” risk of markets. During this market surge since mid-April we have been trimming some of our most momentum driven company names as these will be the ones investors will go after if the market pulls back again.

Global versus Australian small cap investing

  1. U.S. small caps can be a more volatile market in comparison. In 2022 and 2023 when rates ripped higher, for some U.S. companies’ valuations there was not anyone to catch you during the sell off. Long only funds typically provide a share price floor earlier in Australia helping to limit the downside. This is also the opportunity though in U.S. small caps as valuations can get cheaper as good quality growth companies are not as scarce in the U.S. like they are in Australia. Often Australian companies can get priced to perfection if going overseas through expansion and the market assumes they will win. There are lots of short reports in U.S. where it is par for the course. This is rarer in Australia though. Also, there is often a lot higher short interest in U.S. small caps compared to Australia. This leads to bigger short squeezes, creating more volatility.
  2. History says U.S. market concentration in mega cap tech companies won’t last. Amazon Founder Jeff Bezos has this great quote: “your margin is my opportunity”. Big monopolistic companies get attacked by smaller startups over time. There is also regulatory risk: Will Google get broken up? On some measures the U.S. share market is the most concentrated in 100 years and it’s causing U.S. small cap valuations to be the cheapest to large caps in a generation. We think this will be a big tailwind for U.S. small cap relative returns over the next 5-10 years.

Great management teams in Australia

  1. The Lieutenants (and Swimmers) become the Generals. We backed Bill Beament at Northern Star, the gold miner, many years ago and he transformed Northern Star into a behemoth. In commodity companies we think management teams are even more important than in industrials. We have gone on to back Bill at his new venture Develop Global (ASX: DVP) and also one of his star Lieutenants at Northern Star, Luke Creagh who has gone on to lead Ora Banda (ASX:OBM). Another great business leader we like who is a household name is Grant Hackett. After starting at the Olympics in swimming, he now leads Generation Development Group (ASX:GDG). It, through its businesses Lonsec and Evidentia, is the leading player in Australia in the managed accounts space, developing investment portfolios for financial advisors and high net worth investors. Grant is a great example of a highly driven leader who we like to back.
  2. Being profitable is not the be-all and end-all. We like management teams who, if they are acquiring customers really cheaply, to keep reinvesting for growth. Like with Afterpay, this means you might not be profitable overall though. We’d rather this though than the company go ex-growth just to be profitable. Good management teams know this. Afterpay could have been profitable if it didn’t seek to grow overseas and spend marketing and capex dollars there and just focus on Australia, but it wouldn’t have been anywhere near as big.
  3. Always do your work on the second level of management teams. Great CEOs attract great people. If the second layer of management looks mediocre then this could be a warning sign.

Two stocks we like in Australia

  1. The next “rule of 40” stock in Australia? Aussie financial services software business Bravura (ASX:BVS) recently had its CEO resign, which is not normally a good sign. However, the business is going through a transformation with Pinetree Capital, the Canadian family office behind the highly regarded AUD$100bn+ Constellation Software, building a stake in Bravura and having board influence. Bravura has been shedding excess staff and outsourcing to Poland and India to cut costs and improve margins. Service is improving for its big Australian super fund and UK wealth manager customers and it’s building a pipeline of new business in both regions. We think it can push revenue growth from mid to high single digits into the 10-15% range as it continues to improve its margins into the 20-25% range. This would see it approach a “rule of 40” (revenue growth + profit margin) company, which should see it re-rate from its circa 3-3.5x Enterprise Value/Sales valuation to something closer to 6-7x.
  2. One company for 5 years. Andrew was asked which company he would back if the ASX shut down for the next 5 years. That ASX listed company is Life360, the family tracking app. It has 80+ million users worldwide with a very low cost of customer acquisition. It has turned on advertising as a revenue stream last year and is flexing its platform with moves into the Pet business and Aged Care to come. The key risk is Apple’s “Find My” product. But like with Spotify being better than Apple Music, we believe Life360 can see off this challenge. It has the added benefit of being across both Android and iOS platforms.

Previous

23 May, 2025 Letter to Investors - April 2025

Next

10 Jun, 2025 Letter to Investors - May 2025
23 May, 2025

Letter to Investors - April 2025

Letter to Investors • 15 mins read

Back to Insights Back to Insights

Download PDF


What small caps need to outperform – and does it even matter for us?

After a dramatic period for markets, in this month’s Letter to Investors, we examine:

  • Why markets bounced back strongly from April’s shock sell-off
  • The headwinds that have led to small caps underperforming large caps
  • The key factors that will trigger a much-anticipated small-cap revival
  • How Ophir’s Funds managed to outperform both small and large-cap indexes in 2024, including the S&P 500, despite smalls struggling
  • Why the sheer number of opportunities in small-cap stocks means investors should stick with quality active small-cap managers during periods of small-cap index underperformance
  • A historical perspective on why U.S. small caps have rarely been this cheap relative to large caps


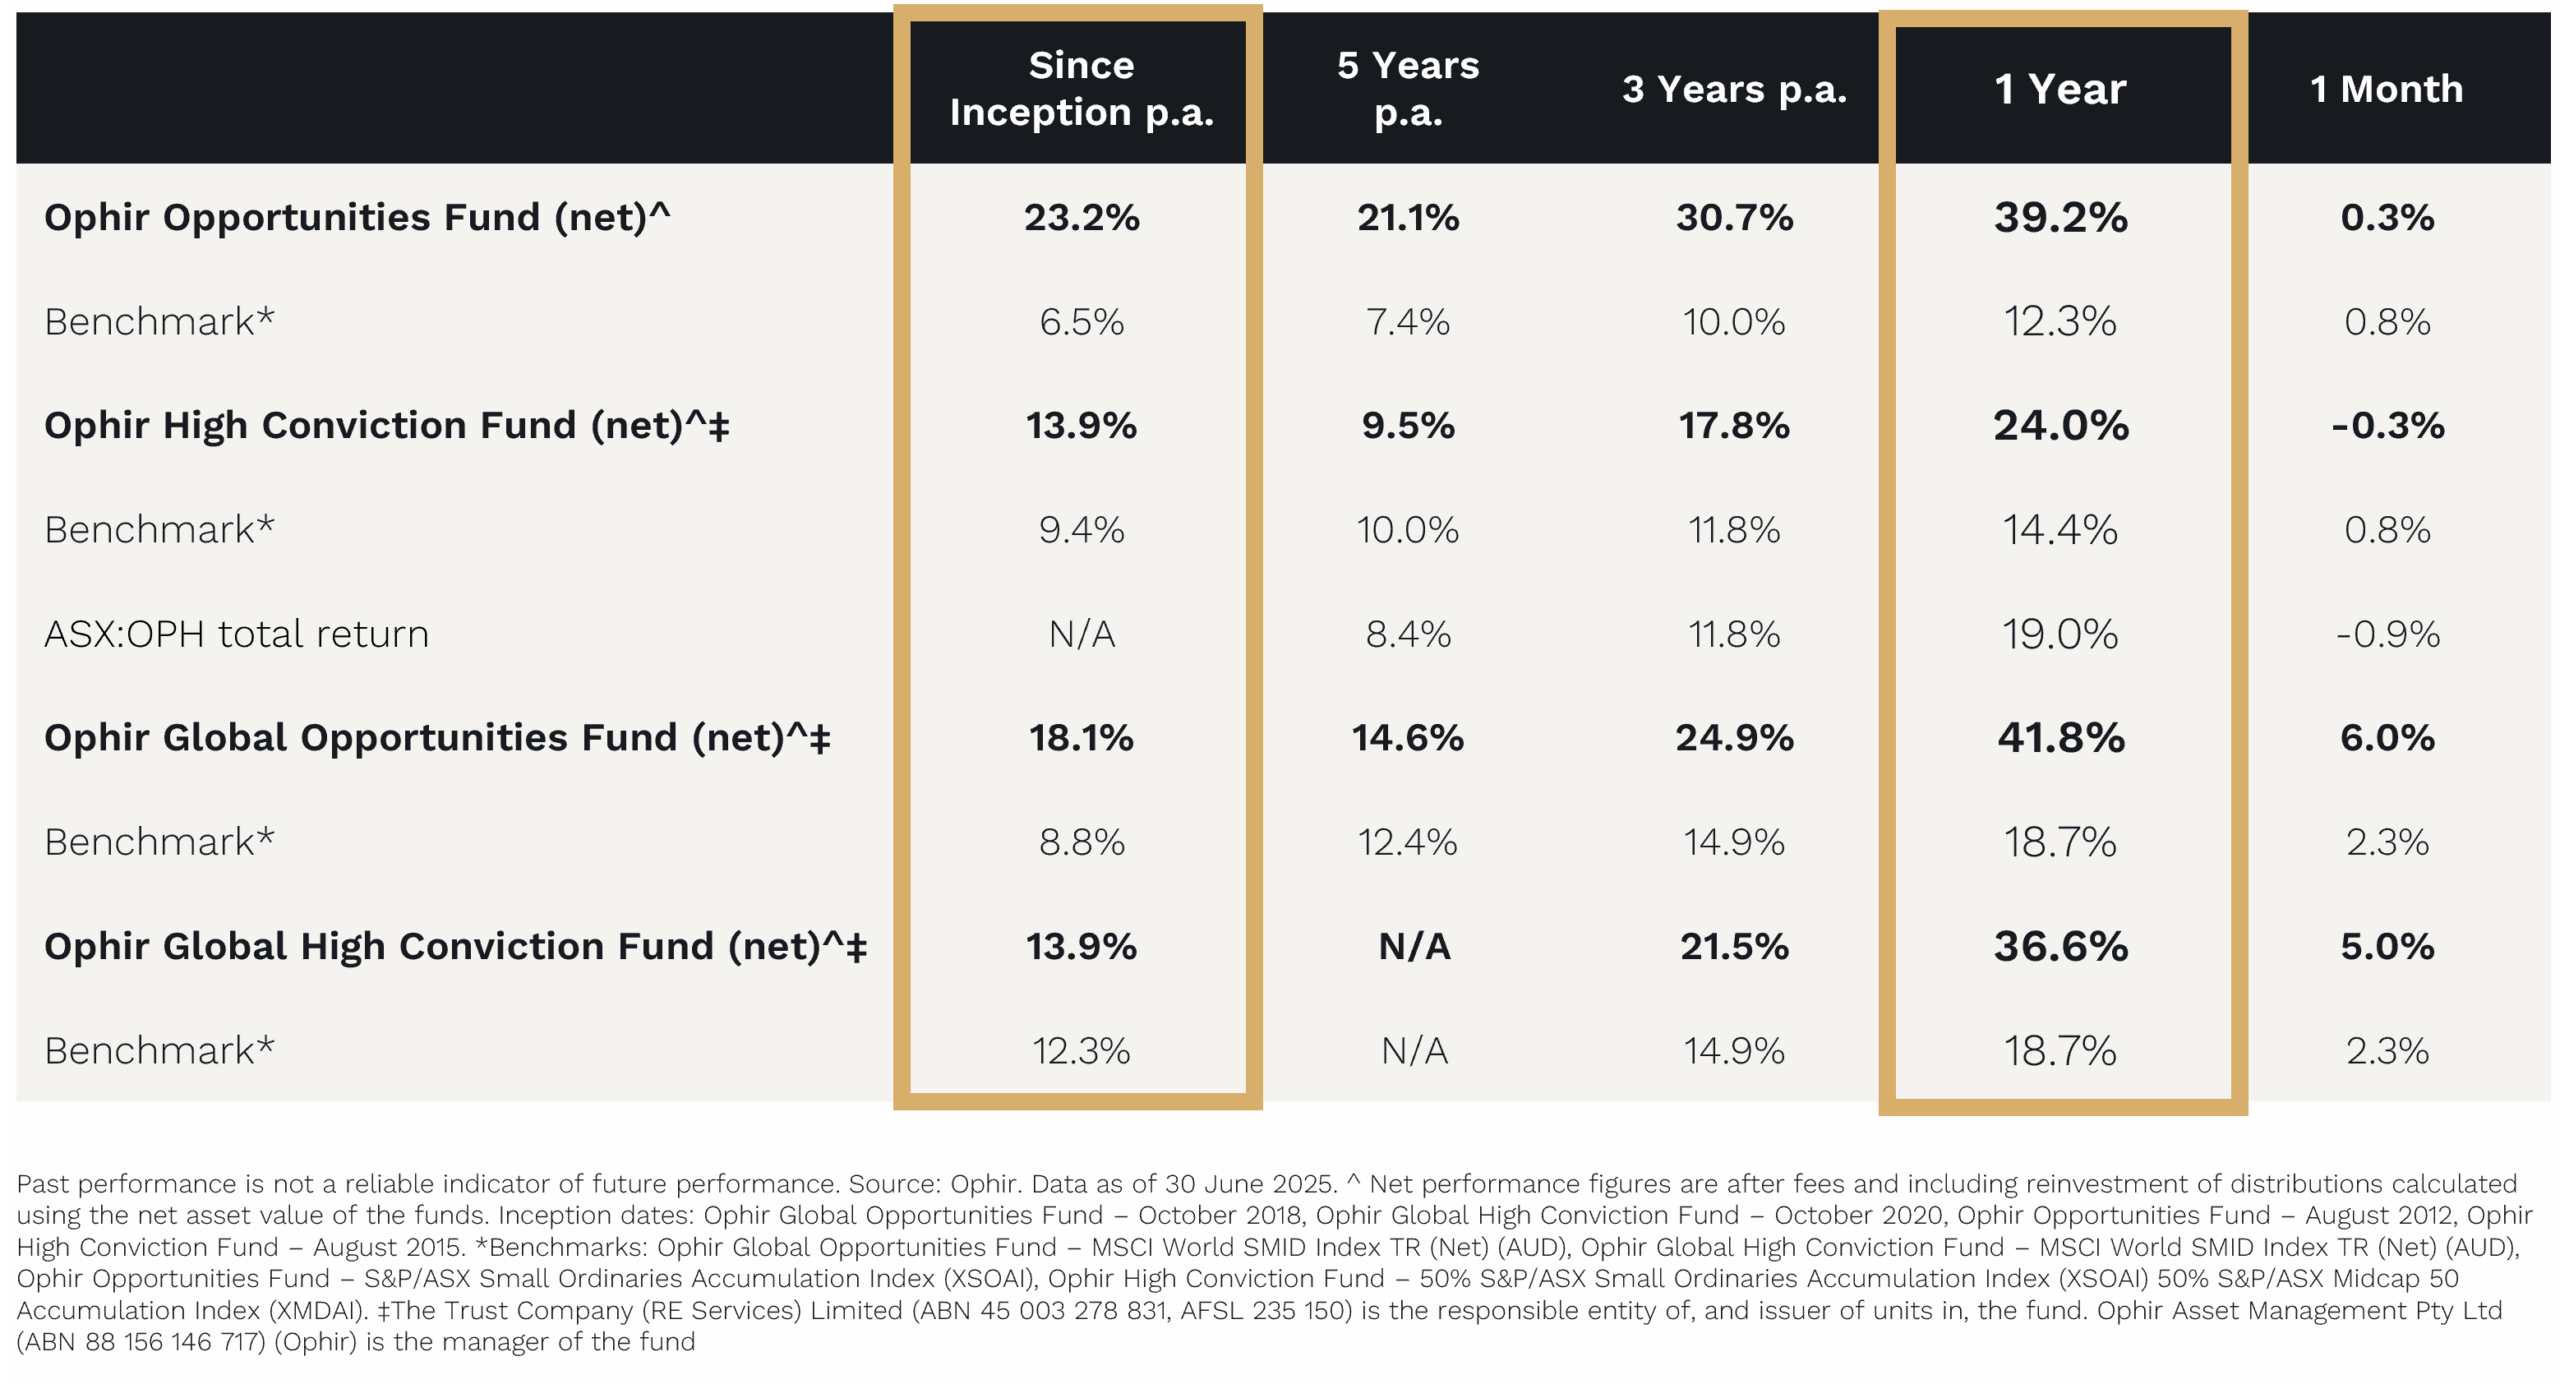
April 2025 Ophir Fund Performance

Before we jump into the Letter, we’ve provided a detailed monthly update for each of the Ophir Funds below.

The Ophir Opportunities Fund returned +1.0% net of fees in April, underperforming its benchmark which returned +1.8%, and has delivered investors +22.4% p.a. post fees since inception (August 2012).

Download Factsheet

The Ophir High Conviction Fund (ASX:OPH) investment portfolio returned +1.5% net of fees in April, underperforming its benchmark which returned +2.6%, and has delivered investors +13.0% p.a. post fees since inception (August 2015). ASX:OPH returned -0.7% for the month.

Download Factsheet

The Ophir Global Opportunities Fund (Class A) returned -0.9% net of fees in April, outperforming its benchmark which returned -1.7%, and has delivered investors +16.0% p.a. post fees since inception (October 2018).

Download Factsheet

The Ophir Global High Conviction Fund (Class A) returned -0.6% net of fees in April, outperforming its benchmark which returned -1.7%, and has delivered investors +11.4% p.a. post fees since inception (September 2020).

Download Factsheet

See latest performance for the Ophir Global Opportunities Fund (Class B) here and the Ophir Global High Conviction Fund (Class B) here.


“Life moves pretty fast. If you don’t stop and look around once in a while, you could miss it” – Ferris Bueller

If you only check the markets once a month, you’d have seen the S&P 500 fell just -0.8% in April. Ho-hum. Big deal.

But what you would have missed is one hell of a rollercoaster ride.

After U.S. President Donald Trump announced higher-than-expected tariffs on ‘Liberation Day’, the S&P 500 crashed -11.2% from the start of the month to its April 8th low.

Then, by month end, it had recovered almost all that fall.

Clearly, since we last spoke in our mid-April Letter to Investors a lot has happened – most of it investor friendly.

From its April 8th low – when Trump paused tariffs for 90 days – the Nasdaq, at writing in mid-May, has put on an incredible +25.4%.

That’s the third-largest rally in any 27-day period in the last two decades, behind only the April 2009 and April 2020 explosions coming out of the GFC and COVID bear markets.

The S&P 500 has also clawed back all its post-Liberation Day losses and is within a whisker of the all-time high reached in February of this year.

Fender bender fades

Is the rally because expectations for U.S. corporate earnings have suddenly improved?

No.

Corporate earnings expectations for the S&P 500 over the next 12 months are marginally lower now than when the market bottomed on April 8th.

But over the last month global trade uncertainty and recession risk in the U.S. and globally has receded. It’s become clearer that President Trump isn’t willing to drive the economic car off the cliff in pursuit of his tariff agenda.

That’s not to say a crash is totally off the cards; but a truly horrific fender bender looks less likely, particularly with airtime starting to increase for growth-positive U.S. tax cuts and deregulation.

The probability of a U.S. recession in 2025, according to Polymarket, has dropped from a high of 66% earlier in May to just 38% now.

And despite some deteriorating softer economic data (mostly survey data of households and businesses), hard economic data such as actual consumer spending and employment, for now at least, have remained rock solid.

While Trump continues to fill the headlines – and that’s not about to change – we thought we’d turn our attention this month to our No.1 question from investors:

“As a small caps manager, what do you think it’s going to take for small caps to start outperforming?”

The recent small cap ride

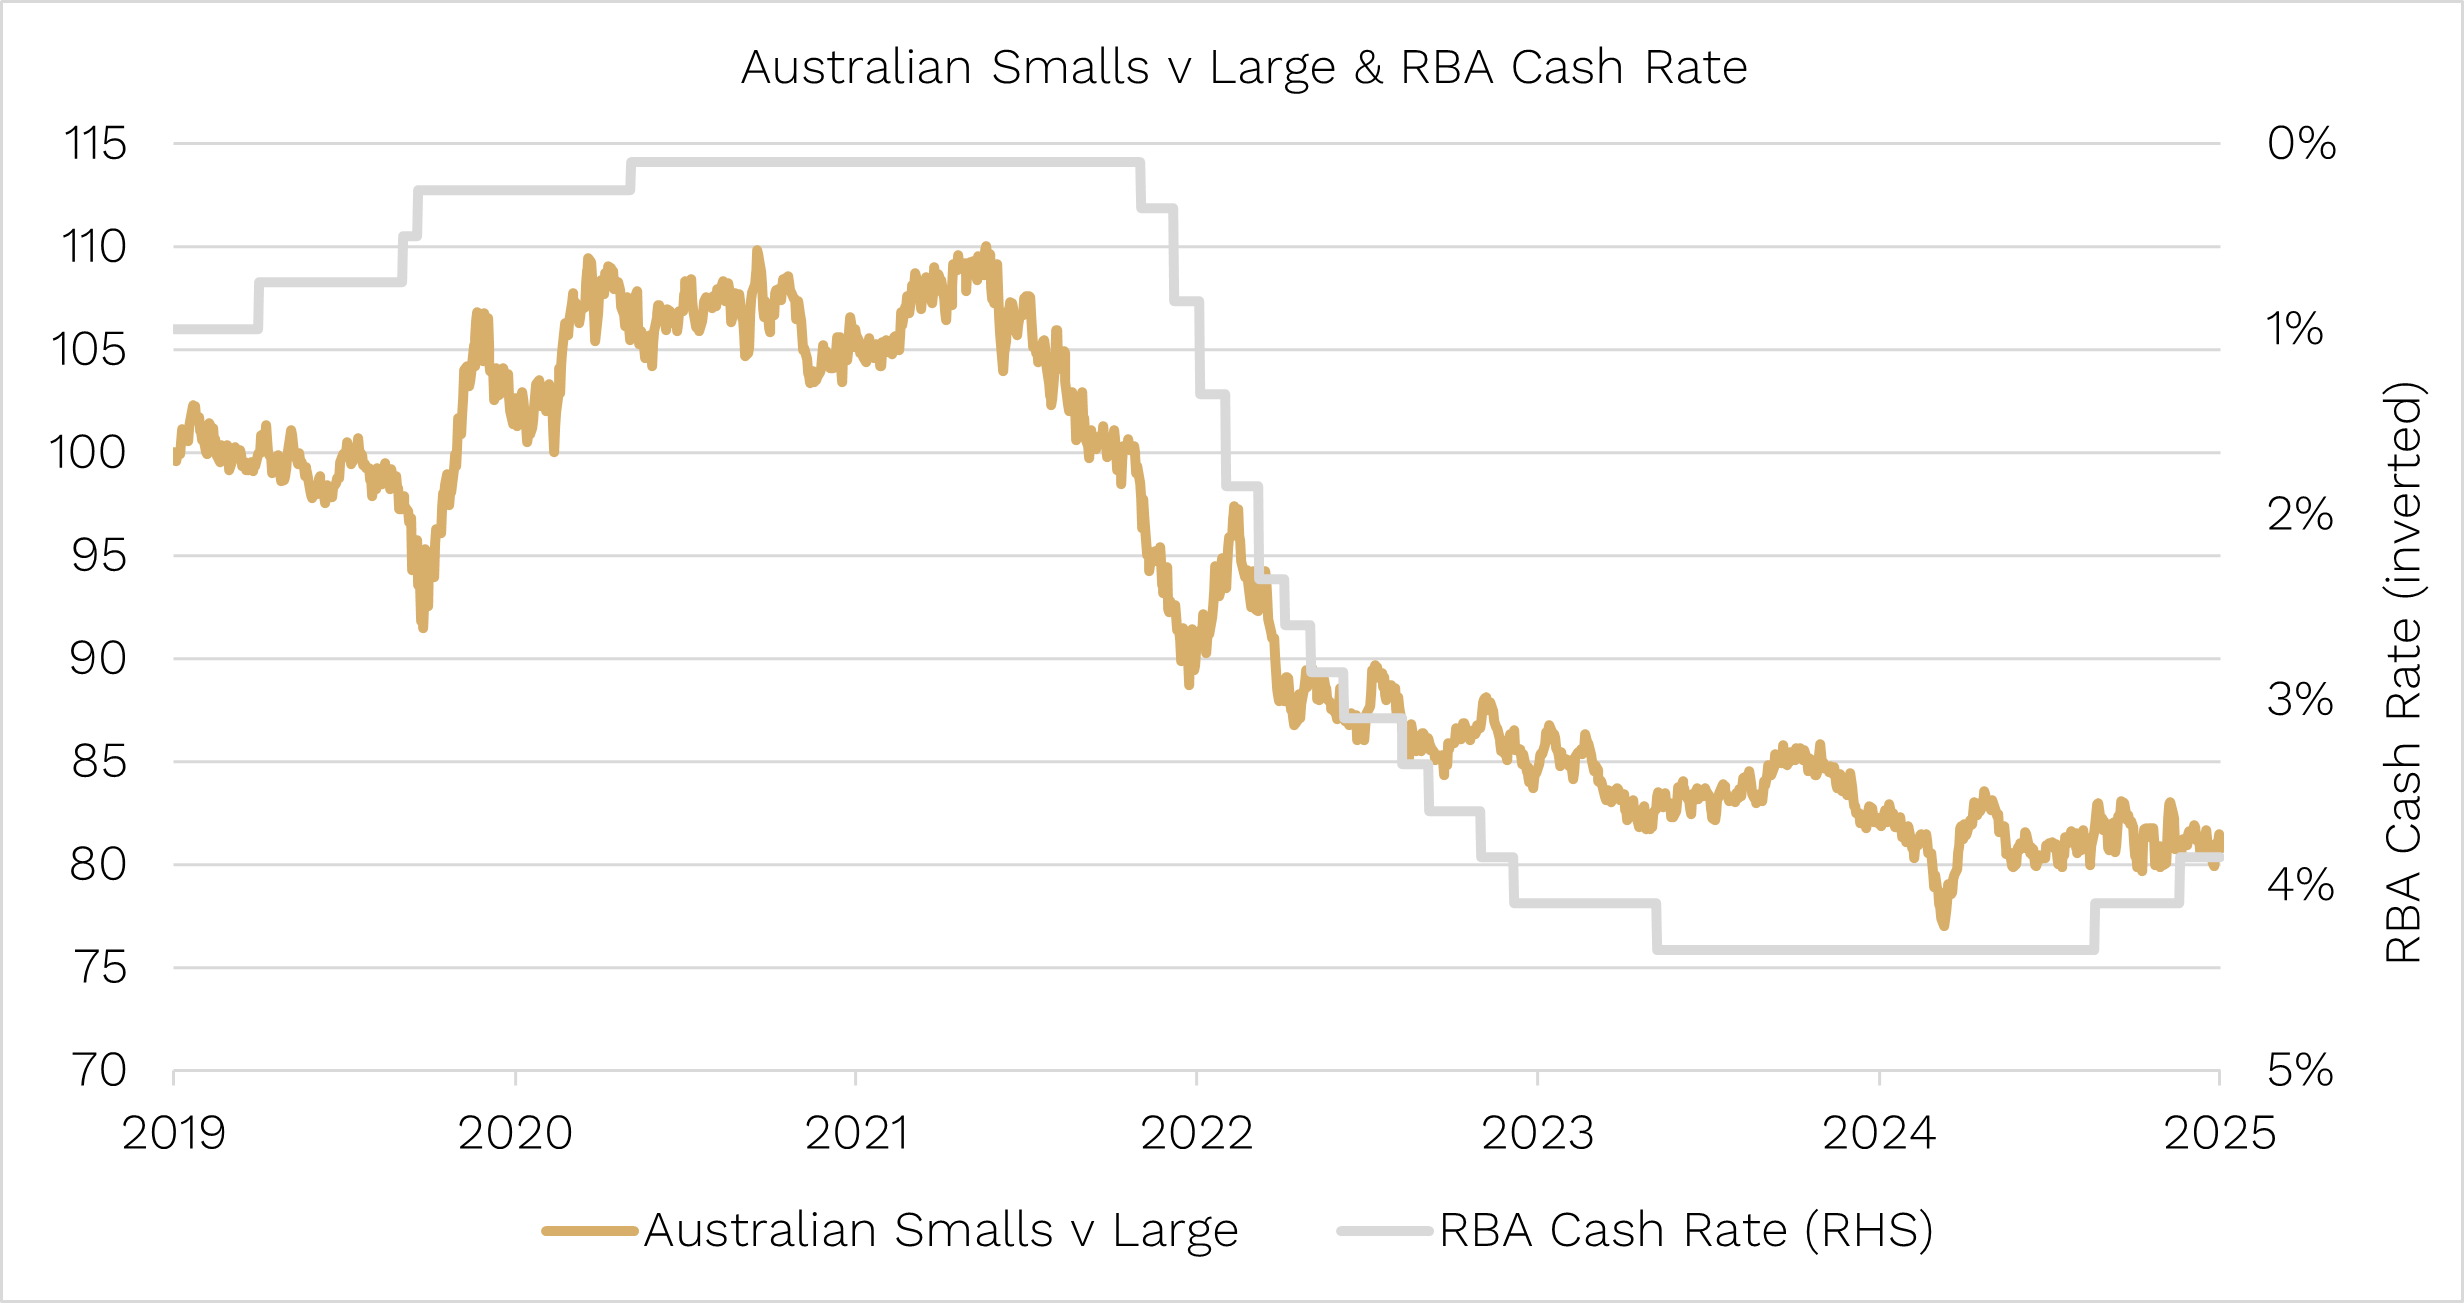
Given U.S. small caps make up about 60% of global small caps (with Japan in a distant second place at 13%), it makes sense to focus on the U.S. because it’s in the cockpit for launching small-cap outperformance.

Below, the orange line shows U.S. small-cap performance (S&P 600 index) divided by U.S. large-cap performance (S&P 500 index).

When the orange line moves up, small caps are outperforming large caps, and when it moves down small caps are underperforming.

Source: Bloomberg. Data to 16 May 2025

In March 2020, when COVID first hit and markets sank, small caps underperformed. Investors shunned the less liquid small end of the market in favour of less risky and more liquid large caps.

The Federal Reserve in the U.S., and most other central banks, cut interest rates in short order, and share markets recovered through the middle of the year. The rally was similar across U.S. small and large caps.

Then came November 2020, when first news of an effective COVID vaccine spread, and small caps shot ahead. We all knew we’d be able to go out again and the market looked forward to a recovering economy.

That small cap bullishness started to wane, though, around mid-2021 when inflation began shooting up as a result of the COVID lockdowns clogging supply chains, and – in hindsight – when the U.S. government and its handout cheques created overstimulus.

This would start the current four-years-and-counting underperformance of small caps through to today.

Why have small caps underperformed?

The inflation/rates headwind for smalls

Higher inflation is typically harder for smaller companies to pass on to consumers because they have less pricing power than large caps.

But, most importantly, higher inflation means higher interest rates.

Small caps in the U.S. typically have more short-term floating rate debt, making them more sensitive to higher interest rates.

At the same time, when war between Russia and Ukraine broke out in early 2022, pushing up oil prices and inflation again, it turned a gentle Fed interest-rate tightening cycle into the fastest hiking in 40 years.

Almost every economist you could find was predicting a U.S. recession in 2022 on the back of those rate hikes. That worry drove continued underperformance of small caps which historically have fallen more in recessions.

But by the third quarter of 2022 it had become clear inflation was peaking, and the U.S. share market finally reached a bottom after a brutal bear market.

This current bull market started in the U.S. (and globally) in October 2022, fuelled first by “the worst is over” for inflation hopes.

The bull market then received extra fuel after the release of ChatGPT in November that year, which boosted large cap tech performance amid optimism they would dominate the AI arms race.

All the while U.S. small caps continued to underperform.

Big clues

However, it’s important to note that this action historically is VERY unusual.

Every other bull market that we have small-cap data for going back to the late 1970s shows small caps outperform in the initial days, weeks and months of a new bull market.

Not this time.

There have been three periods during this bull market, however, when small caps have outperformed for two to four weeks.

That gives us a BIG clue of what the market is looking for to drive a more durable small-cap rally.

Those periods of small-cap outperformance occurred in December 2023, July 2024 and November 2024.

  • The first two were driven by soft inflation data and hopes for imminent interest rate cuts by the Fed. No surprise here: High inflation/rates were the catalyst for small-cap underperformance, lower inflation/rates should be the antidote.
  • The third was a big small-cap rally when Trump was elected late last year that had investors salivating for a cyclical upswing in economic and corporate earnings growth from the more business-friendly President.

The reality since then, however, is that the Fed has held off further rate cuts, preferring to wait and see how Trump’s tariffs impact inflation.

Though the Fed has taken rates down by 1%, they are still restrictive at 4.25% to 4.5%, and they remain above its estimates of a ‘neutral’ rate of 3.0%.

The good news is that markets are pricing in approximately almost 1% of rate cuts over the next year which will make rates much less restrictive and more small-cap friendly.

Earnings drive share markets – small caps need some!

Ultimately, lower interest rates are just a means to an end for small-cap outperformance. And that end is better earnings growth.

U.S. small-cap earnings growth in aggregate has been on the fast train to nowhere over the last two years or so.

And while mid caps have eked out some tiny growth, both mid caps and small caps have been well and truly bested by large-cap earnings growth driven, of course, by a Magnificent 7-induced earnings spree.

Source: Bloomberg. Data to 19 May 2025

Here’s some more good news: U.S. small-cap earnings have never flat lined or gone backwards before for more than about two years. So history says this earnings wilderness might be getting a little long in the tooth.

Rate cuts for more rates-sensitive small caps will help.

Greater tariff clarity would also help. The U.S. tariff situation is a mixed bag for U.S. small-cap revenues and earnings. Small caps are less likely than large caps to have supply chains weaving throughout the world which run afoul of tariffs.

But if they do source goods from overseas, they are less likely than large caps to have the bargaining power to rework those supply chains through lower tariffed countries (if it was even possible to identify who they are yet!).

The bottom line is that when tariff uncertainty is high, economic growth uncertainty is also high. And while that’s happening investors are likely to prefer larger and more liquid companies, which will keep the share prices of large caps comparatively higher than small caps until the tariff dust settles.

The good news is that tariff dust will likely clear at some point this year.

How the Ophir Funds can thrive even if small caps underperform

So should investors shun small caps, or the Ophir Funds, until lower rates, broader growth and more tariff certainty arrives?

Of course, the answer is no.

Exhibit A is the returns of the Ophir Funds in 2024.

The Aussie and Global small-cap benchmarks had average-ish years in 2024. The ASX Small Ords returned +8.4% and the MSCI World SMID index in AUD terms returned +20.7%, but was close to 10% in local currency terms as around half of that gain was due to a falling Aussie dollar.

Each small-cap index underperformed their large-cap index counterparts – in 2024 the ASX 200 rose +12.7% and the MSCI World index (AUD) rose +31.8%.

But, at Ophir, during 2024 we notched up some great results including:

  • Our Aussie Ophir Opportunities Fund returned +42.8%, and
  • Our Global Opportunities Fund returned +45.1%

Not only did our Aussie and global small-cap Funds comfortably beat our small-cap benchmarks, but they also beat the large-cap benchmarks.

How is that possible?

As we show by examining the two charts below, it’s because of a huge number of opportunities for savvy investors in the small-cap space.

Yes U.S. large caps did outperform small caps in 2024 – the S&P 500 returned 25.1% while the Russell 2000 and S&P 600 small-cap indices returned 11.4% and 8.6% each.

Approximately 21% of U.S. large cap stocks outperformed the U.S. large-cap index. A similar percentage of U.S. small-cap stocks – 25% and 21% respectively for the Russell 2000 and S&P 600 Index – also outperformed the large-cap index.

Source: Bloomberg. Data for 2024.

But because there are more stocks in the U.S. small-cap indexes than large caps, there were actually MORE small-cap stocks, by number, that outperformed the U.S. large cap index.

That meant that if you’re a good active fund manager it’s possible to find lots of companies that outperform amid small caps, which in turn allows you to beat the large-cap indices. That’s exactly what we did in the Global Opportunities Fund in 2024.  (Just don’t expect +40% returns every year! Our internal target is +15% p.a. returns in our funds over the long term.)

2024 isn’t just an anomaly though.

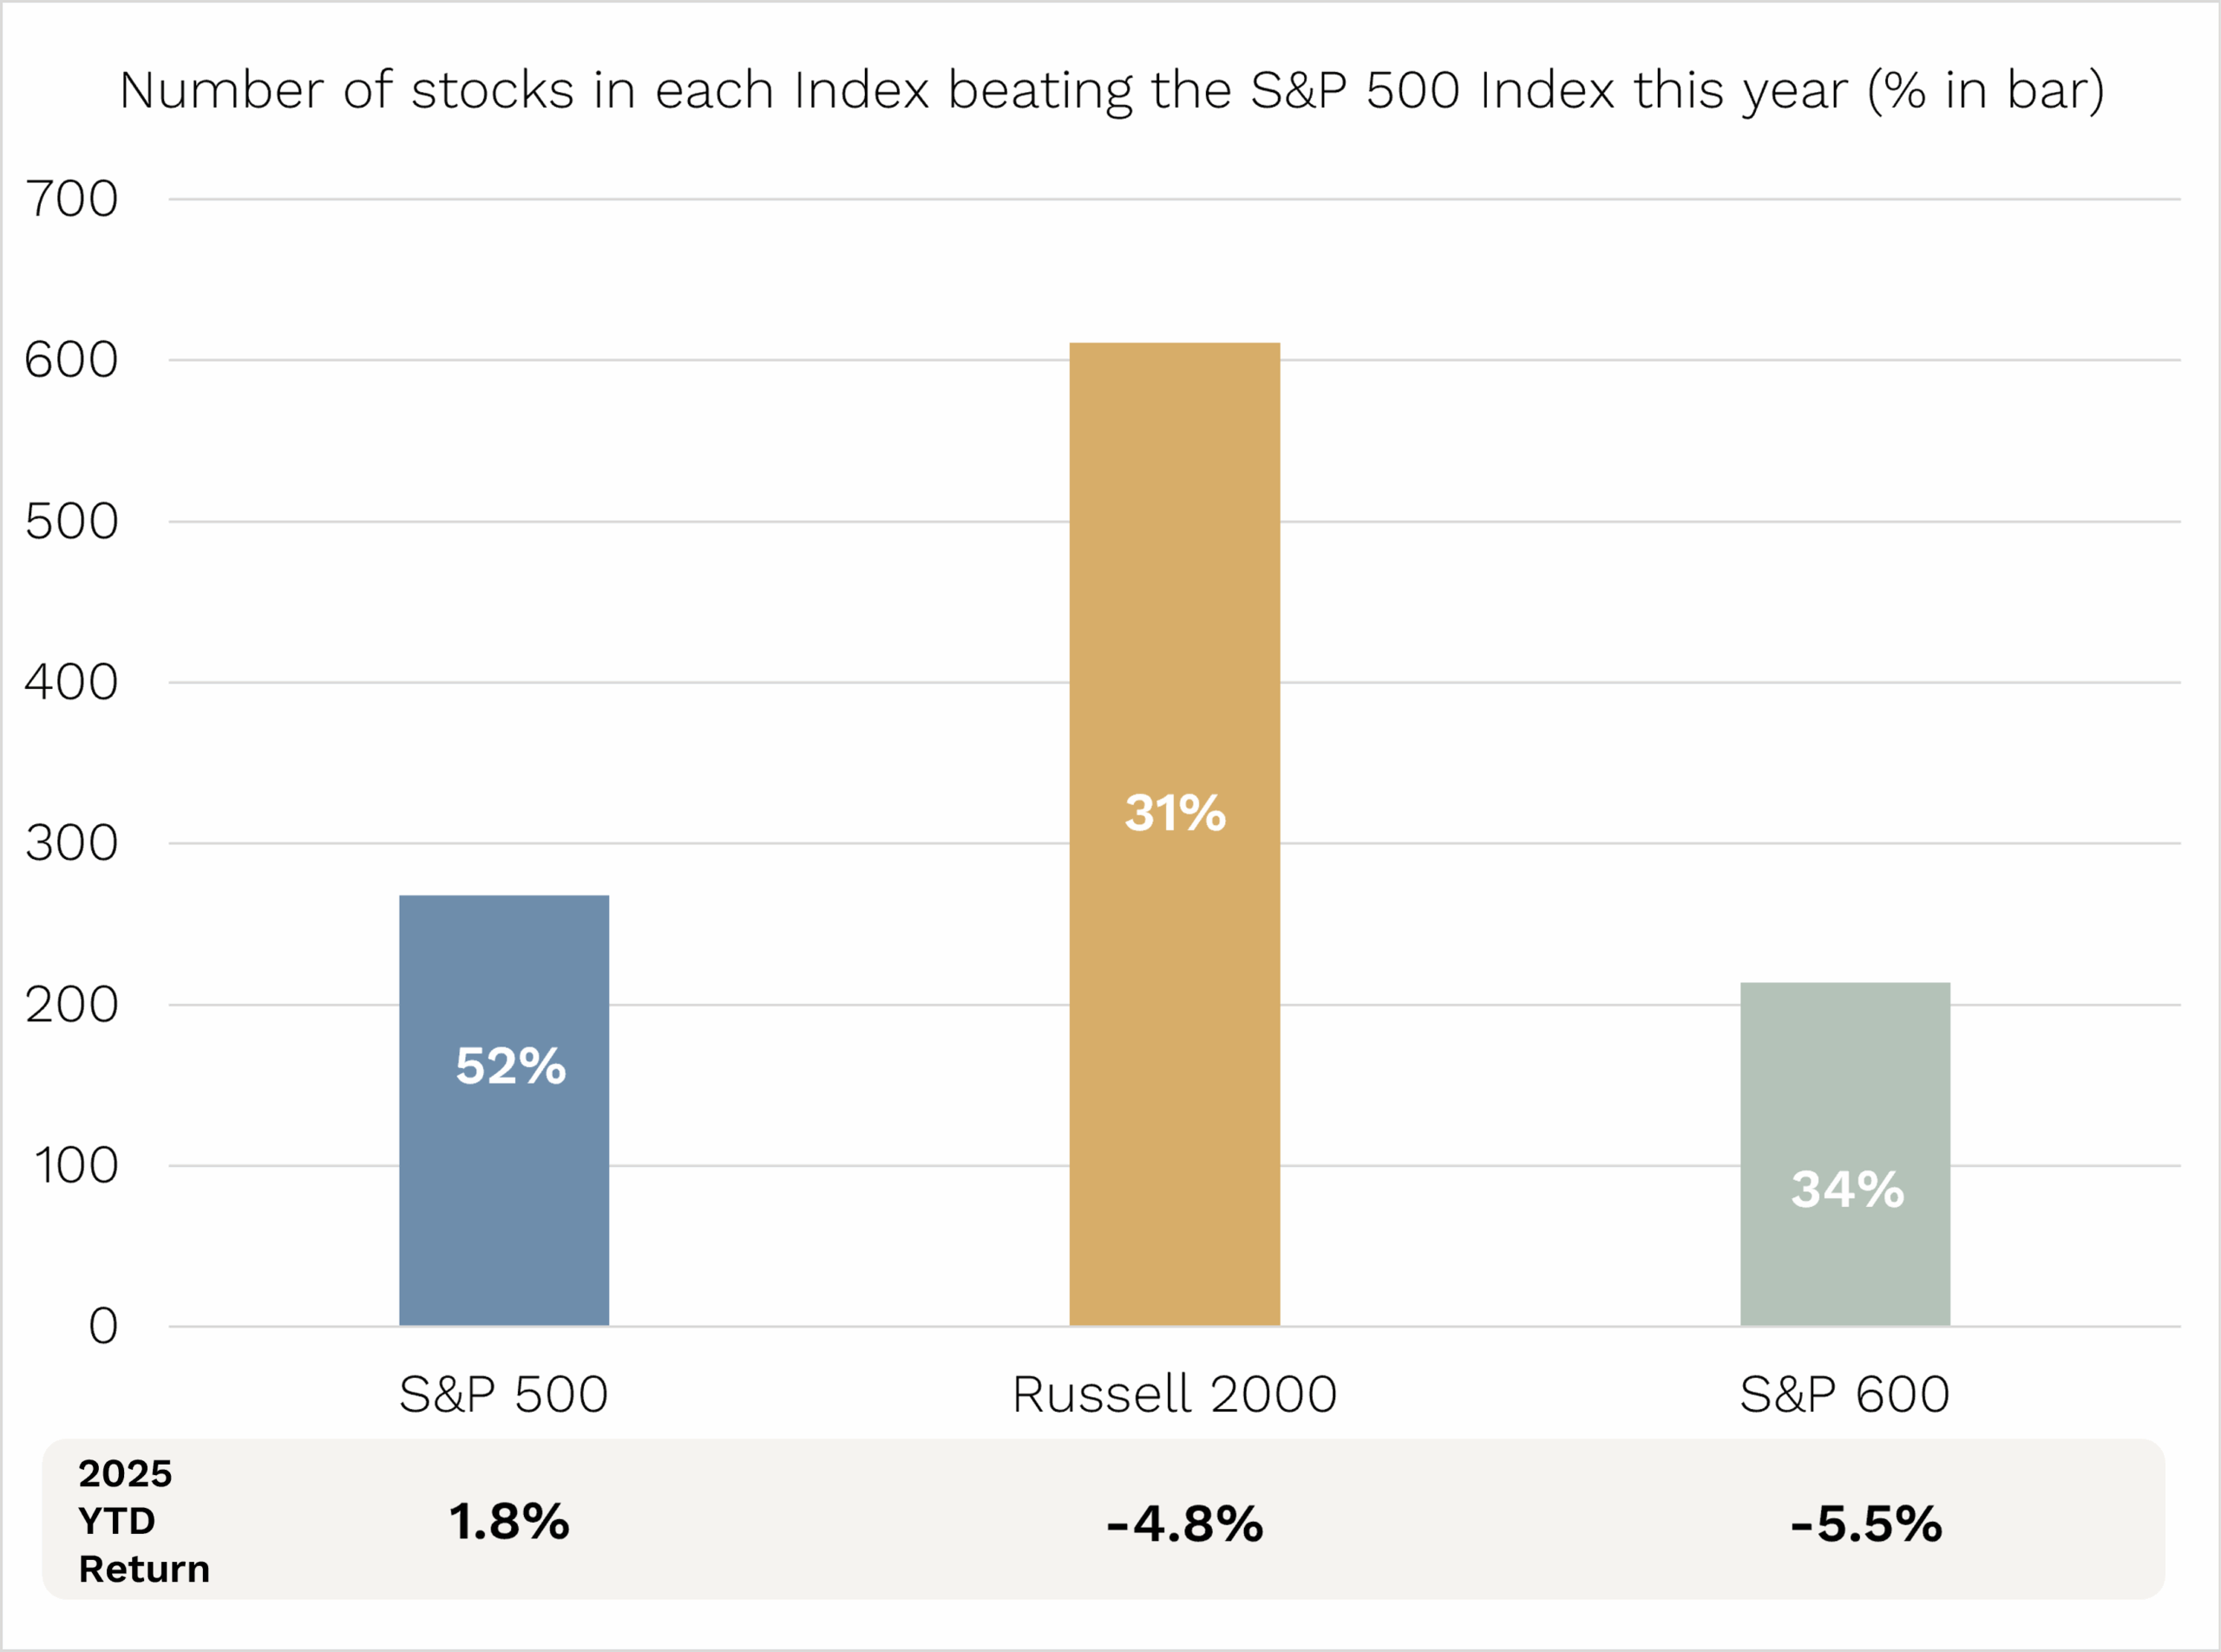
Source: Bloomberg. Data for 2025 to 16 May 2025.

As you can see above, year-to-date in 2025, despite U.S. small caps again underperforming the S&P 500 (-4.8% and -5.5% versus +1.8%) and a higher proportion of the large cap S&P 500 companies outperforming its index (52% versus 31% and 34% of small cap companies outperforming the large cap index) there are still heaps of small caps again beating the large cap index.

Bottom line: don’t shun all active managers in small caps because you think small caps will underperform.

There is still lots of small-cap stocks that are outperforming large cap indexes, providing opportunity for good small-cap managers.

Small caps are cheap

And despite a tough four years for small caps versus large caps, the tide will turn for the three reasons we mentioned above.

While we don’t feel we need small caps to outperform to necessarily generate attractive returns,  it will be welcome when it arrives, nonetheless.

One final reason that small caps are highly attractive now; they are relatively cheap.

U.S. large caps are trading on a forward price-to-earnings (PE) valuation of 21.7x at writing. That’s in the 90th percentile for most expensive in its history – so very expensive.

But at a forward PE of 15.6x, U.S. small caps are only in the 37% percentile of its valuation history – so cheaper than its historical average.

When you combine the two U.S. small cap valuations versus U.S. large caps, only during 9% of the time through history have small caps been this cheap compared with their large cap counterparts.

And it’s not just an expensive Magnificent 7 story driving the relative cheapness of U.S. small caps.

If you equal-weight U.S. large caps (nullifying the Mag 7’s normal huge influence on large-cap index valuations) – though the data doesn’t go back as far – U.S. small caps are still in just the 12th percentile of expensiveness versus large caps.

As Buffett said, “price is what you pay, value is what you get”.

As relative valuations for U.S. small caps versus large caps are generationally cheap, we think you are getting a lot more value for your investment dollar.

And we expect that to play out in the years ahead.

So when we combine the fantastic opportunities on offer given the huge number of small-caps, lower rather than higher interest rates over the next couple of years, and their cheapness relative to large caps, I think we’ll look back in a few years as now being as good a time as any to be investing in the small-caps space.


As always, thank you for entrusting your capital with us.

Kindest regards,

Andrew Mitchell & Steven Ng

Co-Founders & Senior Portfolio Managers

Ophir Asset Management

This document has been prepared by Ophir Asset Management Pty Ltd (ABN 88 156 146 717, AFSL 420082) (“Ophir”) and contains information about one or more managed investment schemes managed by Ophir (the “Funds”) as at the date of this document. The Trust Company (RE Services) Limited ABN 45 003 278 831, the responsible entity of, and issuer of units in, the Ophir High Conviction Fund (ASX: OPH), the Ophir Global Opportunities Fund and the Ophir Global High Conviction Fund. Ophir is the trustee and issuer of the Ophir Opportunities Fund.

This is general information only and is not intended to provide you with financial advice and does not consider your investment objectives, financial situation or particular needs.  You should consider your own investment objectives, financial situation and particular needs before acting upon any information provided and consider seeking advice from a financial advisor if necessary. Before making an investment decision, you should read the relevant Product Disclosure Statement (“PDS”)  and Target Market Determination (“TMD”) available at www.ophiram.com or by emailing Ophir at ophir@ophiram.com. The PDS does not constitute a direct or indirect offer of securities in the US to any US person as defined in Regulation S under the Securities Act of 1993 as amended (US Securities Act).

All Ophir Funds are deemed high risk within their respective Target Market Determination documentation.  Ophir does not guarantee the performance of the Funds or return of capital.  An investment may achieve a lower than expected return and investors risk losing some or all of their principal investment.  Past performance is not a reliable indicator of future performance.  Any opinions, forecasts, estimates or projections reflect our judgment at the date of this information and video was prepared, and are subject to change without notice.  Rates of return cannot be guaranteed and any forecasts, estimates or projections as to future returns should not be relied on, as they are based on assumptions which may or may not ultimately be correct.

Actual returns could differ significantly from any forecasts, estimates or projections provided.

The Trust Company (RE Services) Limited is a part of the Perpetual group of companies. No company in the Perpetual Group (Perpetual Limited ABN 86 000 431 827 and its subsidiaries) guarantees the performance of any fund or the return of an investor’s capital.


Previous

14 May, 2025 Stock in Focus - iRhythm (NASDAQ: IRTC) "I Can Feel the Beat"

Next

10 Jun, 2025 Podcast - Andrew Mitchell on the Rules of Investing “The market always wins”
14 May, 2025

Stock in Focus - iRhythm (NASDAQ: IRTC) "I Can Feel the Beat"

Stock in Focus • 5 mins read

Back to Insights Back to Insights

Download PDF

iRhythm Technologies (NASDAQ: IRTC)

If you’ve ever had a friend or family member have their heart tested, you’ve probably seen the legacy Holter monitor – it’s all wires, electrodes, and an uncomfortable 48-hour test window.

But over the last ten years, San Francisco-based iRhythm Technologies has been displacing this legacy technology with their Long-Term Continuous Monitoring (LTCM) solution.

We’ve followed iRhythm (NASDAQ: IRTC) for over six years after first encountering them on a company ideas trip. We previously owned their smaller listed competitor, BioTelemetry until this was taken over by Philips in 2021.

What attracted us to iRhythm was the growth of its end-market where the company is the market leader. That leadership meant iRhythm commanded a premium valuation in the past.

Source: Bloomberg. Data as of 30 April 2025. Ophir.

But then in recent years various reimbursement and industry-wide DOJ (Department of Justice) issues have acted as an overhang on the stock.

This presented us with the opportunity to initiate a position towards the end of 2024 with our investment thesis being predicated on:

  • Top-line growth beating market expectations
  • Growth optionality from international markets and new devices
  • Multiple expansion as the market is willing to pay a more premium valuation as growth accelerates

A Market in Motion – and iRhythm is Leading the Dance

As mentioned, the market for ambulatory cardiac monitoring (ACM) – basically testing for irregular heartbeats that are symptoms of heart disease – is undergoing a secular shift away from Holter monitors toward longer-term, wearable, mobile-enabled cardiac patches.

iRhythm pioneered the Long-Term Continuous Monitoring category, and patients are tested with a 14-day wearable patch. The patch captures higher diagnostic yields, is easier for patients, and integrates seamlessly with digital workflows.

The current ACM total addressable market (TAM) in the US is ~27 million patients. This is based on the number of patients presenting in primary care who may be symptomatic or at-risk for arrhythmias. Due to the ageing population and prevalence of chronic disease, the TAM is growing at mid-single digits.

However, only ~25% of that base is currently being tested.

Source: iRhythm Technologies First Quarter 2025 Results: May 1, 2025. Ophir.

We estimate the actual testing market is growing at high-single digits and within that the LTCM segment is growing at 15–20%.

We expect this growth to continue for several reasons:

  1. The legacy Holter monitor will continue to cede share to LTCM: Holter had 80% of the market in 2018, but that has fallen to 40% currently and continues to trend lower.
  2. Testing rates will continue to increase: With testing rates currently at ~25% we expect this to increase. This will be driven by the Primary Care Physician (PCP) channel, which has been experiencing consolidation by private equity groups in recent years. Increased rates of testing have the potential to lower the total cost of care for these groups. For example, 30% of all strokes are caused by Atrial Fibrillation – a common heart rhythm disorder tested for by ACM.
  3. iRhythm is taking share in LTCM: iRhythm currently has ~70% share of the LTCM market. We recently met with competitors who confirmed iRhythm has recently been taking incremental share.

The Beat Goes On – iRhythm’s revenue to beat while margins expand

The market has been assuming revenue growth slows to mid-teens, however we believe 20%+ top-line growth is sustainable for the next several years for the reasons mentioned above.

At the same time, iRhythm’s margin story is playing out nicely. We expect its selling & marketing spend to be stable at ~15% of revenue, with general & administrative costs to be largely flat.

This would drive a significant beat to the streets 2025 EBITDA expectations of ~$55m.

Top line optionality exists

On top of that, international expansion is in its infancy – the global market is a $US1 billion+ TAM and largely untouched by the competition.

Source: iRhythm Technologies First Quarter 2025 Results: May 1, 2025. Ophir.

iRhythm isn’t stopping with LTCM.

In 2026, they’re launching a new Mobile Cardiac Telemetry (MCT) product, allowing for further market share gains. MCT is a method of continuously monitoring a patient’s heart rhythm and electrical activity using a small, portable device that transmits data wirelessly to a monitoring centre. This would open up another 20-30% revenue opportunity. There has been evidence of early execution here via the Zio AT, iRhythm’s existing MCT device. This has been the main source of upside surprise from recent growth.

DOJ cases likely just a short-term distraction

Some investors may shy away because of a lingering DOJ investigation, which was announced in May 2023.

The case is part of a broader ACM industry probe (BioTelemetry, Boston Scientific, and Proventice all received similar inquiries). Proceedings revolve around a narrow document production request tied to attorney-client privilege.

iRhythm’s legal counsel is recommending the company defend the privilege to avoid setting a damaging precedent with the court hearing scheduled for December 12.

Based on the discussions we have had with legal experts, we believe this to be a short-term distraction that will soon be in the rear-view mirror.

Why we hold following the recent bounce – Growth on growth on growth

iRhythm just reported their first quarter 2025 results, which saw the stock up ~20%.

The result showed the initial stages of our thesis playing out with iRhythm upgrading its guidance for revenue and EBITDA margin.

However, we believe iRhythm is only at the beginning of a multi-year period of elevated top-line growth and expanding margins, supported by optionality, which will drive a multiple re-rating.

We think the stock deserves to trade 6-8x forward sales (vs ~5.5x today), aligning it with other 20%+ growth MedTech names.

And while many think the music is slowing – we think iRhythm is only just starting to feel the rhythm.

Previous

2 May, 2025 Press - The top Australian small-cap fund, year after year

Next

23 May, 2025 Letter to Investors - April 2025
1 May, 2025

Press - How Australia’s best small-cap fund got its 39.6pc return

Press • 4 mins read

Back to Insights Back to Insights

The Australian Financial Review.

Ophir Asset Management has emerged as the best ASX small cap investor over the past decade after its flagship fund toppled rivals in Mercer’s latest investment survey.

The Opportunities fund, managed by Ophir founders Andrew Mitchell and Steven Ng, returned 39.6 per cent before fees in the 12 months through March, thrashing the S&P/ASX Small Ordinaries Index, which fell 1.3 per cent. It also ranked first over two, three, five, seven and 10-year horizons, returning 23.5 per cent each year over the past decade.

Mitchell attributed the rare feat to nailing the size of the fund’s individual holdings – allocating more weight to high conviction calls and less to riskier stocks.

Early bets in Afterpay and A2 Milk rocketed the fund’s longer-term returns, while more recently the fund’s largest positions in 2024 including Life360, Generational Development, Bravura and Superloop all doubled in value in 12 months.

And while the smaller end of sharemarket has been hit particularly hard by US President Donald Trump’s trade war – the S&P/ASX Small Ordinaries Index plunged 15.5 per cent from peak to trough – Mitchell has used the turbulence to snap up and add to high-quality stocks that had been dumped by rivals.

“We welcome market volatility because in small-cap land where there’s less liquidity, that’s when people panic and sell, and you can pick up a great business at a very discounted price,” he told The Australian Financial Review.

Ophir has topped up its positions in Life360 and Bravura, and added AMA Group to the portfolio.

Mercer’s small-cap survey includes funds that invest in companies listed on the S&P/ASX 300, but excludes the sharemarket’s 100 biggest stocks.

Podium finish

The results show the best performing small cap strategies posted stronger returns than their large cap rivals. Forager’s Australian Shares Fund won Mercer’s main survey by a huge margin, returning 21.7 per cent in the 12 months to March 31. The second-ranked Chester Opportunities Fund rose 13 per cent.

Firetrail’s Small Companies Fund was ranked second in Mercer’s small-cap survey over the past year, returning 22.1 per cent and achieved a podium position across the two and five-year horizons.

The fund benefited from co-portfolio manager Matthew Fist’s background as a mining engineer and has risen the record rally in gold prices through Genesis Minerals and Greatland Gold. Long-term positions in Generational Development, Regis Healthcare and Life360 also boosted performance.

Firetrail’s co-portfolio manager Eleanor Swanson has positioned the portfolio more defensively by allocating more money to real estate stocks such as Aspen, which is now in its top three holdings alongside the gold producers.

She has also lifted the fund’s exposure to healthcare and bought more shares in A2 Milk.

“We’ve taken the view that while it’s pretty amazing that markets have held up so well, the uncertainty created by Trump’s tariffs means we’re expecting more volatility,” Swanson told the Financial Review.

Fist and Swanson have also injected more liquidity into the fund by trimming holdings in its smallest companies and putting more money into larger-capped stocks.

Bronze medal

Ausbil’s Australian Small Cap Fund, which was launched during the pandemic in April 2020, came in third with a one-year return of 18 per cent. It finished in the same position across a two- and three-year timeframe.

Performance was boosted by a strong March quarter as portfolio managers Arden Jennings and Andrew Peros limited exposure to Trump’s trade war. That made sure that less than 20 per cent of the portfolio was directly exposed to US dollar-denominated revenue, and under 10 per cent relied on imports to America.

Like Firetrail, Ausbil benefited from the record rally in gold prices thanks to positions in Genesis Minerals, which surged 50.2 per cent in the first quarter, and Ora Banda Mining, which rallied 67.8 per cent. The fund owns Generation Development Group, which jumped 40.2 per cent.

Jennings and Peros also took advantage of the sell-off in consumer-facing stocks in March and the subsequent rotation into defensive and resource stocks.

“We have been using this as an opportunity to ‘high-grade’ the fund by adding to conviction names such as Light & Wonder, Life360, Codan, and Tuas,” the pair wrote in a quarterly update to clients.

The fund’s top five holdings at the end of March were Aussie Broadband, Codan, Generation Development, Genesis Minerals and Life360.

To view full article: ASX small caps: Ophir dominates small cap rivals to win Mercer’s investment survey

Alex Gluyas is deputy markets editor based in the Melbourne newsroom. Email Alex at alex.gluyas@afr.com

Previous

17 Apr, 2025 Letter to Investors - March 2025

Next

2 May, 2025 Press - The top Australian small-cap fund, year after year
17 Apr, 2025

Letter to Investors - March 2025

Letter to Investors • 15 mins read

Back to Insights Back to Insights

Download PDF


Investing in the Age of Populism

  • Trade Policy uncertainty has been driving extreme levels of market volatility
  • As a result, both the Russell 2000 and the S&P 500 fell -6.8% and -5.6% respectively in March with more volatility seen in April post “Liberation Day”
  • Growth underperformed Value from an investing style perspective during March, with sectors we are typically more exposed to such as Consumer Discretionary and Tech most impacted
  • We reflect on the extreme starting point for tariffs compared with market expectations and its impact on the share and bond markets
  • We highlight some of the recent steps we have been taking due to the current tariff and economic backdrop
  • While we don’t profess to know the final outcome, 1-year and 5-year returns following such elevated levels of volatility have all been positive since 1990


March 2025 Ophir Fund Performance

Before we jump into the Letter, we’ve provided a detailed monthly update for each of the Ophir Funds below.

The Ophir Opportunities Fund returned -3.6% net of fees in March, in line with its benchmark which returned -3.6%, and has delivered investors +22.4% p.a. post fees since inception (August 2012).

Download Factsheet

The Ophir High Conviction Fund (ASX:OPH) investment portfolio returned -5.7% net of fees in March, underperforming its benchmark which returned -3.6%, and has delivered investors +12.9% p.a. post fees since inception (August 2015). ASX:OPH returned -10.9% for the month.

Download Factsheet

The Ophir Global Opportunities Fund (Class A) returned -4.3% net of fees in March, underperforming its benchmark which returned -3.5%, and has delivered investors +16.4% p.a. post fees since inception (October 2018).

Download Factsheet

The Ophir Global High Conviction Fund (Class A) returned -4.0% net of fees in March, underperforming its benchmark which returned -3.5%, and has delivered investors +11.8% p.a. post fees since inception (September 2020).

Download Factsheet

See latest performance for the Ophir Global Opportunities Fund (Class B) here and the Ophir Global High Conviction Fund (Class B) here.


The 1987 stock market crash, the GFC, COVID and now Trump’s trade war. What do they have in common?

Extreme levels of share market volatility. In big and/or fast share market sell-offs we see that “volatility clusters”. The market doesn’t fall in a straight line. The very best and worst days on the market are not spread out like needles in a haystack. They more likely sit, like those on a blind first date, uncomfortably side by side.

Why?

In a word – “uncertainty”.  Uncertainty has skyrocketed and investors are struggling during these periods to work out what is the right market reaction.

You can see this clearly below where we show the daily market moves in the worlds most followed share market index, the S&P 500.

The U.S. share market has gone up about 10% p.a. long term, which over ~250 trading days a year, means on average it goes up about 0.04% a day. Of course, it’s never so calm that it goes up that amount every day. If it did, it would cease to be as risky, and you wouldn’t get anything like a 10% p.a. long term return.

It’s in part because you occasionally get these days where it goes up +5% or -5% intraday, you get rewarded by higher long-term returns in the share market. Stomaching uncertainty, volatility and occasional big daily swings is the price you pay – and the prize inside is an asset class with the highest long-term returns.

Source: Bloomberg. Data to 14 April 2025.

Markets had already started becoming more volatile in February and March as Trump’s initial tariff moves on China, Mexico and Canada spooked investors with his 2nd April Liberation Day “big daddy” reciprocal tariff announcement looming.

The Art of the Tariff Deal

As widely reported, the 2nd April didn’t go well for investors. The following two trading days saw the S&P 500 down about -5% and -6% respectively. Basically, the fastest “correction” (>-10% fall) in history, outside of COVID.

Investors were struggling to comprehend the size of the tariffs announced by the U.S. on its trading partners (and some islands only inhabited by penguins! – story link).

The tariffs were much bigger than virtually anyone expected and if implemented would take the U.S. average tariff rate on imports from less than 3% in 2024 to a little over 25% – a level not seen for over a century! Effectively this would unwind 100 years’ worth of global trade liberalisation. A very big deal and why the market puked in response.

Of course, what Trump claimed – that he was placing reciprocal U.S. tariffs on countries that imposed tariffs on U.S. goods – was far from reality (see chart); in fact, it simply reflected the size of the U.S. goods trade deficit with those countries.

Sources: USA Census Data, World Trade Organisation, World Bank.

Perhaps this was just the typical Trump playbook of starting with a maximal opening offer to gain leverage in negotiations for better trade deals. We should all hope this is not the end position!

Deal or No Deal – the countries you should care about

As trade uncertainty at writing in mid-April looked to have peaked (at least for now) with Trump pushing back reciprocal tariffs for those countries above the 10% minimum baseline rate by 90 days (except for China), the market breathed a big sigh of relief staging an almighty +9.5% S&P 500 rally on the day. Subsequently Trump has also announced some tariff carve outs for tech equipment imports, such as laptops and smartphones, and also the possibility of concessions for the auto industry.

But does this mean the worst is over for markets from Trump’s trade war?

Maybe, however it’s still far from clear. The biggest “offenders” in Trump’s mind is those countries with the biggest goods trade deficit. As shown below, China, Europe, Mexico and Vietnam stand out. Trade deals with smaller deficit countries will no doubt be hailed as successes by the U.S. but won’t really move the dial in the trade war. Ultimately what happens with the big deficit countries like China, who retaliated and now each face over 100%+ tariffs on goods trade, is the main game.

Source: U.S. Census Bureau. P. Thal Larsen. 31 March 2025.

Trump blinks

Probably the most important piece of information for investors post Liberation Day was that Trump is willing to course adjust and back off when pushed.

So, what made Trump blink – pausing the reciprocal tariffs for 90 days and adding carve-outs for certain sectors and products?

It’s the market that bats 1,000 to use a baseball term – the bond market. In the second week of April the U.S. 10-year yield rose 0.5% to about 4.5%. A weekly rise that large hasn’t been seen since November 2001! (A bygone era where Sony Discman’s were the rage and the first Harry Potter movie had just been released).

Source: Bloomberg. Data to 11 April 2025.

Remember the U.S. runs a momentous US$2tr fiscal deficit (6.3% of GDP) alongside its trade deficit. That fiscal deficit must be financed through issuing debt, so Trump, and particularly Secretary of the Treasury Scott Bessent, are very sensitive to escalating debt costs to fund that deficit and the U.S.’s growing US$36tr debt pile. It might not be as sexy and lucrative as the share market, but you can bet the bond market still knows how to scare the most powerful man in the world, especially when debt interest costs make up the largest expense in your budget.

That’s not to say it was all beer and skittles for share investors recently.

How bad did it get for shares?

Below we show the drawdown (peak to trough fall) for U.S. and Australian Large and Small Caps. What’s clear is that U.S. small caps (Russell 2000) copped it the hardest, entering into bear market territory (>-20% down) and just shy of a -30% fall before the partial recovery. This is interesting because U.S. small caps have had a median drop of -36% during the six U.S. recessions since 1980 for which we have data. In other words, they fell about ¾ of the typical decline seen in a recession. However, despite the trade war, the U.S. has yet to experience a recession—and may still avoid one. (At writing, Polymarket currently places the probability of a U.S. recession in 2025 at 53%.)

The S&P 500 fell -19% by early April, roughly 80% of the way toward its median decline of -24%, calculated from the twelve U.S. recessions for which we have data, dating back to World War II. So, things got pretty rough. Australian Large and Small caps faired relatively better, falling near -15%, but are now less than -10% off their highs. This in many ways makes sense as the U.S. represents less than 4% of Australia’s total exports (and less than 1% of GDP), as well as having received the equal lowest announced tariff rate of 10% on Liberation Day.

Source: Bloomberg. Data to 14 April 2025.

The bigger worry for Australia is any slowing down in China, Australia’s largest export destination by far, as it gets targeted by the U.S. given its huge trade surplus.

What we’ve been doing

What does all this mean for us at Ophir and how we are managing our Funds in response?

Firstly, our Global Funds that are most directly impacted from recent tariff announcements. This is a result of those funds being about 60-65% allocated to U.S. based companies (in line with our benchmark) who are either at tariff risk to increase their costs of goods sold if they have supply chains going through newly tariffed countries, or from less purchasing power of consumers for their goods if tariff costs are passed on more generally to them.

Non-U.S. companies in our Global Funds, mostly European and U.K. businesses, if they sell into the U.S. may also find they are able to sell less volume or see margins squeezed as a result of the new tariffs.

It also means businesses impacted by tariffs are likely to pull back on capital expenditure and hiring until they know where the tariff end state is likely to be. There is a wide range of scenarios from a more mild increase to inflation and decrease to economic growth and corporate earnings in the U.S. – in which case the bottom of this sell-off has likely been seen – to something more sinister like a U.S. recession this year and stall growth globally.

We are not making a big bold tariff or macroeconomic call either way. We have been around for long enough to know that is not where our edge in investing is. And it’s been proven time and again for those who think it is that the vast majority have no edge here. Famed economics professor Paul Samuelson’s great quote “the stock market has predicated nine out of the last five recessions” is ringing in our ears. Even the economics team at Goldman Sachs suffered some recession call whiplash – dropping it 73 minutes after declaring it (story here).

We always want to let our bottom-up stock picking do most, if not all of the talking.

That said we have been making some incremental changes to portfolio positioning in reaction to what has been happening over the last 2-3 months, without making any big heroic forecasts. In response to evidence of slowing U.S. growth and tariff risks we have been positioning a little more defensively in our Global funds. Some of the key ways we have done this, for example, is through cutting exposure to stocks in the cyclical Consumer Discretionary sector and increasing exposure to those in the more defensive Health Care sector. These generally haven’t been in new names but rather by moving the weights in existing companies that we do like. From February onwards we’ve also deliberately adjusted upwards the Cash allocation in the Global Funds from less than 5% to closer to 10%.

All-in-all this has seen the so-called “beta” of the Global Opportunities Fund as an example reduce from 1.15-1.2 down to around 1.05. (Note: beta measures the sensitivity of the returns of the stocks in the Fund aggregated up to the portfolio level compared to the market. A Beta of 1 for example means that a Fund has average market risk).

Source: Bloomberg

We have also been careful to limit binary direct tariff risk to stocks in our funds as we don’t want President Trump’s thoughts on tariffs to be the primary determinant of whether we outperform or underperform.

Some hope ahead

This month’s Letter has mostly covered all the risks that the U.S.’s approach to tariff policy have introduced to the global economy and markets. And to be sure we still don’t know the final outcome. But one reason for optimism over the next few years comes from the below table.

The VIX index, or more formally the CBOE Volatility Index, which measures the market’s expectation of volatility for the S&P 500 over the next month recently broke through 50. This index is often called the “fear gauge” as it shoots up when investors get panicky.

In calm times it spends most of its day relaxing around the 10-15 level. Very very rarely does it get above 50, like it did on the 8th April this year. Historically it’s been a good contrarian indicator for when to invest. As Buffett says, “be greedy when others are fearful, and fearful when others are greedy”.

Source: Creative Planning

Every time the VIX has closed above 50, S&P 500 returns have been positive over the next 1-5 years. Also, the average 1 year return is 35%, far higher than the average 12% returns earned when investing while the VIX is below 50. Does this guarantee success? No. All of these periods were during the GFC (2008/09) or COVID (2020). But getting scared away when markets have fallen is more than likely the wrong thing to do. It’s trite but true: time in the market beats timing the market.

We have chosen to mitigate as best we can some direct tariff risk through analysing our portfolio company’s supply chains and making a small number of changes where those risks were too high. We have also incrementally dialled back the risk a little in our Global Funds, increasing our allocation to more defensive growers that are less reliant on strong economic growth globally.

To us, this, along with staying invested, remains the best course of action. Share markets have weathered worse trade wars before, and they will do so again.

In times of market uncertainty I always remind friends of my favourite Buffett quote: “In the 20th century, the United States endured two world wars and other traumatic and expensive military conflicts; the Depression; a dozen or so recessions and financial panics; oil shocks; a flu epidemic; and the resignation of a disgraced president. Yet the Dow rose from 66 to 11,497.” Back the productive capability of good businesses. It wins time and again.

As always, thank you for entrusting your capital with us.

Kindest regards,

Andrew Mitchell & Steven Ng

Co-Founders & Senior Portfolio Managers

Ophir Asset Management

This document has been prepared by Ophir Asset Management Pty Ltd (ABN 88 156 146 717, AFSL 420082) (“Ophir”) and contains information about one or more managed investment schemes managed by Ophir (the “Funds”) as at the date of this document. The Trust Company (RE Services) Limited ABN 45 003 278 831, the responsible entity of, and issuer of units in, the Ophir High Conviction Fund (ASX: OPH), the Ophir Global Opportunities Fund and the Ophir Global High Conviction Fund. Ophir is the trustee and issuer of the Ophir Opportunities Fund.

This is general information only and is not intended to provide you with financial advice and does not consider your investment objectives, financial situation or particular needs.  You should consider your own investment objectives, financial situation and particular needs before acting upon any information provided and consider seeking advice from a financial advisor if necessary. Before making an investment decision, you should read the relevant Product Disclosure Statement (“PDS”)  and Target Market Determination (“TMD”) available at www.ophiram.com or by emailing Ophir at ophir@ophiram.com. The PDS does not constitute a direct or indirect offer of securities in the US to any US person as defined in Regulation S under the Securities Act of 1993 as amended (US Securities Act).

All Ophir Funds are deemed high risk within their respective Target Market Determination documentation.  Ophir does not guarantee the performance of the Funds or return of capital.  An investment may achieve a lower than expected return and investors risk losing some or all of their principal investment.  Past performance is not a reliable indicator of future performance.  Any opinions, forecasts, estimates or projections reflect our judgment at the date of this information and video was prepared, and are subject to change without notice.  Rates of return cannot be guaranteed and any forecasts, estimates or projections as to future returns should not be relied on, as they are based on assumptions which may or may not ultimately be correct.

Actual returns could differ significantly from any forecasts, estimates or projections provided.

The Trust Company (RE Services) Limited is a part of the Perpetual group of companies. No company in the Perpetual Group (Perpetual Limited ABN 86 000 431 827 and its subsidiaries) guarantees the performance of any fund or the return of an investor’s capital.


Previous

13 Mar, 2025 Letter To Investors - February 2025

Next

1 May, 2025 Press - How Australia’s best small-cap fund got its 39.6pc return
13 Mar, 2025

Letter To Investors - February 2025

Letter to Investors • 14 mins read

Back to Insights Back to Insights

Download PDF

What causes market corrections – and are we due for one now?

  • Trump’s policy uncertainty, particularly around tariffs, has soured investor sentiment and helped unwind 2024’s market themes including the Magnificent 7
  • Small and growth stocks underperformed in February, which our Global Funds offset by getting earnings calls right in the recent reporting season
  • With the S&P 500 down -9% (at writing from highs) investors are fretting about whether this is a correction or the start of a bear market
  • We examine the history of corrections and find 3 major causes that can help investors define the likely severity of a sell-off
  • We also explore which sectors and factors provide investment safe havens for investors during sharp corrections
  • Despite the recent sell-off, we find there is some evidence to suggest this ‘correction’ could be short and shallow, providing investors with a window of opportunity

After January’s rally, global share markets (with the notable exception of European and Chinese share markets) took a step back in February, a dynamic that continued into March at writing.

Despite a generally solid February Q4 reporting season out of the U.S., markets are starting to get fed up with the new Trump Administration’s policy uncertainty.

Tariffs remain front and centre here with everyone still guessing about their ultimate motivation and extent. Are they to stem illegal immigration and fentanyl? To raise U.S. government revenue to pay for tax cuts? Are they just on Canada, Mexico and China? What is the tariff rate? When do they take effect? The possibilities go on and on!

When these questions go unanswered, or are changed or delayed daily or weekly, companies and consumers unsurprisingly respond by reducing their activity until uncertainty is resolved.

The changing political and policy uncertainty has soured investor sentiment and helped turn many of the market themes from 2024 on their head in 2025.  Last year’s outperformance of the Mag7, U.S. share market, and momentum and growth factors have now given way to European, value and defensive stock leadership.

Small cap underperformance has continued, though, with the Russell 2000 down over -5% in February, only edged out by the Japanese share market (Nikkei) as the worst performers in the month.

February 2025 Ophir Fund Performance

Before we jump into the Letter, we’ve provided a detailed monthly update for each of the Ophir Funds below.

The Ophir Opportunities Fund returned +1.3% net of fees in February, outperforming its benchmark which returned -2.8%, and has delivered investors +23.0% p.a. post fees since inception (August 2012).

Ophir Opportunities Fund Factsheet

The Ophir High Conviction Fund (ASX:OPH) investment portfolio returned -2.5% net of fees in February, outperforming its benchmark which returned -3.7%, and has delivered investors +13.7% p.a. post fees since inception (August 2015). ASX:OPH provided a total return of +5.6% for the month.

Ophir High Conviction Fund Factsheet

The Ophir Global Opportunities Fund (Class A) returned -1.9% net of fees in February, in line with its benchmark which returned -1.9%, and has delivered investors +17.4% p.a. post fees since inception (October 2018).

Ophir Global Opportunities Fund (Class A) Factsheet

The Ophir Global Opportunities Fund (Class B) returned +0.2% net of fees in February, underperforming its benchmark which returned +0.4%.

Ophir Global Opportunities Fund (Class B) Factsheet

The Ophir Global High Conviction Fund (Class A) returned -2.3% net of fees in February, underperforming its benchmark which returned -1.9%, and has delivered investors +13.1% p.a. post fees since inception (September 2020).

Ophir Global High Conviction (Class A) Fund Factsheet

The Ophir Global High Conviction Fund (Class B) returned -2.2% net of fees in February, underperforming its benchmark which returned -1.9%, and has delivered investors +25.1% p.a. post fees since inception (June 2023).

Ophir Global High Conviction (Class B) Fund Factsheet


Asset Returns – February 2025

Source: JP Morgan

Despite the Ophir team having a great Q4 reporting season, with our Global Funds in February getting our earnings calls right, it didn’t really show up on the scoreboard for the month, with both funds down around -2%, similar to our benchmark.

As a small cap growth-orientated investor this was because, within our SMID (small/mid) cap benchmark, mid-caps outperformed small caps, and value stocks outperformed growth stocks during the month.

Source: Bloomberg. Data as of 28 February 2025.

Those stocks with price momentum – which we typically have some exposure to as we’re looking for those companies doing well and outperforming the market’s growth expectations – were sold off hard, too, in February.

While this might have seen us ‘swimming upstream’ during the month, as we’ve stated many times before: if you get the earnings right – which we did during the reporting season –the share price performance will ultimately look after itself long term.

A history of U.S. drawdowns

With the S&P 500 down just over -8% from its all-time high in February, many investors are asking whether this is a correction (a >10% fall), or is there a bear market (a >20% fall) around the corner for the U.S.? And given the U.S.’s dominance, a bear market for global shares?

As we show below for the S&P 500 (since the mid 1960s) and the Russell 2000 (since the late 1970s), there have been plenty of falls greater than -10% and -20%, with even the odd fall of more than -30% or -40%. The only fall greater than -50% during this period was the gut-wrenching GFC.

Source: Ophir. Bloomberg.

Many of the biggest drawdowns (peak-to-trough falls) were associated with U.S. recessions, including those in the early and mid 70s, the ‘81/82 recession, the ‘90/91 recession, the Dot.com Bubble with its early 2000s recession, and of course the 2008/09 GFC, as well as the brief Covid-19 recession in 2020.

The benefits of understanding corrections

Why care about understanding market corrections in the first place?

One obvious answer is: knowing what tends to cause corrections might help you avoid them. But, despite thousands of studies and books trying, it is very difficult, or perhaps even impossible, to identify corrections ahead of time with sufficient accuracy to be useful.

While you may not be able to time a correction by going into or out of cash, if you understand what causes corrections you can identify when you are in the ‘danger zone’; where a correction is more probable. You then may be able to mitigate some of the fall by skewing your portfolio to companies with stronger fundamentals and less risk.

Knowing what caused a correction can also help you can understand what will likely stabilise it and trigger a market rebound.

The three causes of corrections

In the table below our friends at Piper Sandler have categorised every U.S. share market correction greater than -10% going back to 1964. There have been 27 of them! Or about one every 2.2 years.  (Get used to them long term investors!)

Source: Piper Sandler.

As you can see, most of the deepest falls are associated with recessions. The 1987 Crash, and the 2022 fall courtesy of the rapid hiking of interest rates by the U.S. Fed, are key exceptions.

Importantly, most corrections are driven overwhelmingly by valuations (price to earnings ratios) shrinking as risk aversion increases, rather than corporate earnings falling off a cliff.

Each correction can be grouped into three main causes:

  1. High interest rates
  2. Higher unemployment
  3. Exogenous global shocks (such as the Asian Financial Crisis or Euro Debt Crisis)

Of course some of these can overlap and have other intertwined causes, but there is usually one of these three causes that stands out as the major reason the correction starts and ends.

History shows that not all correction causes are created equal

The most important insight history tells us is that the cause of the correction will go a long way to explaining how deep and long it is.

The six charts below are great ones to commit to any investor’s memory bank.

S&P 500 Drawdowns Peak to Trough

S&P 500 Drawdowns Duration (Weeks)

Source: Piper Sandler.

They tell us that:

  1. Higher rates have historically caused, and lower rates ended, the most corrections (52% of them), followed by higher unemployment (30%) and global shocks (18%). However, since inflation targeting was introduced in the U.S. in the 1990s, inflation and hence interest rates have been less volatile and caused fewer market corrections.
  2. Those corrections associated with job losses should be the most feared because they typically see the largest falls (-36% on average) and last the longest. This is probably because they are the most likely to see corporate earnings fall the most, alongside valuation falls.
  3. Those corrections based on exogenous global shocks tend to be the ‘best’, with similar average falls to those caused by higher rates (around -16%), but global shock corrections tend to be shorter lived.

While rising interest rates or unemployment might indicate a correction is ahead, getting the timing right is always difficult because markets are forward looking and the correction may begin when market participants EXPECT rates or unemployment to increase, before they actually do. It can still be useful though to understand the cause, because when rates or unemployment stabilise that can signal that the correction may be coming to an end, with a rebound to follow.

Almost by their very definition, exogenous global shocks are unpredictable, but at least their resolution can provide some guidance on what the market needs to see before it recovers.

How different sectors perform in corrections

Perhaps the most useful part of this history lesson is understanding which parts of the market do better when staying invested during a market correction. (And staying invested will be the best outcome for most investors.)

Here the evidence is pretty clear, though not infallible. First, at a sector level, during a market correction the sectors that tend to perform better provide more stable, reliable and defensive revenue and earnings.

Which ones are they?

Typically, Real Estate, Health Care, Consumer Staples and Utilities.

Each has, on average, outperformed the U.S. share market as a whole during the 15 market corrections that we have data for going back to 1990.

Each also has an 80% or better ‘Hit Rate’ – that is, they have outperformed the market in at least 4 out of every 5 corrections.

What do these sectors have in common?

Their revenues and earnings tends to fluctuate less, generally because consumers don’t cut spending on them easily (everyone has to pay their utilities, grocery or doctors bills). They can therefore provide something that is prized in market uncertainty: more certain returns to their shareholders.

Source: Piper Sandler.

The type of stocks (‘factors’) that outperform in sell-offs

But investment ‘factors’ are better guideposts for investing during corrections than Sectors. (Factors is just a fancy investment term for common characteristics of different stocks.)

So, what are the best and worst factors during market corrections?

Source: Piper Sandler.

The table above shows that during corrections there are a few types of stocks that tend to underperform:

  • Those with more volatile share prices compared to the market (so called higher Beta)
  • Those with volatile revenues; and
  • Smaller stocks.

By contrast, stocks with higher-quality cash flows, less debt and less volatile prices outperform.

It’s perhaps unsurprising that when markets are falling a lot, investors favour those businesses they can be more certain of their fundamentals and their share prices.

Important Point: While smaller companies tend to fall more during market corrections, the key exception to this in the table above is the 2000 to 2002 Dot.com-related market falls, where smaller companies significantly outperformed. This period shares some similarities to today where U.S. small caps have been the cheapest compared to large caps since the Dot.com Bubble. This was a key reason 25 years ago U.S. small caps fell less – they started from much cheaper valuations.

Where does that leave us today?

With the U.S. share market on the precipice of a correction (>-10% fall), it seems U.S. tariffs are the most likely cause of the drop and would fall in the ‘global exogenous shock’ bucket.

Neither interest rates nor unemployment has moved higher in the last few weeks to cause the sell-off. In fact, the most recent move in both short and long-term interest rates in the U.S. has been down.

It remains a risk, though, as tariffs are inflationary. So, it can’t yet be ruled out that the Fed may need to reverse course and hike rates as a result.

The U.S. unemployment rate has been moving up from its low in 2023, but this isn’t a new occurrence, and it is still near multi-decade lows.

If history is any guide this is good news because, as we’ve seen, exogenous shocks tend to see smaller market falls that recover more quickly.

Investors need to watch, however, that tariffs and policy uncertainty in general in the U.S. don’t morph into something more sinister like a recession, which would see job losses and a likely further fall in the share market. For now, though, this doesn’t seem the most likely outcome as the typical recession precursors like rising interest rates and lax credit conditions are absent.

We don’t even know if the U.S. share market will enter a correction at this stage.

At Ophir, we always remain bottom-up stock pickers first and foremost.

This is ultimately where our ‘edge’ lays, and what has driven the vast majority of our outperformance over the long term. Though from a portfolio management perspective we are not ignoring the lessons of history about what sectors and factors tend to do well during share market sell-offs.

We see this as just part and parcel of prudent management of ours, and our investors’ capital.

As always, thank you for entrusting your capital with us.

Kindest regards,

Andrew Mitchell & Steven Ng

Co-Founders & Senior Portfolio Managers

Ophir Asset Management


This document is issued by Ophir Asset Management Pty Ltd (ABN 88 156 146 717, AFSL 420 082) (Ophir) in relation to the Ophir Opportunities Fund, the Ophir High Conviction Fund and the Ophir Global Opportunities Fund (the Funds). Ophir is the trustee and investment manager for the Ophir Opportunities Fund. The Trust Company (RE Services) Limited ABN 45 003 278 831 AFSL 235150 (Perpetual) is the responsible entity of, and Ophir is the investment manager for, the Ophir Global Opportunities Fund and the Ophir High Conviction Fund. Ophir is authorised to provide financial services to wholesale clients only (as defined under s761G or s761GA of the Corporations Act 2001 (Cth)). This information is intended only for wholesale clients and must not be forwarded or otherwise made available to anyone who is not a wholesale client. Only investors who are wholesale clients may invest in the Ophir Opportunities Fund. The information provided in this document is general information only and does not constitute investment or other advice. The information is not intended to provide financial product advice to any person. No aspect of this information takes into account the objectives, financial situation or needs of any person. Before making an investment decision, you should read the offer document and (if appropriate) seek professional advice to determine whether the investment is suitable for you. The content of this document does not constitute an offer or solicitation to subscribe for units in the Funds. Ophir makes no representations or warranties, express or implied, as to the accuracy or completeness of the information it provides, or that it should be relied upon and to the maximum extent permitted by law, neither Ophir nor its directors, employees or agents accept any liability for any inaccurate, incomplete or omitted information of any kind or any losses caused by using this information. This information is current as at the date specified and is subject to change. An investment may achieve a lower than expected return and investors risk losing some or all of their principal investment.  Ophir does not guarantee repayment of capital or any particular rate of return from the Funds. Past performance is no indication of future performance. Any investment decision in connection with the Funds should only be made based on the information contained in the relevant Information Memorandum or Product Disclosure Statement.

Previous

27 Feb, 2025 Keeping you in the AIR

Next

17 Apr, 2025 Letter to Investors - March 2025