Shares live to die another day
In this Letter to Investors, we look at:
- Why a US 10-year bond yield at levels last seen in 2002 (the year Bond movie Die Another Day hit the big screen) left the share market shaken, but still standing.
- Whether the recent bond yield spike is a sell signal. To find out, we look at how US shares, including small caps, performed the last 27 times bond yields jumped this much in a quarter.
- Why rock-bottom small-cap valuations suggest now is not a good time to trim exposure to smaller companies, despite the macro backdrop.
- And why today’s highly concentrated market – with 42% of the US market in 10 AI stocks – is another positive sign for future small-cap performance.
- Plus, an impressive month for the Ophir Opportunities Fund (+6.0% ahead of its benchmark), and a rare stock selection miss for our Global Funds.
In the 2002 blockbuster Die Another Day, Pierce Brosnan’s James Bond is captured by North Korean forces, who torture him for 14 months before trading him back to MI6.
He survives (of course!) and lives to die another day.
In September, the US 10-year Treasury yield rose +54 basis points to 5.29%, its biggest monthly jump in four years and its highest level since 2007.
By the first week of October, it had pushed above 5.35%, a level last seen in 2002.
Bond yields are the price of money. They therefore have a vital impact on equities, whose intrinsic value is the “discounted value of future cash flows”. The rate used to discount future cash flows ties back, at least in part, to government bond yields.
When yields rise this fast, you might be forgiven for thinking shares should get whacked. And yet the headline indices barely flinched in September. The S&P 500 slipped just -0.3% and finished the month a touch over 1% below its all-time high. The Nasdaq Composite rose +1.9%.
Global small and mid caps had a tougher time:
- The MSCI World SMID Cap Index, our global benchmark, fell -4.0% in US dollar terms, though a -3.1% fall in the Australian dollar (to US$0.69) cushioned the blow for unhedged investors. In Australian dollar terms, the benchmark was down -1.2%.[1]
- US small caps were particularly weak. The Russell 2000 fell -5.3%, its worst month since the March 2025 tariff selloff.
But there was no escaping the fact that share markets in aggregate, like James Bond, lived to die another day.
How our Funds fared
Against this backdrop, September was a good month for our Aussie Funds and a frustrating one for our Global Funds:
- The Ophir Opportunities Fund returned +3.7% net of fees against -2.3% for its benchmark, an outperformance of +6.0%. (Since inception in August 2012, the Fund has returned +22.7% per annum after fees.)
- The Ophir High Conviction Fund returned -1.2% net of fees, +1.7% ahead of its benchmark’s -2.9%. The ASX-listed units (ASX: OPH) returned -2.5%.
- The Ophir Global Opportunities Fund returned -3.1% net of fees against -1.2% for its benchmark, the MSCI World SMID Cap Index (NR, AUD), an underperformance of -1.9%.
- The Ophir Global High Conviction Fund returned -2.1% net of fees, -0.9% behind the same benchmark.
For the first time in a long while, the Global Funds’ underperformance came from stock selection (the selection effect – the portion of performance attributable to our skill in choosing specific stocks – was -2.3% for the Global Opportunities Fund) rather than from factor headwinds.
About half of the underperformance came from a single holding whose share price fell sharply after a large shareholder sold down, even though its sales and earnings are tracking just fine.
September falls outside reporting season, so we don’t read too much into it, but a fall like that always makes us prick up our ears. The good news is that over the past year the Global Opportunities Fund’s selection effect is +13.4%, the picture we are used to.
Bond. Treasury Bond. The September ‘catch up’
So why did US bond yields rise so rapidly recently?
It started with the Fed.
In mid-September, the Federal Open Market Committee (FOMC) raised the Fed funds rate by +0.25% to a range of 3.75% to 4.00%, its first hike since 2023.
At the time of writing, futures markets are pricing in one more 25 basis point hike this year and a total of 50–70 basis points of tightening by mid next year.
New Fed Chair Kevin Warsh is doing what new Fed Chairs almost always do: acting tough early to earn their inflation-fighting credentials.
We would rather own small caps in a hot economy with a hawkish Fed than in a weak economy that needs rescuing.
And the economy is strong: the US composite PMI (purchasing managers’ index, a monthly survey of business activity), for example, hit 58.4 in September.
The problem is that this strong growth is stoking inflation.
In August, US CPI (Consumer Price Index) was +3.4% year on year. And oil isn’t helping: Brent crude jumped another +14% in September to briefly top US$100 a barrel as hostilities in Iran continued.
Typically, as inflation rises, bond investors want to be compensated with higher yields.
NYU professor Aswath Damodaran (often called ‘the Dean of Valuation’) recently made a useful point here.
He says that over time, the 10-year yield should roughly equal expected inflation plus real growth.
On his numbers, that intrinsic rate was about 5.4% in September. But at the end of August, the actual yield was 4.75%.
So part of September’s jump is simply the bond market catching up with a hot economy and hotter inflation.
The rest is the Fed’s response to that inflation and a global glut of government bonds, and those are the parts that matter for small caps, as we explain below.
French drama
It wasn’t just America. Japan’s 10-year yield hit a three-decade high, UK gilts reached their highest since 2008, and our Aussie 10-year rose +26 basis points to 5.20%.
But the real drama was in France.
The French 10-year yield rose above 4.5% in late September for the first time since 2008 and brushed 5% in early October, its highest since 2002.
France now pays more to borrow than Italy or Greece, and its premium over German Bunds blew out past 1.5%, the widest since the 2011 eurozone debt crisis.
The cause is big debt and deficits, just like in that crisis, as well as political instability and social unrest.
James Carville, Bill Clinton’s political strategist, once said that if reincarnation existed, he’d want to come back as the bond market, “because you can intimidate everybody”. In September, it did.
Do rising bond yields kill share markets? We checked the last 50 years
Which brings us to the No.1 question investors have been asking us recently: with the 10-year yield up 80 basis points in a quarter, should we be selling?
We went back through the data and looked at every occasion since 1976 where the US 10-year yield finished a month at least 60 basis points above where it sat three months earlier. That gives 27 completed episodes, plus the one we’re in now.
But before we jump in, it’s important to remember a bond yield has two parts: expected inflation and the real yield on top of it[2]. Splitting the episodes by driver – inflation or real yields – reveals an important pattern, as we will see.
Every 60bp+ quarterly rise in the US 10-year since 1976
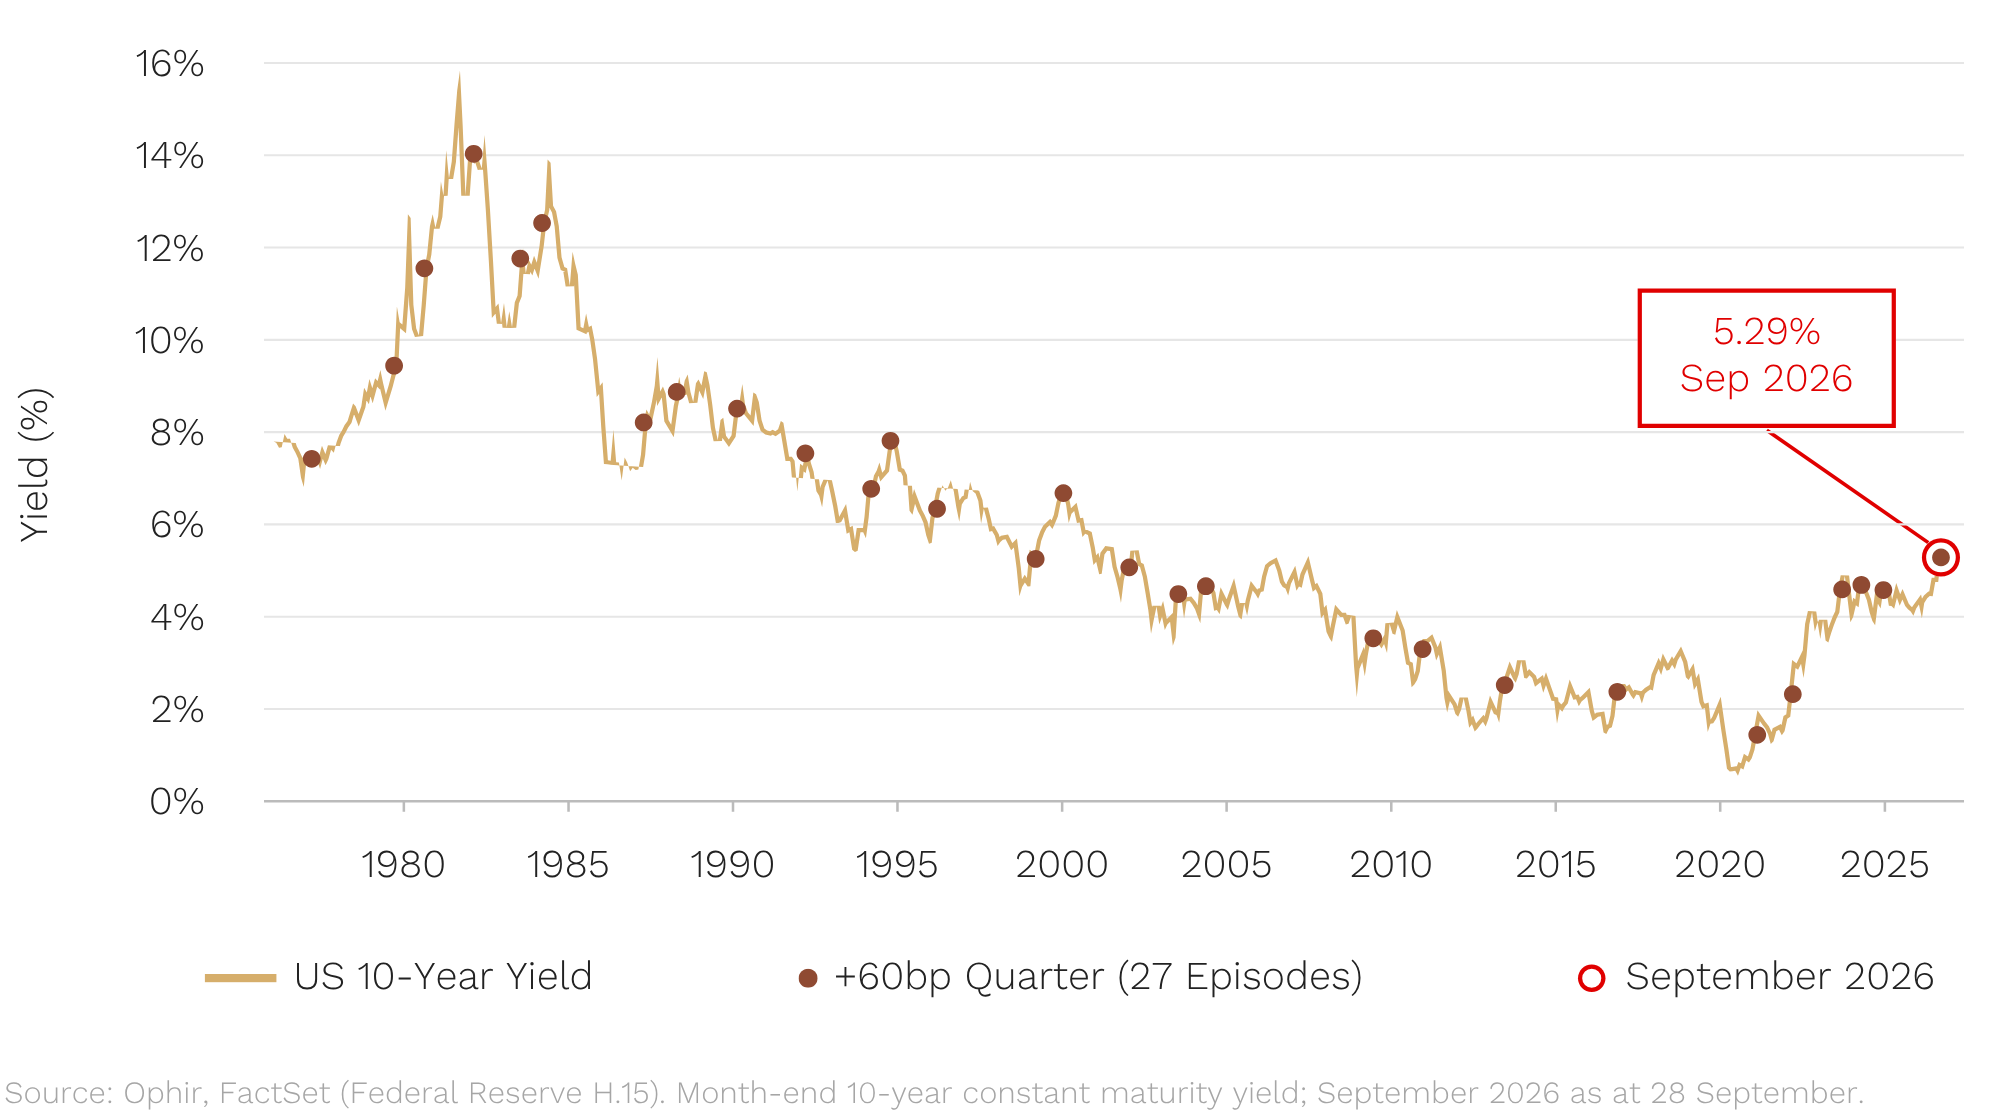
What happens next? The table below shows the US share market return, and the performance of US small caps relative to the market, in every quarter since 1976 when the US 10-year yield rose 60bp or more, and over the 12 months that followed.[3] The shaded rows compare past rises driven by real yields (the bond yield after expected inflation is stripped out) with the quarter we have just been through.
What happened after past bond-yield spikes
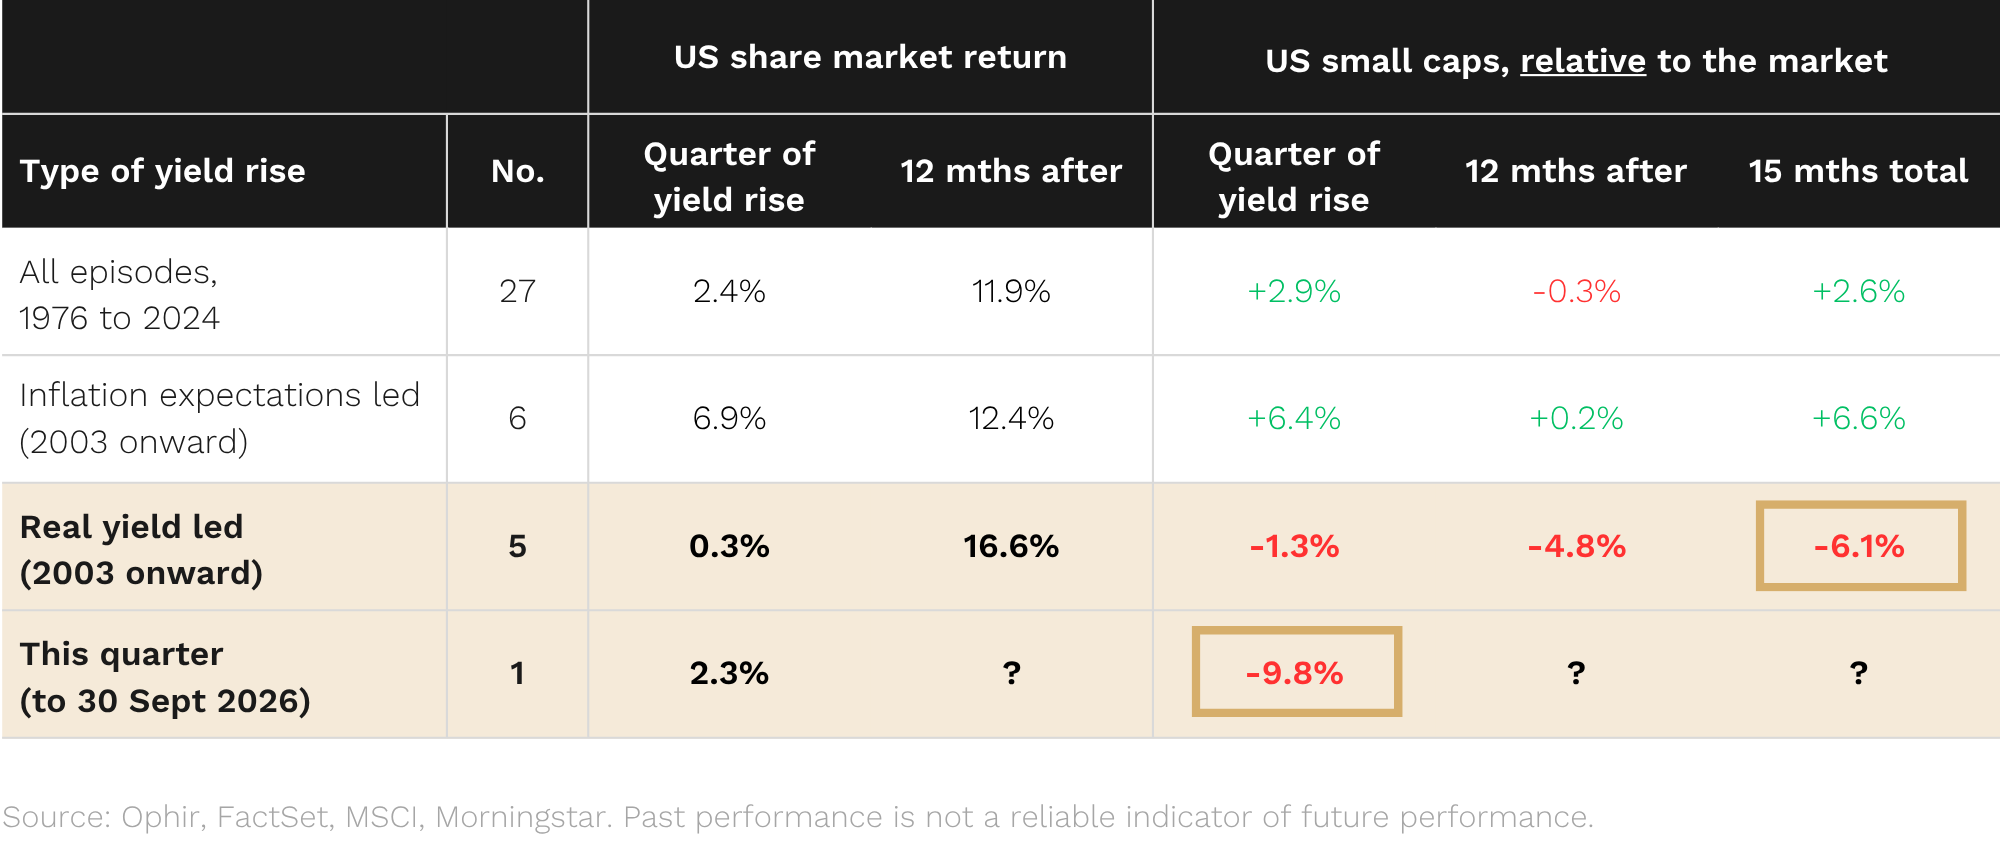
Three things jump out.
-
The market usually shrugs it off.
Across all 27 episodes, the US market was up +2.4% on average in the quarter the yield jumped, and +11.9% in the following 12 months. It was higher a year later in 21 of the 27.
More than three times out of four, selling shares because bond yields had spiked was the wrong call.
Why? While a bond’s coupon – the periodic interest payments – is fixed, a company’s earnings are not. When yields rise because the economy is running hot, earnings usually rise with them, and the only question is whether earnings rise enough to offset the higher discount rate.
This year they have: S&P 500 earnings estimates are up more than 11% for both 2026 and 2027 since January.
-
For small caps, the driver decides.
Over all 27 episodes, the performance of small caps versus the market over the next year was a coin flip. But since 2003, where we can split by driver, a pattern emerges. When inflation expectations drove the rise, small caps beat the market by 6.4 percentage points in the quarter and kept pace afterwards.
When real yields drove it, small caps lagged by 4.8 percentage points over the following 12 months and beat the market in only one of the five episodes.
-
This quarter is real-yield-led, and small caps have already copped it.
In the September quarter, real yields drove about 85% of the move, and small caps have lagged the US market by 9.8 percentage points over that period, far more than in any prior real-yield-driven quarter (the worst was 2.0 percentage points in early 2024).
Small caps have already taken more punishment in three months (-9.8 points) than history says they usually take in 15 (-6.1 points, on average, in past real-yield episodes).
Higher policy rates hit small caps where it hurts. Around 30% of Russell 2000 debt is floating rate, against 7% for the S&P 500. Big companies locked in cheap fixed-rate debt in 2021 and now earn interest on their cash. And about 40% of Russell 2000 companies have no earnings to offset higher interest costs.
Small-company interest bills reprice within a quarter, while big companies’ fixed-rate debt won’t reprice for years.
Does that mean all the pain is priced in?
We’d love to say yes. The straight answer, however, is that the sample is tiny (five episodes, none starting with the 10-year above 4%). Looking back before 2003, the only two rise quarters where small caps lagged this badly point in opposite directions: March 1984 was followed by a further -23% lag, March 1999 by a +21% beat.
What we can say is that more than 90% of our companies are profitable today, and we deliberately exclude companies with high levels of debt, particularly floating-rate debt.
And, most importantly, small caps are cheap!
US small caps trade on just 14x forward earnings
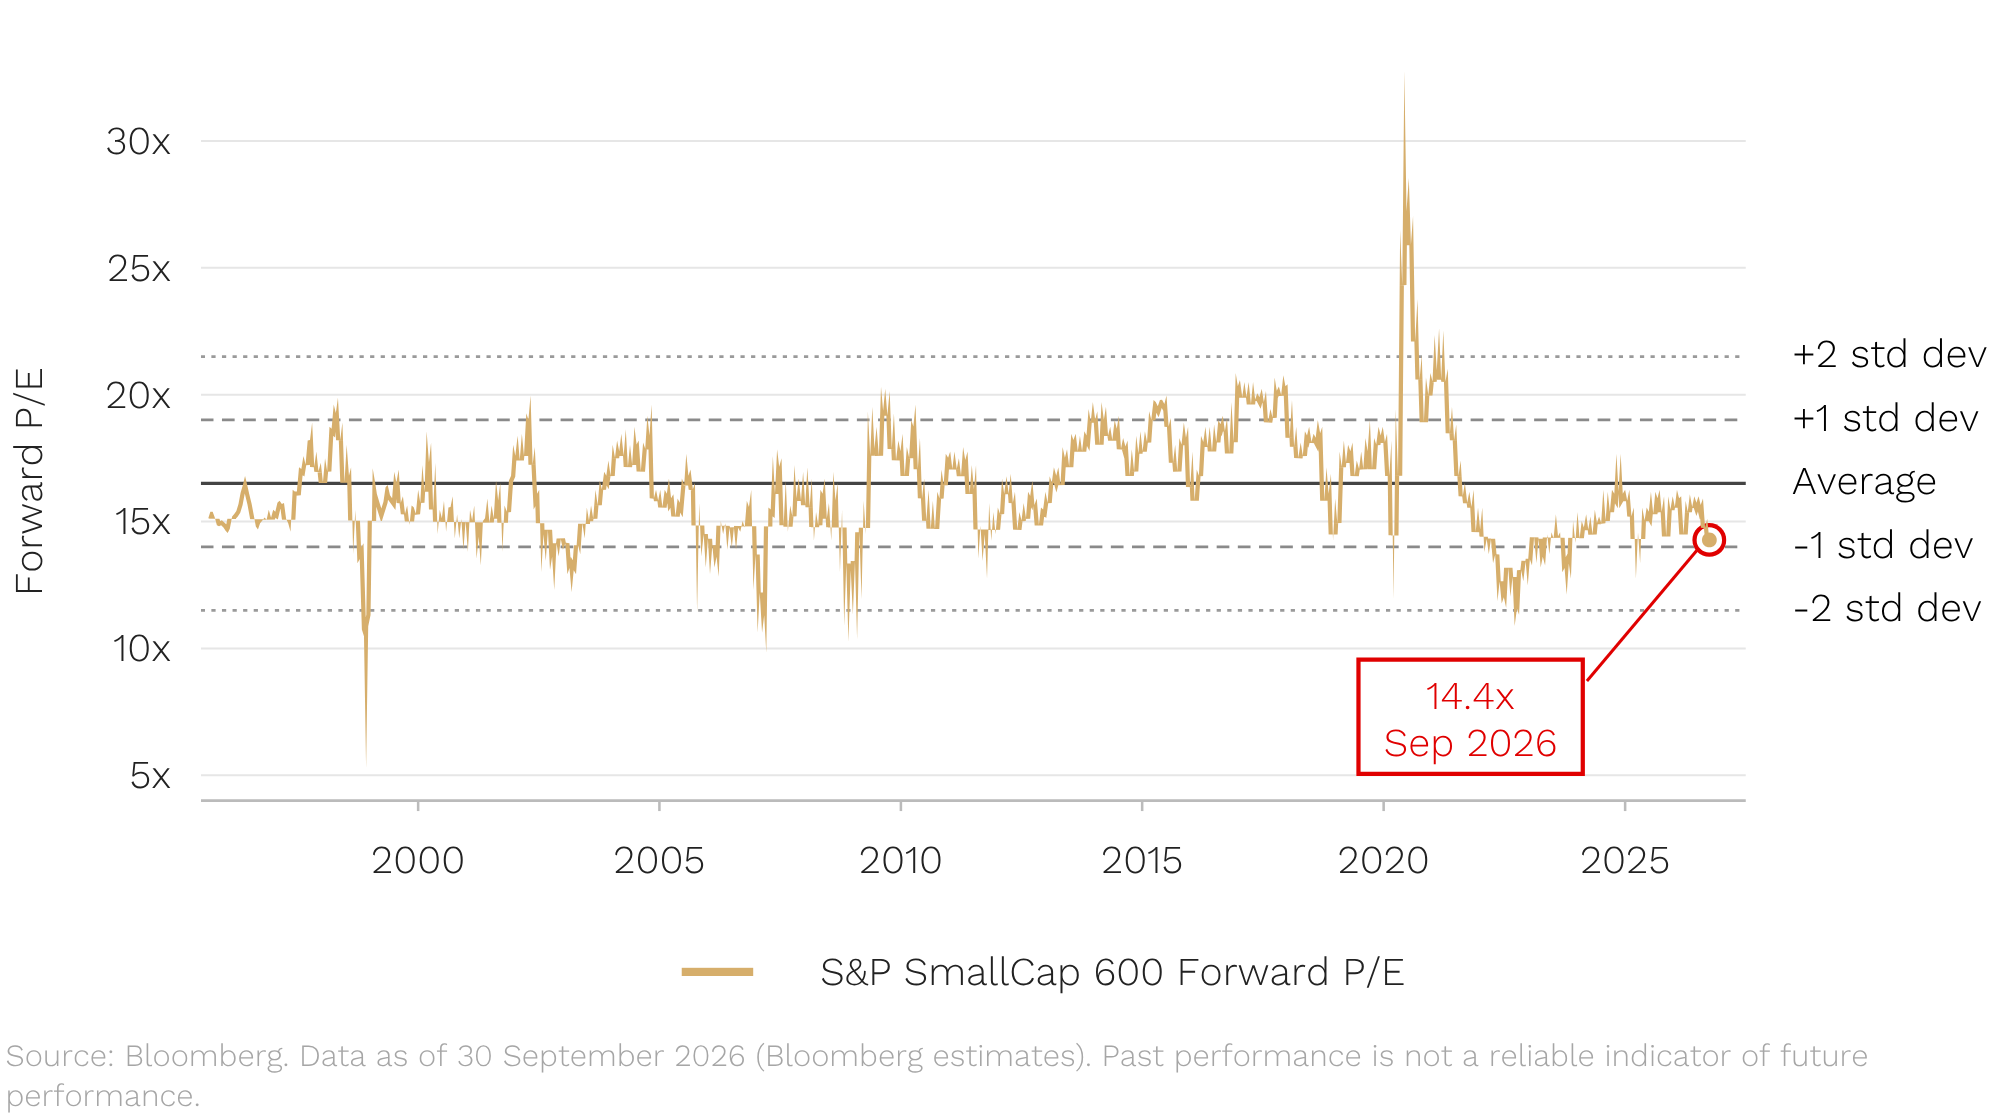
US small caps, in aggregate (roughly 60% of our global benchmark), currently trade on around 14 times one-year forward earnings, against a long-run average of about 17 times. US small caps have been cheaper than that only 12% of the time since 1995.
Regular readers know our mantra: the single best predictor of an asset class’s long-term return is its starting valuation. At 14 times, with earnings estimates holding up (we are yet to see the downward revisions that would really worry us), the odds are in investors’ favour.
Bottom line: history says a jump in bond yields is a reason to check what you own. It has rarely been a reason to sell small caps, and certainly not at today’s valuations.
Ten stocks are carrying the market. What does that mean for small caps?
And one final reason that suggests it’s not time to sell small caps.
When thinking about the market today, the chart below is one we think all investors should keep front of mind.
Peak concentration of the leaders in history’s great bubbles
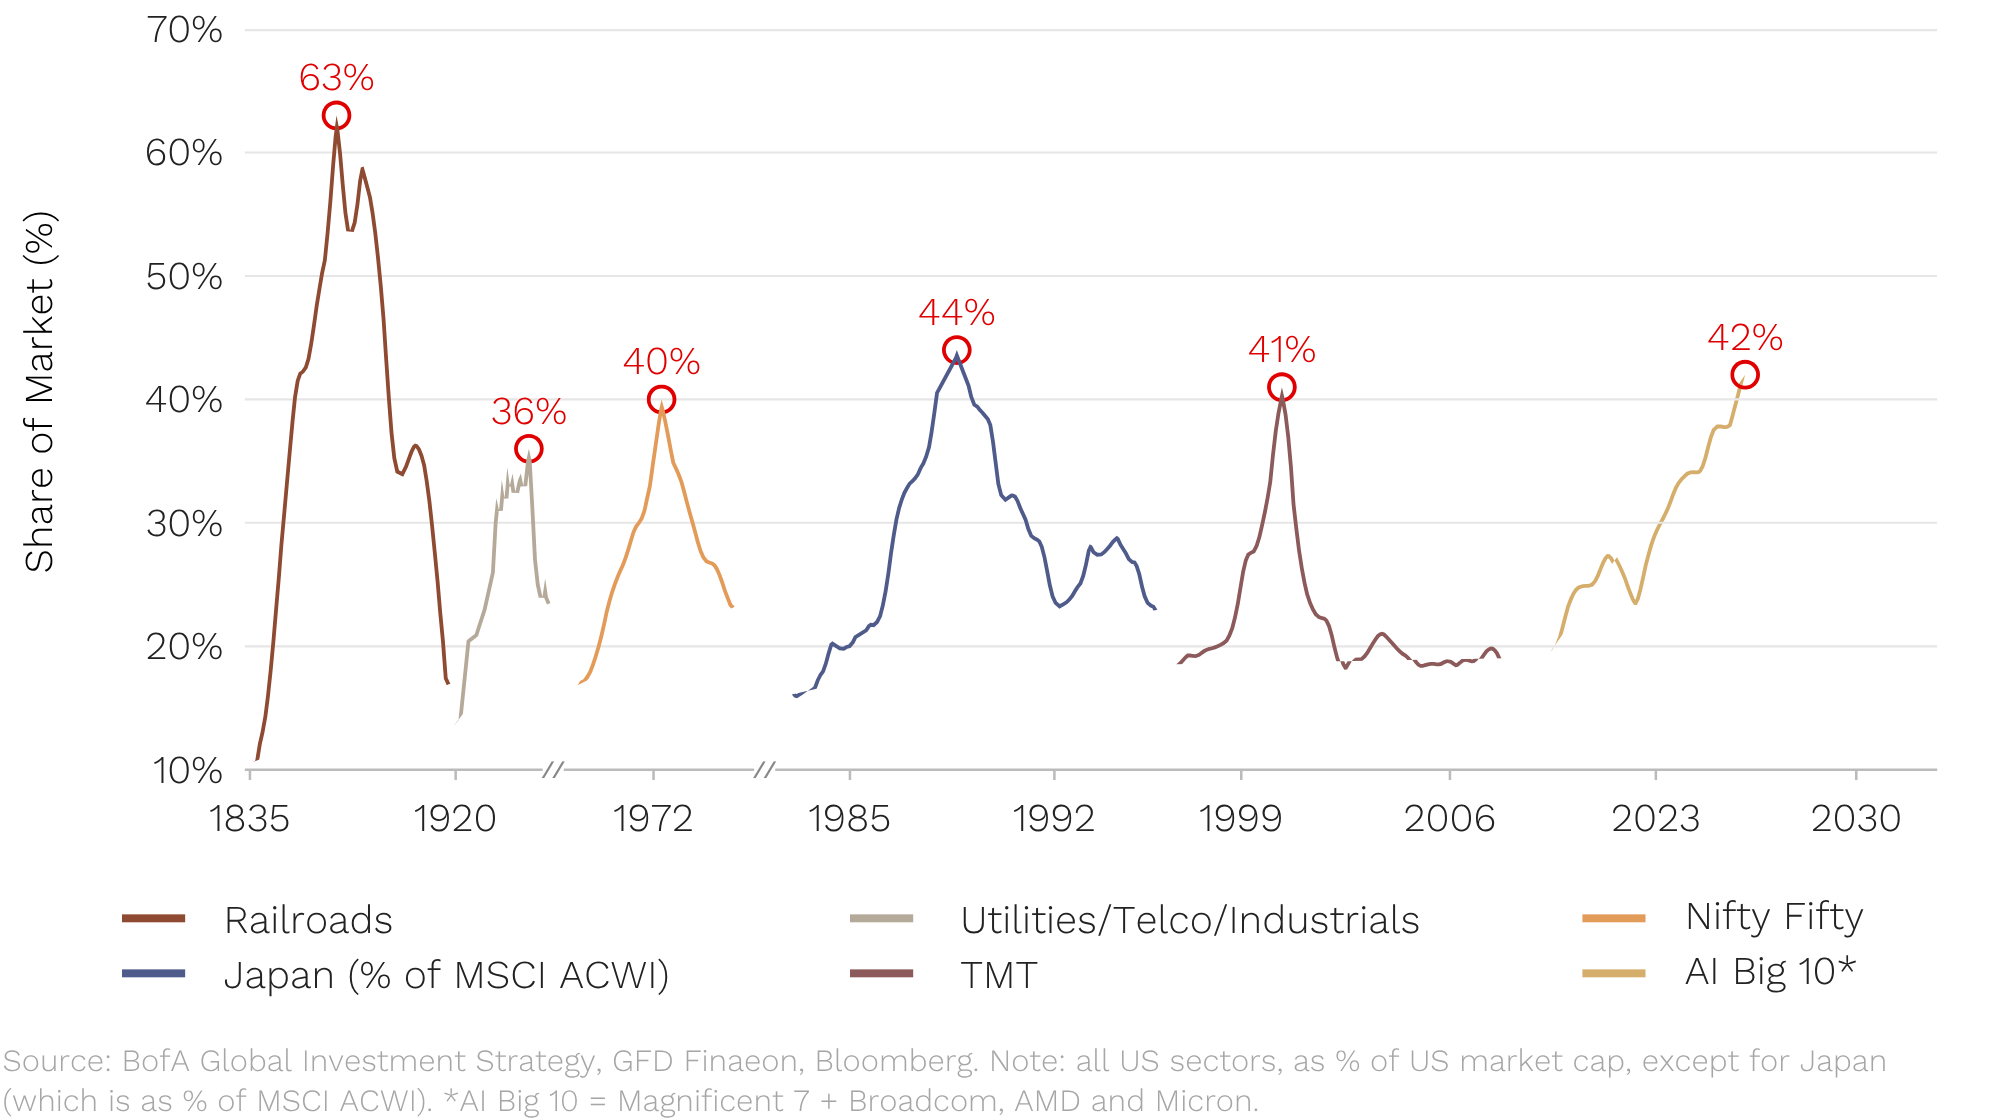
It shows the great bubbles of the past two centuries and what share of the market the leaders reached before the bubble started popping.
The 1920s utilities boom, the Nifty Fifty of the early 1970s, Japan in the late 80s and the dot-com boom in 2000 all peaked when the leaders made up around 40% of the market. The one exception was the railroads in the 1800s, at 63%.
Today, the 10 biggest AI stocks are 42% of the US market. (SpaceX, OpenAI and Anthropic don’t even make the top 10.)
Now, we are not calling the top. That is a mug’s game. What we do know is what happened to everything else on the other side of those peaks:
- After the Nifty Fifty, small caps went on a historic run for the better part of a decade.
- After tech topped in 2000, US small caps beat the S&P 500 in nine of the next ten years, while TMT’s share of the market roughly halved over the next five.
Living to invest another day
September was a month where the bond market intimidated everybody, and the share market lived to die another day. We don’t know whether the 10-year yield has peaked (nor does anyone else!), and in 13 of the 27 episodes above it was lower a year later.
What we do know is that a multiple of 14 times, in a market where earnings are still growing, reflects the kind of pessimism that has historically produced some of our best investment opportunities.
That’s why we’re on the road, meeting companies and digging into their customers, competitors and suppliers. It means long hours away from our families, but it is where our outperformance has always come from.
Bond always comes back for the sequel. After a quarter of underperformance in the US, we think small caps will too.
As always, if you’d like to chat to us about any of the Funds, please feel free to call us on (02) 8188 0397 or email us at ophir@ophiram.com.
Thank you for entrusting us with your capital.
[1] For those investors worried about any further moves in the Australian dollar, our Global Opportunities Fund also has a currency-hedged version available (Factsheet).
[2] The real yield is the yield on US Treasury Inflation-Protected Securities (TIPS). The nominal 10-year yield is the real yield plus expected inflation (the “breakeven” inflation rate). Real yields can only be measured directly from 2003, so the split by driver covers the 11 episodes since then.
[3] Source: Ophir, FactSet (Federal Reserve H.15), MSCI, Morningstar. The US market is MSCI USA from 2006 and the Vanguard 500 Index fund before that; small caps are MSCI USA Small Cap and the Vanguard Small Cap Index fund before that. Total returns in US dollars. Forward windows start at the end of the trigger month. Past performance is not a reliable indicator of future performance.