Welcome to the March Ophir Letter to Investors – thank you for investing alongside us for the long term.
Small Caps vs Large Caps – Don’t be penny wise but pound foolish
The good times kept on rolling for share markets in March, with a sea of green across the world as recession fears in the U.S. continued to fade.
Global equities rose +3.3% (MSCI World (USD)). But this was bested by the UK (+4.8%, FTSE 100), European (+4.4%, Stoxx 50) and Australian (+3.5%, ASX 200) share markets.
U.S. large caps (S&P500) were up strongly (+3.2%), but they were more of a laggard this month, with U.S. small caps (+3.6%) outperforming.
With March largely lacking in company-specific news – as Q4 reporting mostly finished in February – shares took good economic news to be good news for markets.
Leading economic indicators, like Purchasing Manager Indices, inflected higher. There was also continued robust labour market numbers in the U.S. Both suggest a recession is not on the doorstep there.
The number of expected interest rate cuts in the U.S. this year continue to be dialled back. Markets are now forecasting less than two 0.25% cuts at writing – well below the six being forecast at the start of Jan). Bond yields are rising and the share market rally since the recent October market lows has started to broaden out from large caps to smalls and mids.
So are we finally witnessing the start of a long-awaited small-cap revival?
In this month’s Letter to Investors, we examine three key issues:
- What could the catalyst be for a period of sustained small-cap outperformance?
- The worst-case scenario of a U.S. recession. (The good news is that this scenario is largely priced into small caps versus large caps, which will limit small-cap relative downside if the U.S. economy turns south.)
- The extreme valuation difference between U.S. small versus large caps and how history is suggesting great relative returns ahead for smaller companies.
When you put all three together, it becomes clear that small-cap stocks are a very attractive proposition relative to large caps, which is giving investors a rare window of opportunity now to buy into small caps.
March 2024 Ophir Fund Performance
Before we jump into the letter in more detail, we have included below a summary of the performance of the Ophir Funds during March. Please click on the factsheets if you would like a more detailed summary of the performance of the relevant fund.
The Ophir Opportunities Fund returned +8.7% net of fees in March, outperforming its benchmark which returned +4.8%, and has delivered investors +21.9% p.a. post fees since inception (August 2012).
🡣 Ophir Opportunities Fund Factsheet
The Ophir High Conviction Fund (ASX:OPH) investment portfolio returned +6.2% net of fees in March, outperforming its benchmark which returned +4.1%, and has delivered investors +13.5% p.a. post fees since inception (August 2015). ASX:OPH provided a total return of +13.0% for the month.
🡣 Ophir High Conviction Fund Factsheet
The Ophir Global Opportunities returned +2.5% net of fees in March, underperforming its benchmark which returned +3.8%, and has delivered investors +14.8% p.a. post fees since inception (October 2018).
🡣 Ophir Global Opportunities Fund Factsheet
What worked … keeps working
It’s hard to get away from the fact though that what ‘worked’ in 2023, has kept on working so far in 2024.
Below we show this for the U.S., the world’s largest share market (by a country mile!).
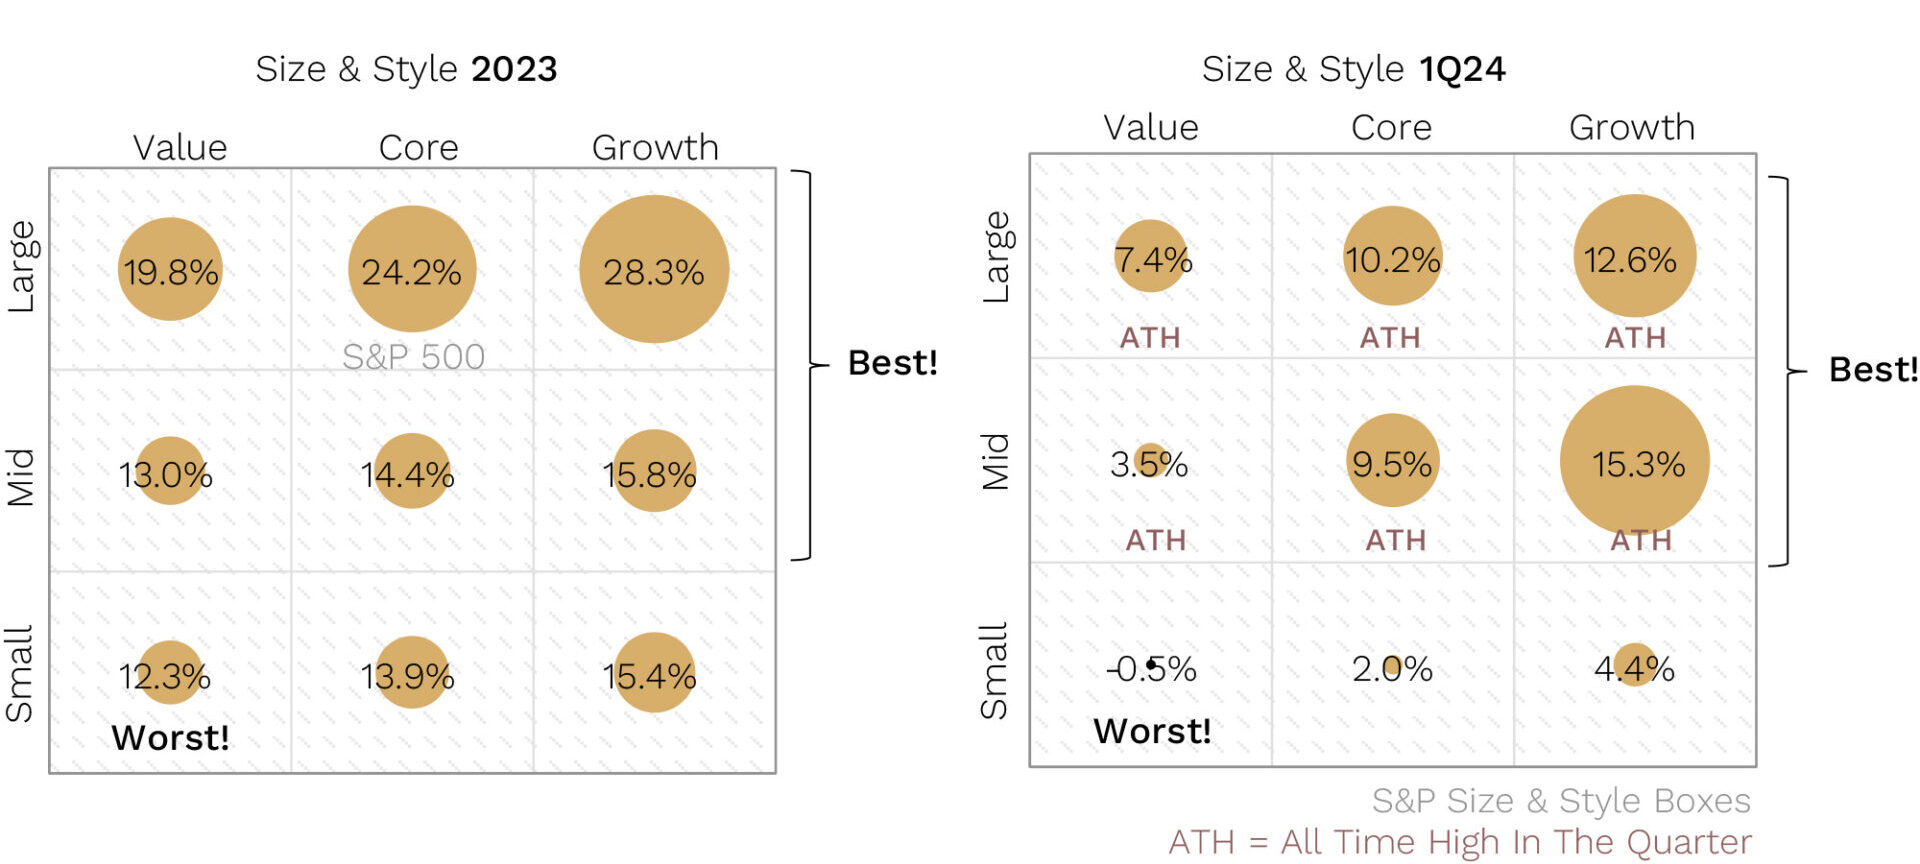
Larger & growthier continued to outpace smaller & value in 1Q24
Source: Piper Sandler
We break down U.S. share market returns into large, mid and small caps, vertically; and Value, Core and Growth style companies, horizontally.
2023 was all about large cap growth style companies leading the way, particularly the mega cap tech ‘Magnificent 7. Meanwhile, small caps and value were definitely laggards.
2024 has started largely the same, though with some more breadth, particularly winners coming from the mid cap growth cohort of businesses.
Interestingly, all large and mid-cap styles hit new all-time highs (ATH) during the March quarter, while small caps remain significantly off their highs.
As a small-cap manager, this continues to be painful for us in a relative sense. But as regular readers will know, small caps are now extremely attractive relative to large and mid cap companies.
What could be the catalyst for small cap outperformance?
The most common question we get from investors who understand why we are so bullish on the outlook for small caps globally versus large caps is: “What is the catalyst for smalls caps to start outperforming?”
Relative valuations at multi-decade lows for small caps (which we address again later in this letter) is one big reason to be bullish over the next 5-10 years.
But cheap relative valuation is not a catalyst.
The standout and most simple catalyst we believe is simply lower interest rates. And, more specifically, ‘soft landing’ rate cuts.
December last year was a great case in point. It was the only sustained period of significant market breadth and small-cap outperformance since the beginning of this most recent share market rally in October.
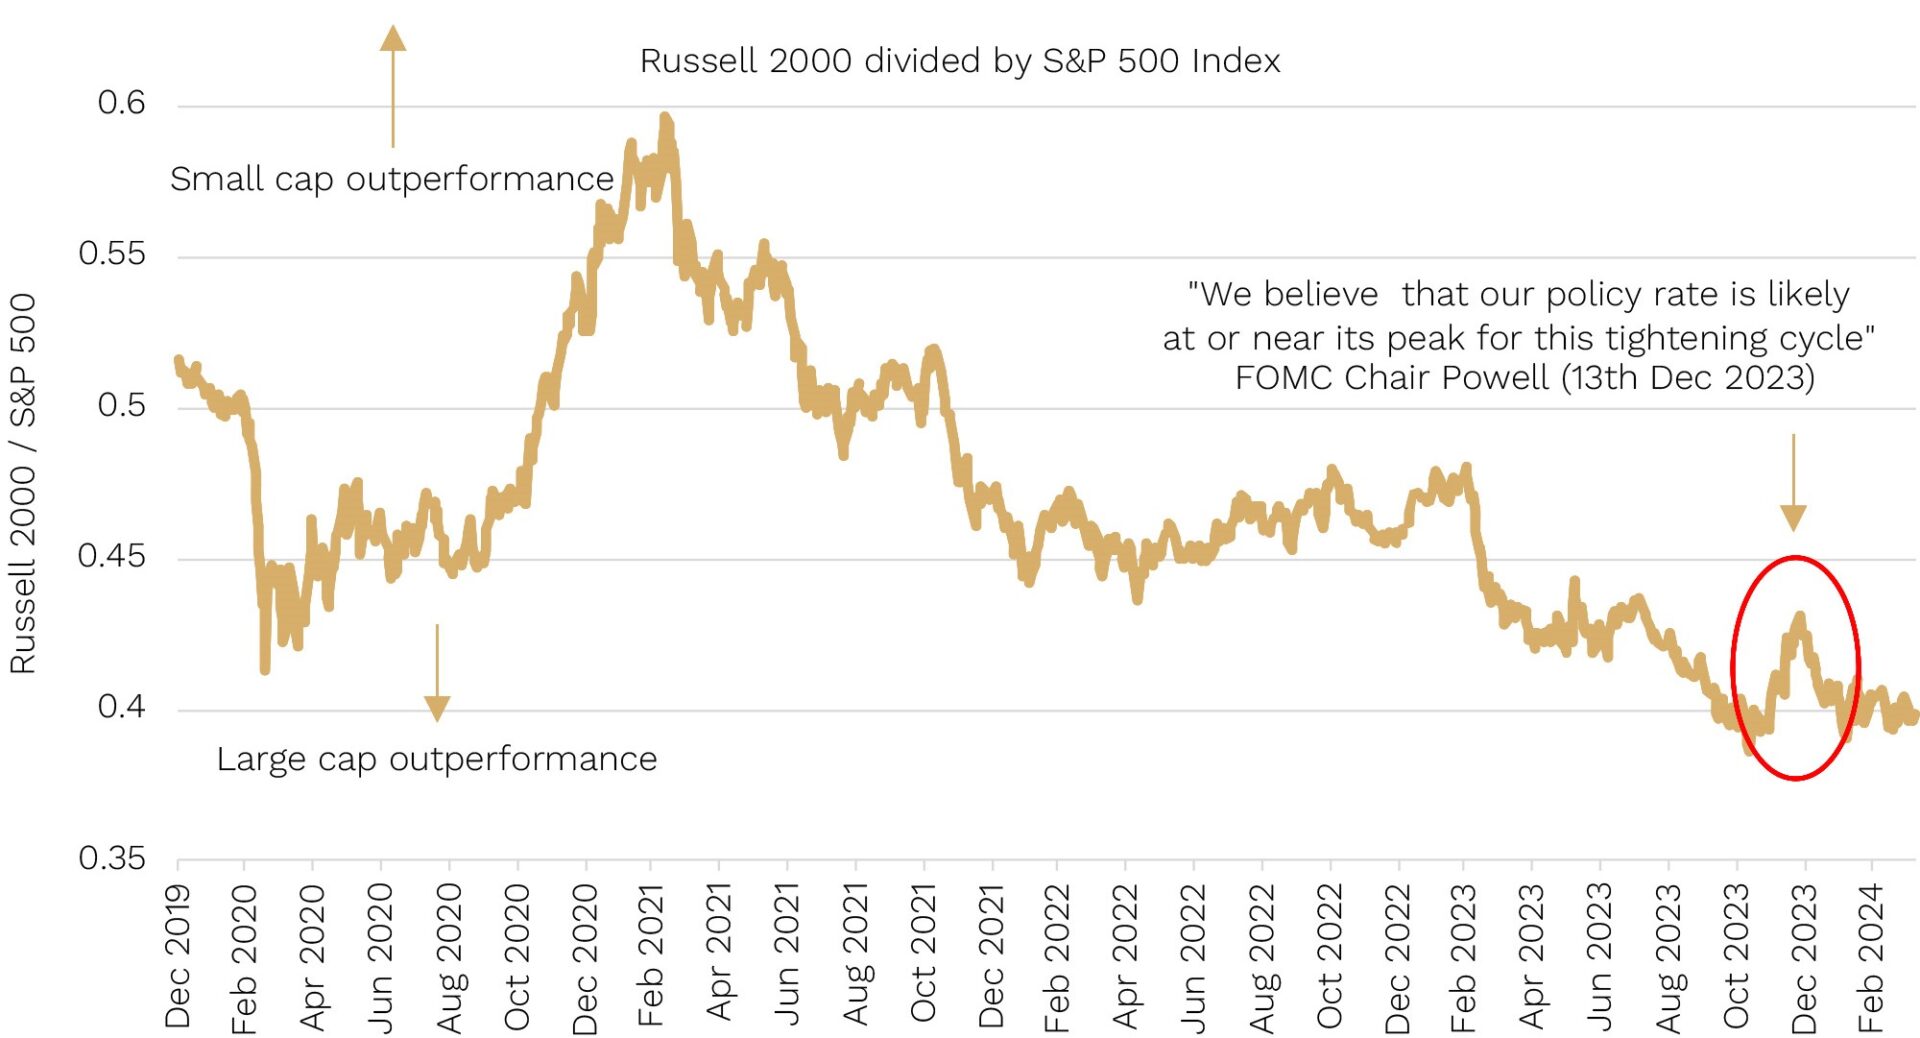
We show this in the chart below which maps the relative performance of U.S. small caps (Russell 2000) to large caps (S&P500).
December 2023 showed market breadth and smalls outperformed on “peak rates/cuts ahead” talk from the Fed
Source: Bloomberg
So what happened in December?
It was when the U.S. Fed said for the first time this hiking cycle that they are likely done increasing rates, and when they predicted in their ‘dot plot’ that meaningful rate cuts where likely in 2024.
The starters gun for rate hikes that was shot back in late 2021 had seemingly been holstered.
The closer we get to the expectation of soft-landing rate cuts becoming a reality (currently forecast by the market in Q3 this year), the closer we may be to small caps having a key catalyst for outperformance.
The natural question then becomes: what if we don’t have a soft landing and US recession fears, which have been lingering for the last 12-18 months, finally becomes a reality?
Small caps’ already big underperformance suggests limited relative downside in a recession
It’s an excellent question because around a recession, small caps typically fall first and further than large caps … but then recover the quickest.
We show this in the gold bars below where, outside of the Eurozone, share markets across all the major regions, including Australia, all highlight biggest peak to trough share market falls in small caps compared to large caps around U.S. recessions.
(The reason small caps don’t underperform in the Eurozone is largely a data limitation. Small-cap data for the Eurozone is only available for the last three U.S. recessions (2001, 2008 and 2020). And one of those – the 2001 dot com related recession – was unusual, with large caps falling more than smalls due to the nature of the related tech bubble – heavily influencing the Eurozone result.)
In the black bars, what we have also shown is the maximum peak-to-trough underperformance around U.S. recessions across all the regions. This has varied from as low as -6% in Japan, to as high as -20% in Australia – both during the 2020 COVID-induced recession.
What is most striking is that, as the grey bars show, outside of Australia, in every major region small caps have already underperformed more than in any previous recession[1]. (And in the case of Australia the current -17.5% underperformance is just shy of its historical maximum of -20%.)
The key point here is that, if a recession was to occur in the U.S. this cycle, small caps across the world have generally already underperformed large caps by more than they have historically in any recession. So this may limit the size of any underperformance (or they may even outperform!) … should a recession happen.
Smalls already underperforming Large Caps by more than historical maximum around recession (except Aust but its close!)
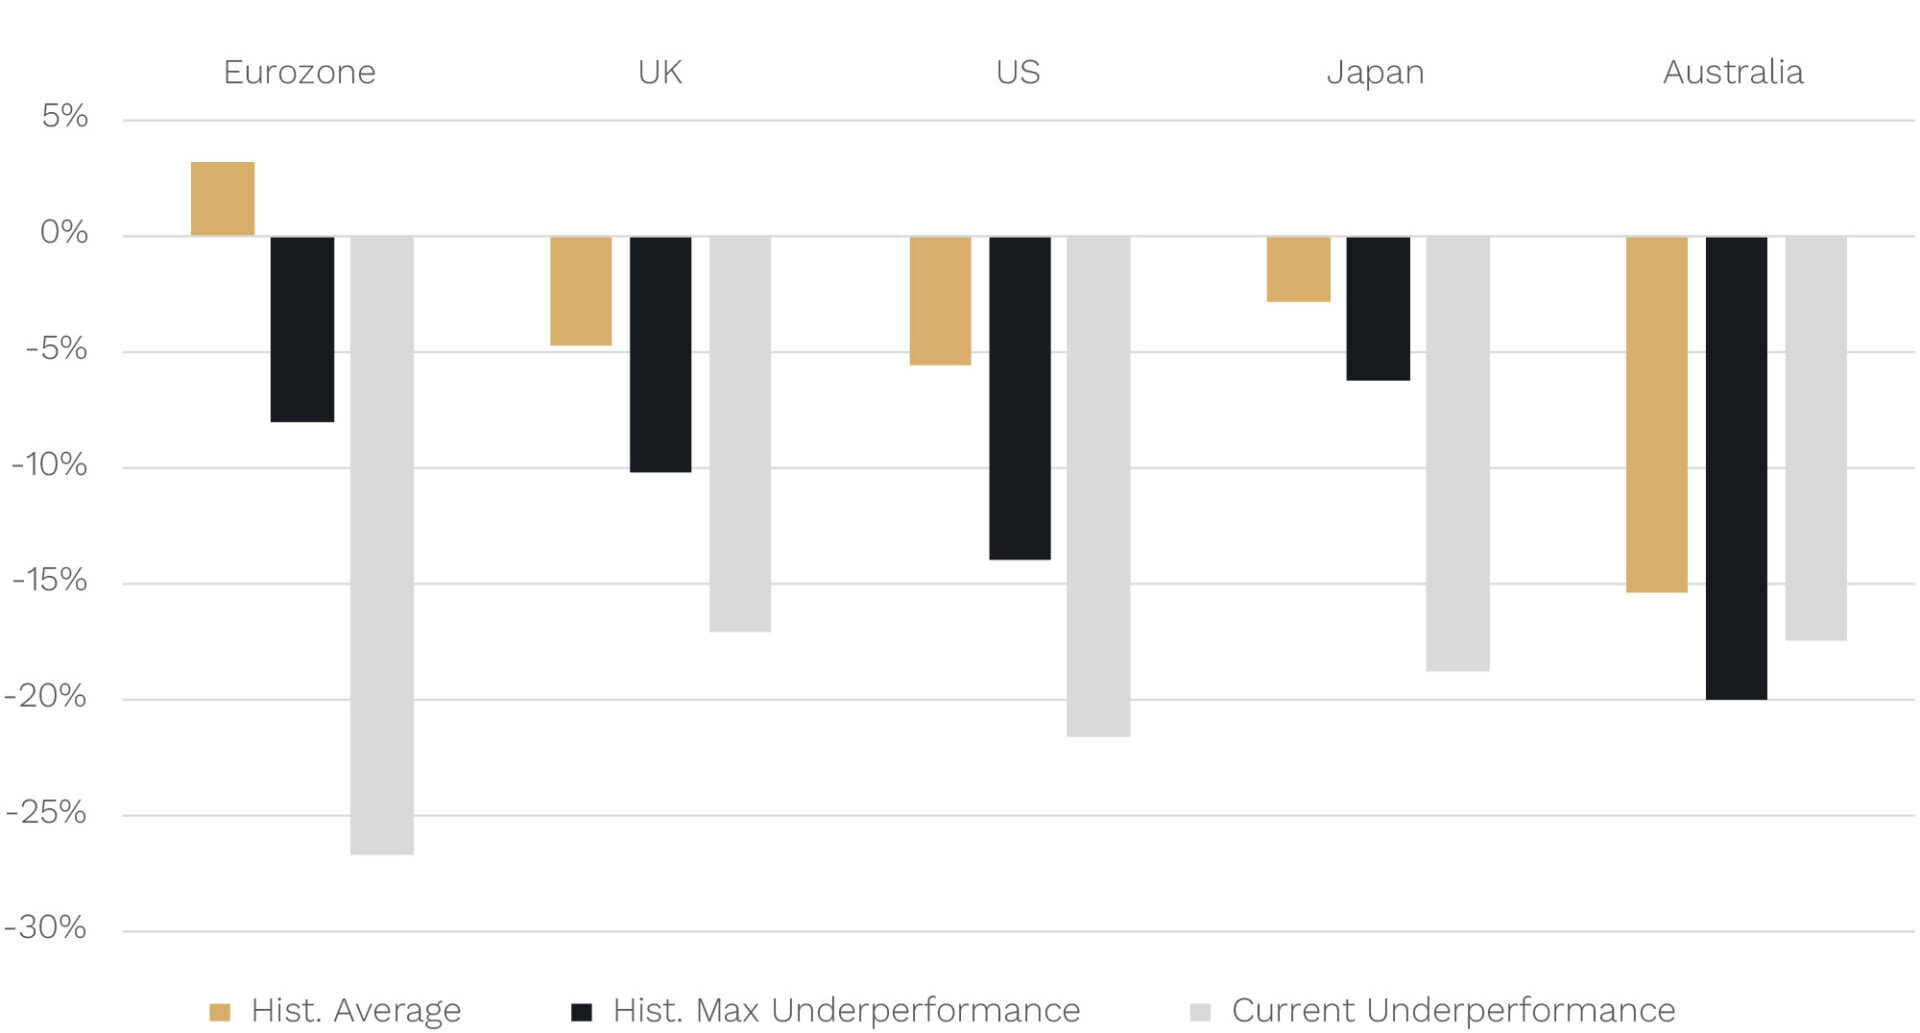
Source: JP Morgan, Bloomberg. Data to 31 March 2024.
[1] Using small cap data where available for the last six U.S. recessions back to 1980.
Source: JP Morgan, Bloomberg. Data to 31 March 2024.
What typically happens on the other side of a recession in small versus large caps?
Outperformance!
Below we show the historical average outperformance in small versus large caps in the 1 (gold bar), 2 (black bar) and 3 years (grey bar) after the recession-linked low in the major share market regions.
Average Small vs Large Cap outperformance in years since recession linked equity market trough (100% Hit Rate in Year 1)
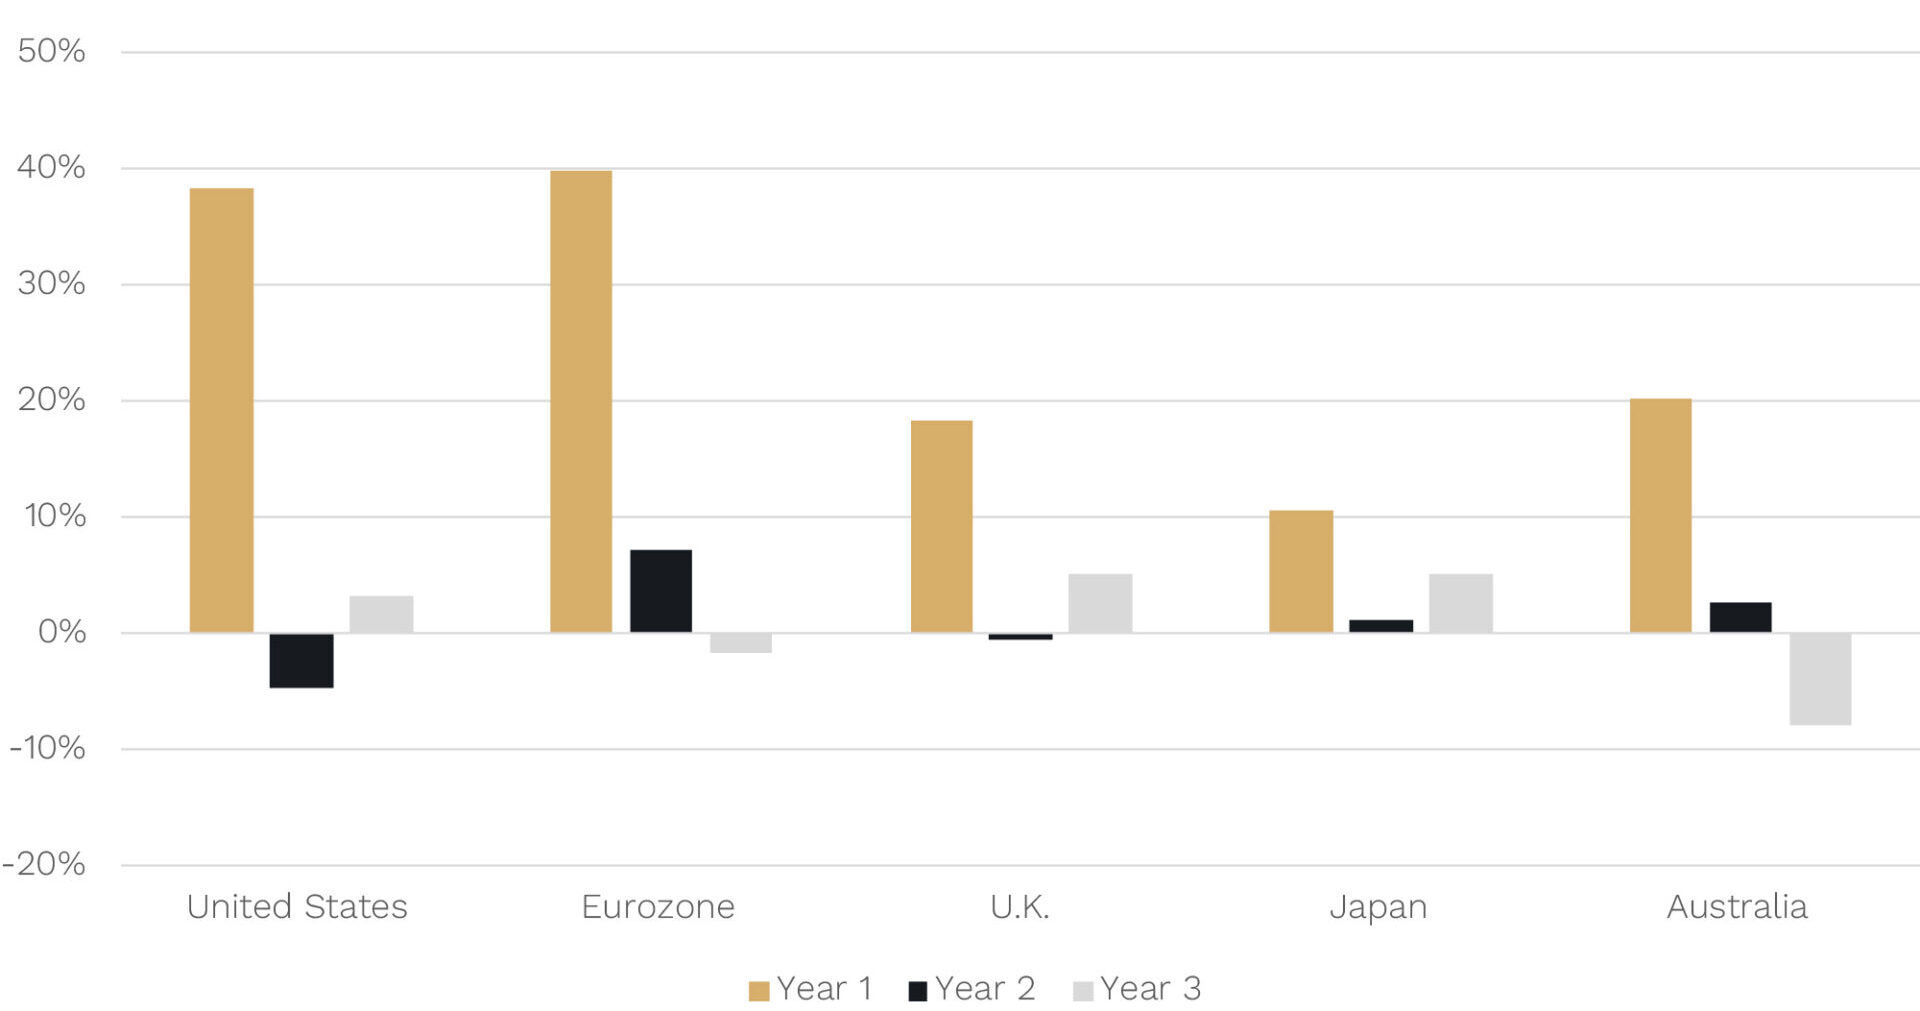
Source: JP Morgan, Bloomberg.
What you can see is that across the board in every major region, including Australia, small caps on average have outperformed large caps in the first year.
Not only that but the hit rate is 100%. That means that, not only is there small-cap outperformance on average, but this outperformance has occurred in the first year on every occasion in every region!
The other point is that all, or at least the vast majority, of that outperformance is delivered in the first year. A more granular analysis shows that much of it occurs in the first 3-6 months. So don’t bother trying to time it because it happens so quick you will probably miss it.
The key takeaway for us (Andrew and Steven) is that there is an asymmetry in the payoff of smalls versus large caps globally even if a recession occurs for two reasons:
- The downside versus large caps may be more limited given the already extreme underperformance for small caps, and
- The outperformance on the rebound of small caps has been historically consistent, quite significant and front loaded.
That’s why we say, when it comes to small versus large caps globally: don’t be penny wise and pound foolish.
That is, if you ‘pinch pennies’ to avoid the downside (if any given the underperformance already) of small v large caps if a recession occurs, you risk missing the likely big upside (the ‘pounds’) in outperformance of small caps on the other side of any recession.
Given this attractive payoff, both of us have been consistently allocating personal funds into our open global small/mid cap fund since about mid last year.
How much better could smalls caps be than large caps over the years ahead?
As regular readers will know, over the last few months we have highlighted just how extreme the valuation differences are in small cap land compared to large caps (and also even to mid caps).
While valuations are rubbish at predicting returns over the next week, month or year, at the market level they are generally very good over periods like 5-10 years.
Below we show the differences in relative valuations (using the Cyclically Adjusted Price-Earnings ‘CAPE’ Ratio) between US small (Russell 2000) and large caps (S&P500) and their subsequent 10-year relative returns.
Russell 2000/S&P500: Valuations and Returns (10 years)
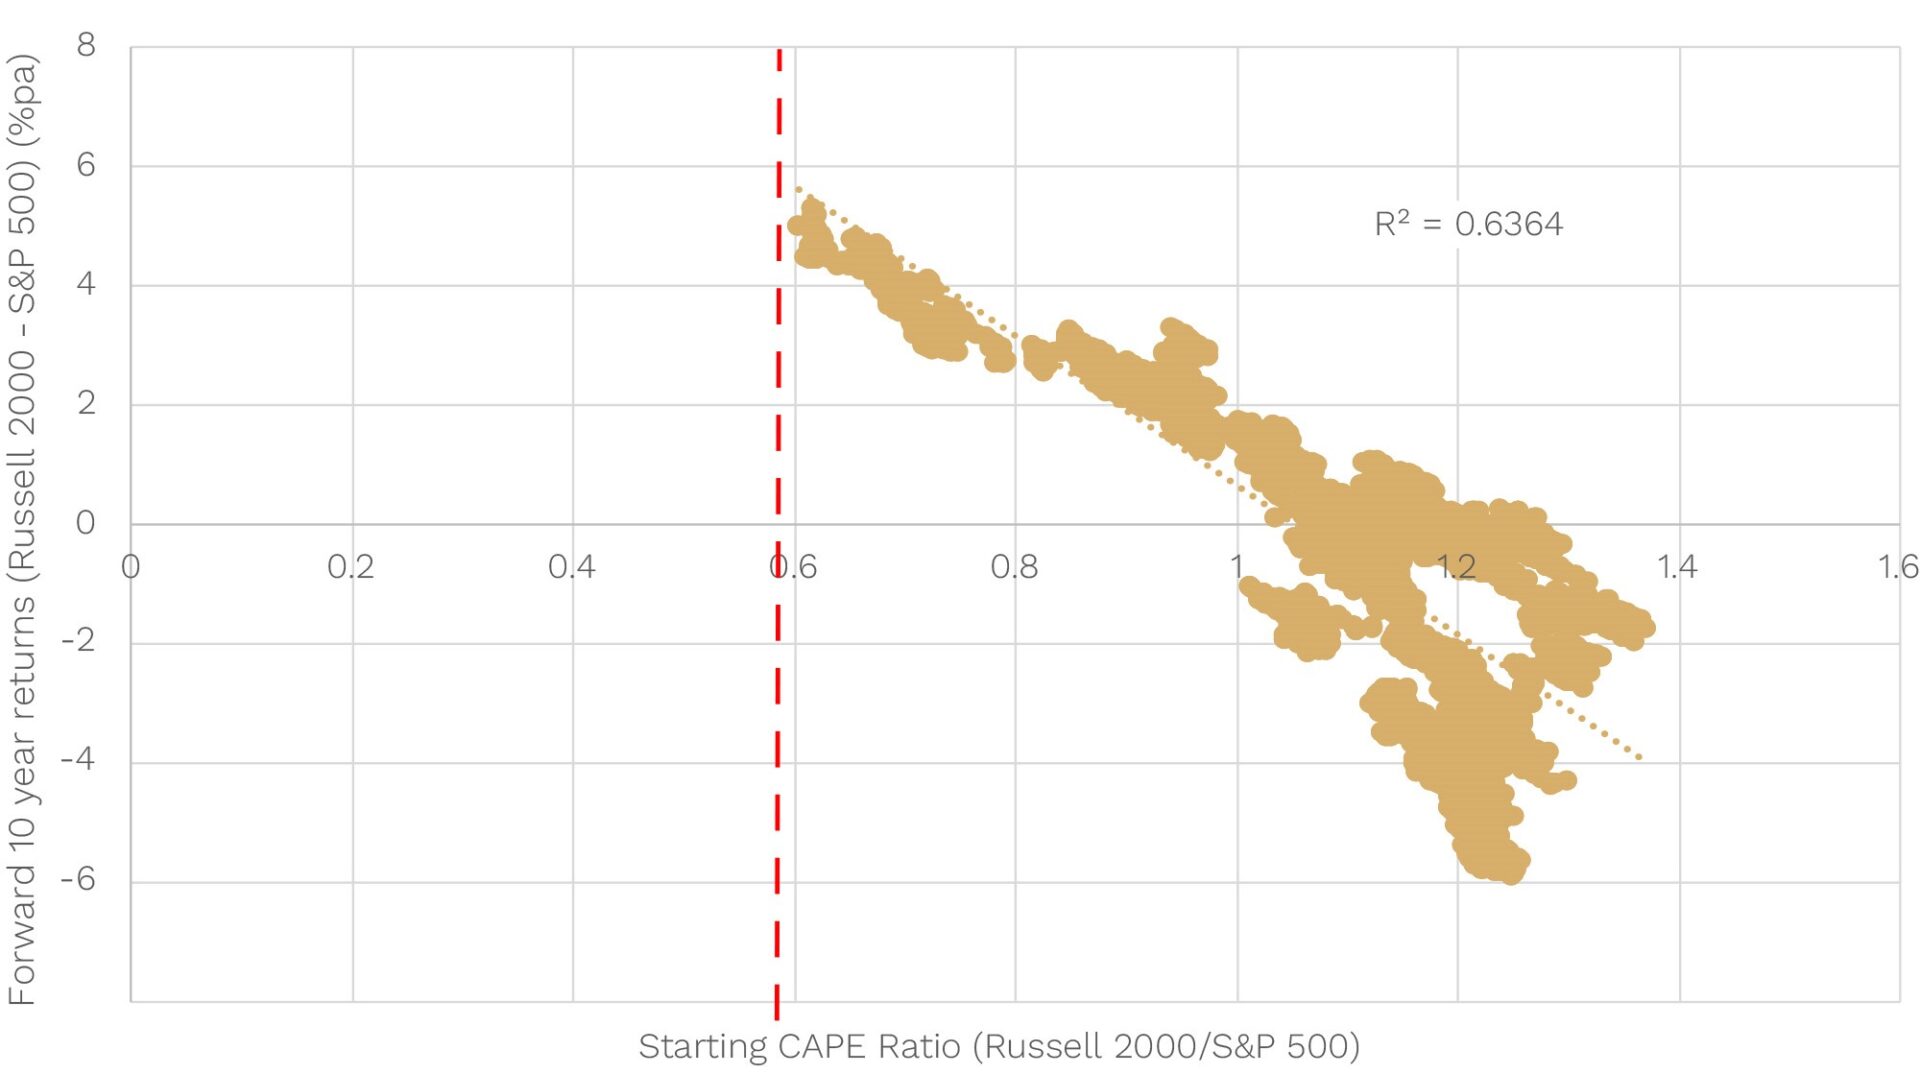
Source: Bloomberg.
It is crystal clear that the cheaper U.S. small caps are to large caps (a lower starting relative CAPE ratio), the more small caps tend to outperform large caps over the next 10 years.
The relationship is so good that these starting valuations explain almost 2/3s (64%) of the subsequent return difference.
Today the Russell 2000 CAPE ratio is 19x versus 32x for the S&P500 or a relative valuation of 0.6. That’s about the lowest/cheapest since 2000.
Historically, when U.S. small caps have been this cheap versus large caps, they have gone on to outperform them by around 5% p.a. over the next decade.
This is a big deal.
A 5% return on a $100,000 investment, for example, would give you a $63,000 gain over a decade. But a 10% return would give you a $159,000 gain – more than twice the gain due to the benefits of compounding.
For investors that have never considered allocating to small caps, and who have been riding the recent wave of large-cap outperformance, we hope we have made a compelling case for why we think, like it always does, the cycle will turn and we’ll again have the wind at our back as small cap investors.
As always, thank you for entrusting your capital with us.
Kindest regards,


Andrew Mitchell & Steven Ng
Co-Founders & Senior Portfolio Managers
Ophir Asset Management
This document is issued by Ophir Asset Management Pty Ltd (ABN 88 156 146 717, AFSL 420 082) (Ophir) in relation to the Ophir Opportunities Fund, the Ophir High Conviction Fund and the Ophir Global Opportunities Fund (the Funds). Ophir is the trustee and investment manager for the Ophir Opportunities Fund. The Trust Company (RE Services) Limited ABN 45 003 278 831 AFSL 235150 (Perpetual) is the responsible entity of, and Ophir is the investment manager for, the Ophir Global Opportunities Fund and the Ophir High Conviction Fund. Ophir is authorised to provide financial services to wholesale clients only (as defined under s761G or s761GA of the Corporations Act 2001 (Cth)). This information is intended only for wholesale clients and must not be forwarded or otherwise made available to anyone who is not a wholesale client. Only investors who are wholesale clients may invest in the Ophir Opportunities Fund. The information provided in this document is general information only and does not constitute investment or other advice. The information is not intended to provide financial product advice to any person. No aspect of this information takes into account the objectives, financial situation or needs of any person. Before making an investment decision, you should read the offer document and (if appropriate) seek professional advice to determine whether the investment is suitable for you. The content of this document does not constitute an offer or solicitation to subscribe for units in the Funds. Ophir makes no representations or warranties, express or implied, as to the accuracy or completeness of the information it provides, or that it should be relied upon and to the maximum extent permitted by law, neither Ophir nor its directors, employees or agents accept any liability for any inaccurate, incomplete or omitted information of any kind or any losses caused by using this information. This information is current as at the date specified and is subject to change. An investment may achieve a lower than expected return and investors risk losing some or all of their principal investment. Ophir does not guarantee repayment of capital or any particular rate of return from the Funds. Past performance is no indication of future performance. Any investment decision in connection with the Funds should only be made based on the information contained in the relevant Information Memorandum or Product Disclosure Statement.