By Andrew Mitchell & Steven Ng
Co-founders and Senior Portfolio Managers
In our August 2019 Letter to Investors we review the recent Australian company reporting season. A backdrop of growing political tensions and concerns of a slowing global economy meant that the main focus of investors was on companies delivering a positive outlook statement.
Dear Fellow Investors,
Welcome to the August 2019 Ophir Letter to Investors – thank you for investing alongside us for the long term.
Month in review
Geopolitical tension was a major influence on global equity returns during August. The US-China Trade War escalated with both President Xi and President Trump announcing increased tariffs with any negotiated agreement now highly unlikely until 2020. In addition, Boris Johnson’s political manoeuvring increased the odds of a no-deal Brexit and anti-extradition bill protests in Hong Kong raised fears of capital outflows. This uncertainty resulted in money pouring into bonds with US 10-year yields falling 52bps to 1.5%
In response global equity markets fell during August with the MSCI World Developed Markets index finishing -1.9% lower. Not surprisingly sharp falls were felt on UK and HK markets with the FTSE 100 index and Hang Seng index plunging -4.1% and -7.4% respectively.
On local shores these same geopolitical concerns and a volatile reporting season ended seven consecutive months of gains with the S&P / ASX 200 recording its first negative month during 2019 falling -2.4% while the S&P / ASX Small Ordinaries Accumulation fell -3.9%.
Ophir Fund Performance
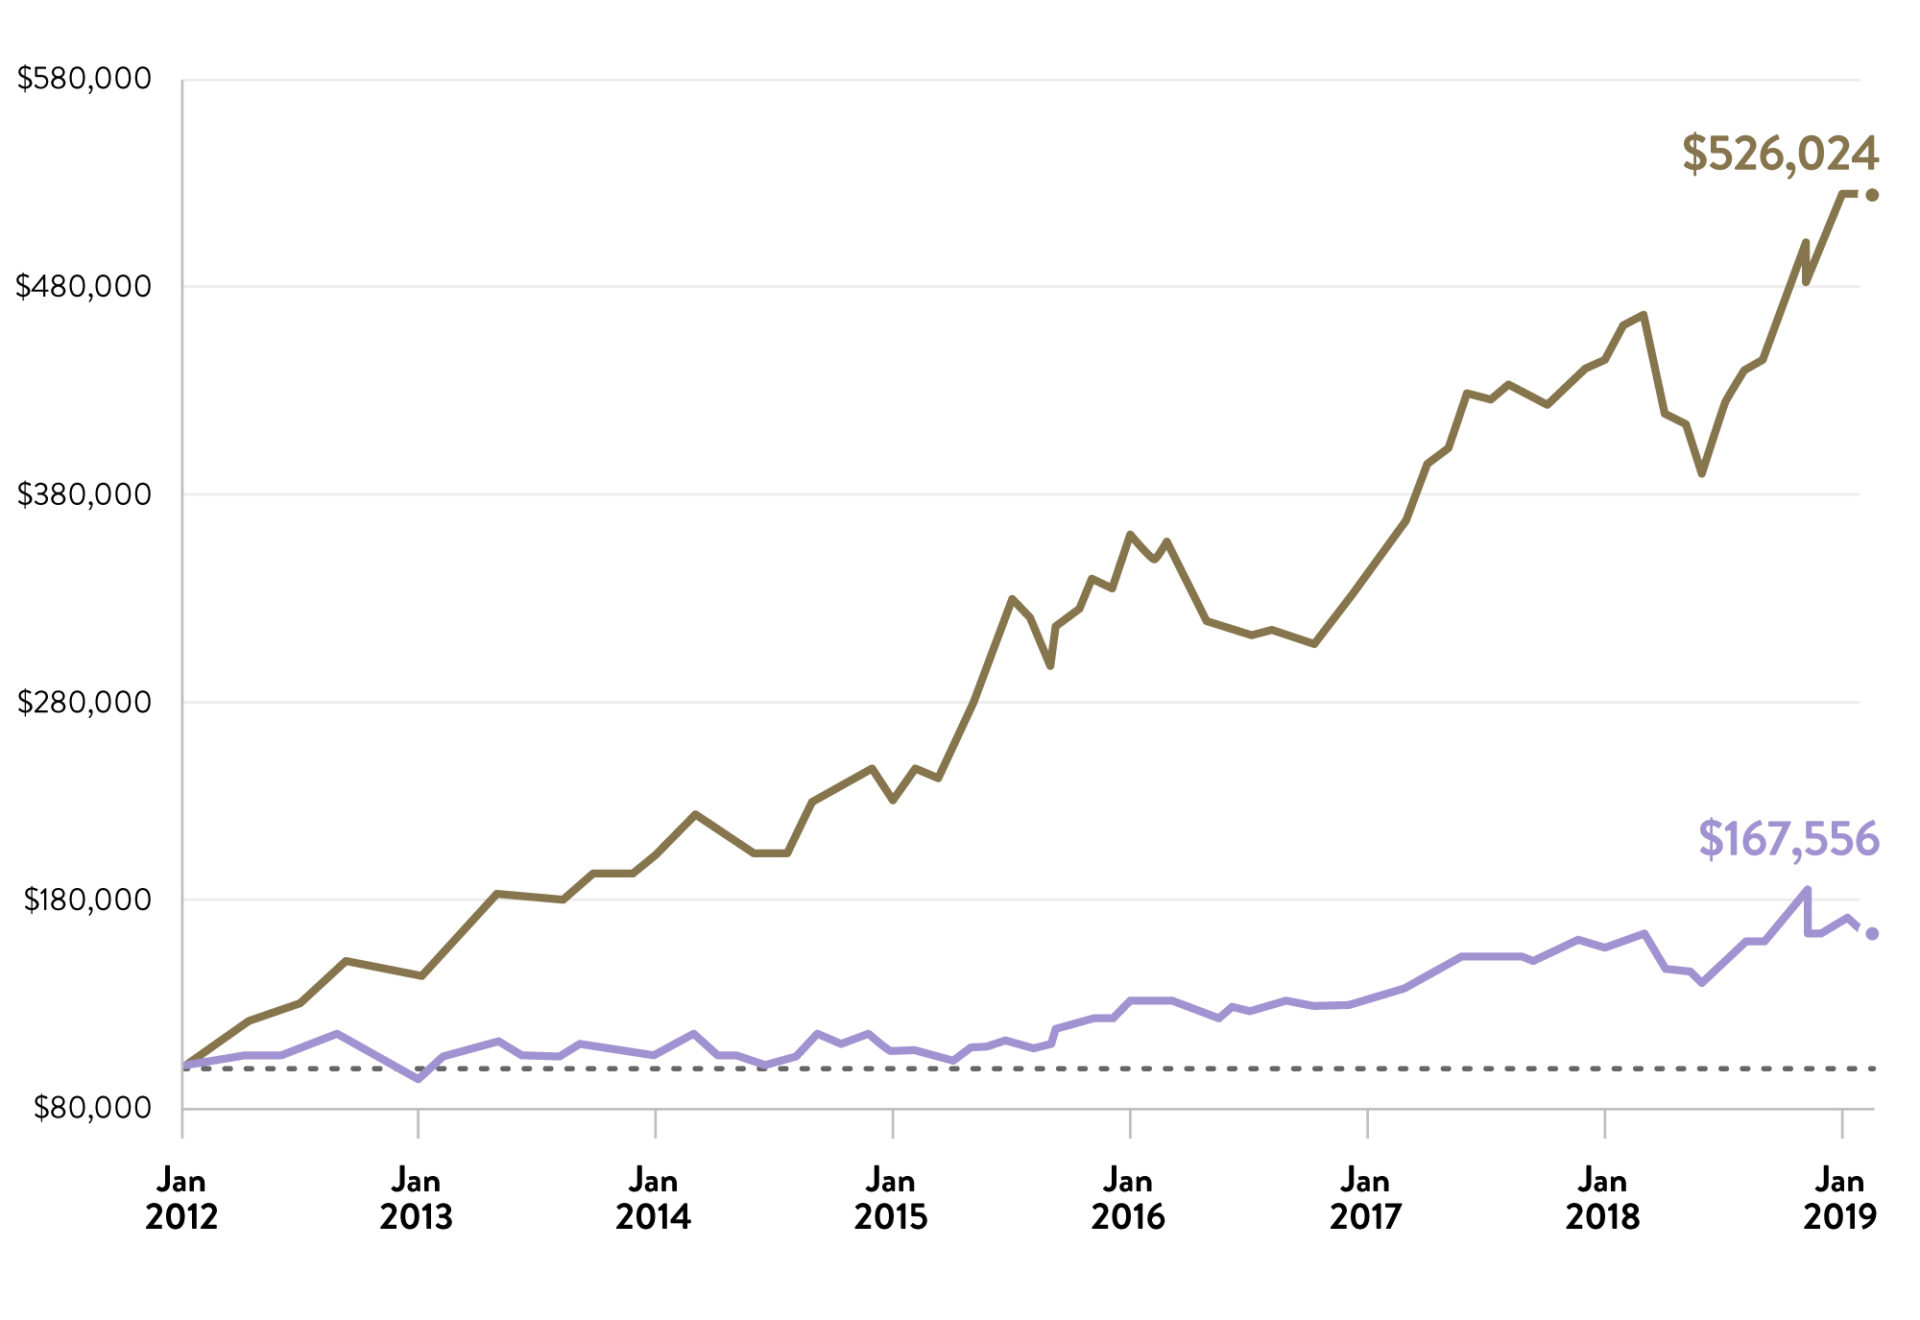
The Ophir Opportunities Fund returned -0.1% for the month after fees, outperforming its benchmark by 3.7%. Since inception, the Fund has returned +26.4% per annum after fees, outperforming its benchmark by 18.9% per annum.

Growth of A$100,000 (after all fees) since Inception
| 1 Month | 3 Month | 1 Year | 3 Year (p.a.) | 5 Year (p.a.) | Since Inception (p.a.) | |
| Ophir Opportunities Fund* | 0.9% | 11.0% | 18.1%p.a. | 17.4% | 23.2% | 33.4% |
| Benchmark* | -3.9% | 1.4% | 0.9% | 8.4% | 7.8% | 7.6% |
| Value Add (Gross) | 4.8% | 9.6% | 17.2% | 9.0% | 15.3% | 25.9% |
| Fund Return (Net) | -0.1% | 8.8% | 13.3% | 14.8% | 18.7% | 26.4% |
* S&P/ASX Small Ordinaries Accumulation Index (XSOAI). Past performance is not a reliable indicator of future performance
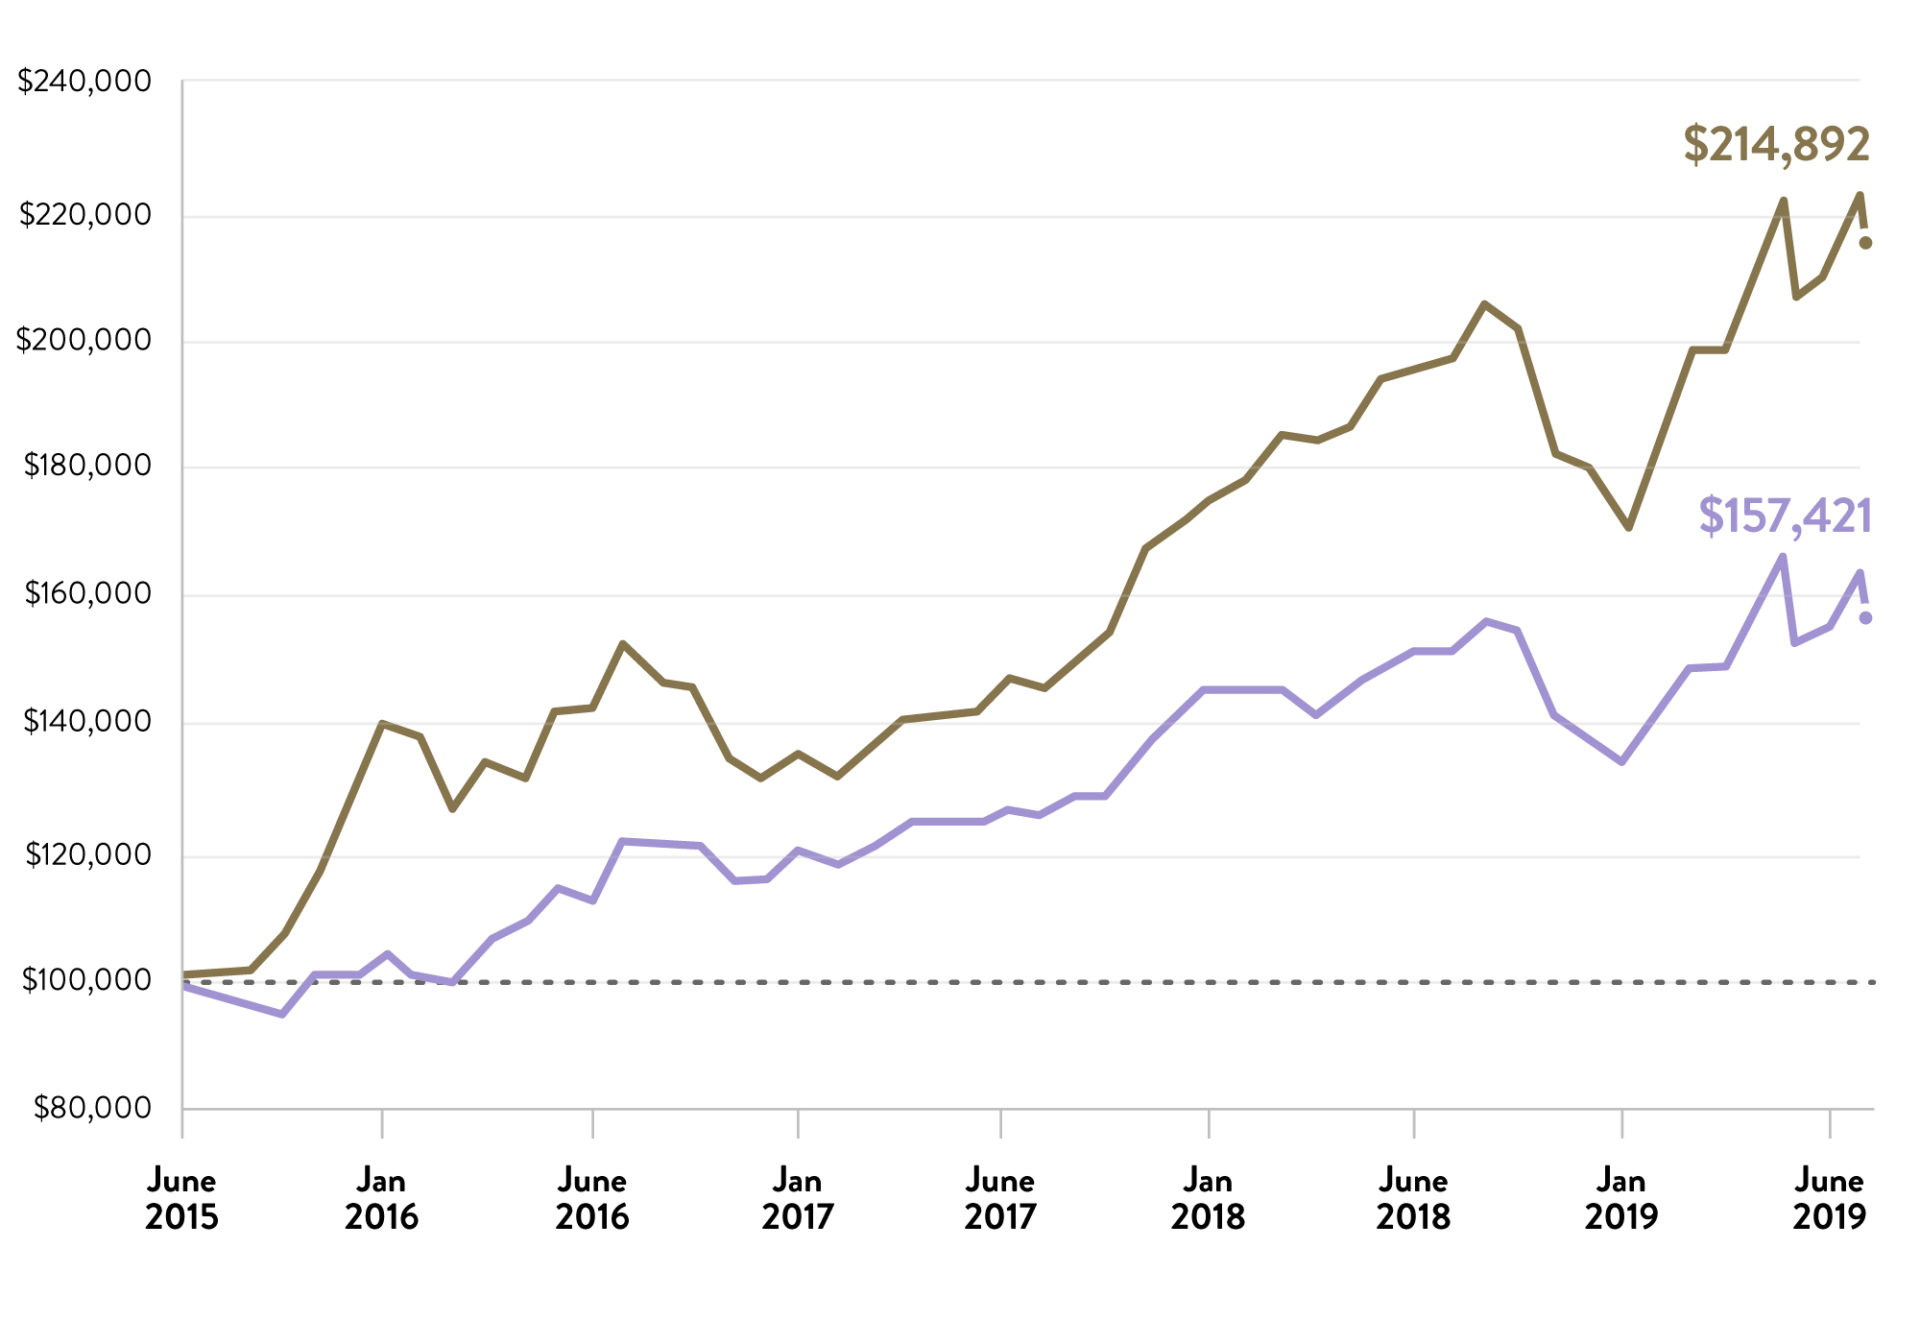
The Ophir High Conviction Fund investment portfolio returned -3.3% for the month after fees, underperforming its benchmark by -0.2%. Since inception, the Fund’s investment portfolio has returned +20.6% per annum, outperforming its benchmark by 8.9% per annum. The Ophir High Conviction unit price returned -6.5% for the month.

Growth of A$100,000 (after all fees) since Inception
| 1 Month | 3 Month | 1 Year | 3 Year (p.a.) | Since Inception (p.a) | |
| Ophir High Conviction Fund (Gross) | -3.2% | 5.3% | 6.4% | 16.0% | 25.4% |
| Benchmark* | -3.1% | 3.2% | 1.4% | 9.2% | 11.8% |
| Gross Value Add | -0.1% | 2.1% | 5.0% | 6.8% | 13.6% |
| Ophir High Conviction Fund (Net) | -3.3% | 4.6% | 4.4% | 13.5% | 20.6% |
| ASX:OPH Share Price Return | -6.5% | -3.2% | n/a | n/a | n/a |
* S&P/ASX Mid-Small Accumulation Index. Past performance is not a reliable indicator of future performance
August reporting season: It’s all about the outlook
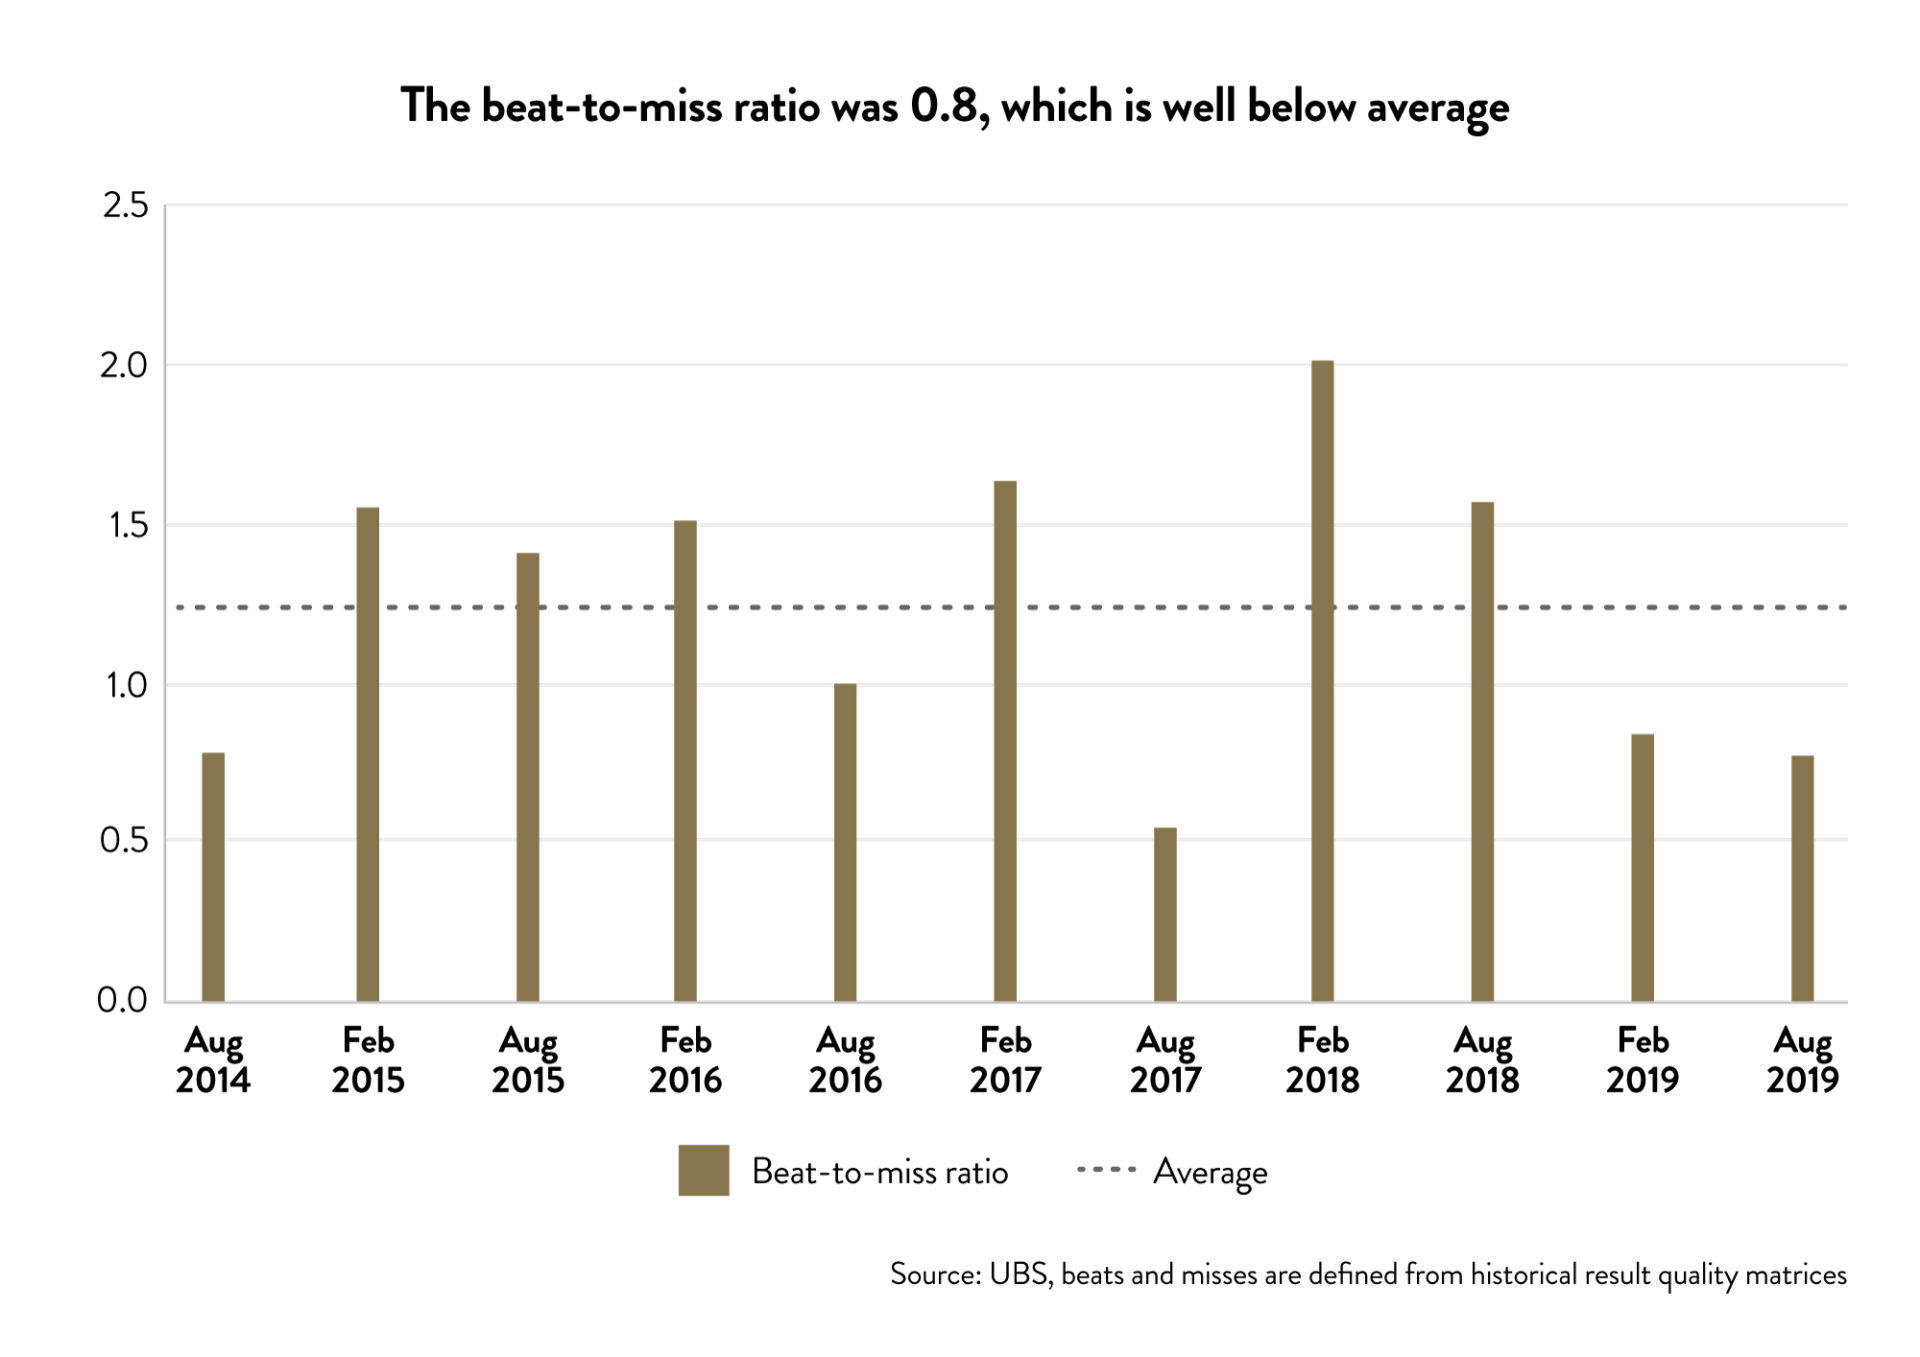
The August reporting season proved to be one of the more challenging ones to navigate in recent times for investors. Earnings beats were harder to come by with the ‘beat-to-miss’ ratio of 0.8 significantly below the long run average of 1.2.

In light of the backdrop of growing geopolitical tensions and concerns of a slowing global economy, the main focus of investors during reporting season was squarely on company outlook statements. Whilst meeting earnings forecasts was important, even more important was delivering a positive outlook statement that reassured investors about the company’s growth prospects in an increasingly challenging earnings environment. For example, Altium’s (ASX:ALU) share price surged on management’s positive outlook statement that it was on track to deliver both subscriber and revenue targets for FY20 and FY25 despite missing FY19 consensus earnings targets by 3%.
With the challenges facing the domestic economy, cyclical stocks have been doing it tough in recent times. A few weeks of positive FY20 trading data however sent share prices skyrocketing in some cyclical names. For example, Domain Group (ASX:DHG) surged over 8% when it announced encouraging signs of buyer activity in the first weeks of FY20 and JB Hi-Fi (ASX:JBH) climbed over 9% on the strength of +4.1% like-for-like annual sales growth to July 19. On the flip side, investors reacted savagely when Boral (ASX:BLD) announced that net profit after tax was expected to be lower in FY20 than FY19 sending the share price tumbling more than 20%.
Despite recent measures designed to stimulate domestic consumption including interest rate and tax cuts, our view is that any ‘sugar hit’ from these measures will be short lived and that the outlook for the Australian economy in the medium to longer term remains challenging. As a result, we have resisted the temptation to deploy capital into more cyclical companies.
Cleanaway & A2 Milk – Earnings beats but slightly weaker outlooks
When we reflect on the performance of our portfolio companies during reporting season it is with a sense of satisfaction and frustration, in equal measure! Satisfaction because for the most part we have been able to accurately forecast market share and earnings growth as good or if not better than previous reporting seasons. Frustration because despite beating their earnings targets, the share price of a few portfolio companies were impacted negatively by delivering slightly weaker outlook statements.
For example, portfolio company Cleanaway (ASX:CWY) posted double digit growth in FY19 driven by strong EBITDA growth across all its sectors. However, Cleanaway called out a slightly more moderate growth outlook than consensus had been expecting (high single digit EPS compared with low double digit expectations). This lead to a large and what we believe was an overly harsh share price response. We have maintained our conviction in the stock. The company continues to win market share with strong operating leverage and cash flow in a growing industry. We see Cleanaway as the key beneficiary of the short-term pressures facing the domestic recycling industry caused by China’s ban on recycled waste imports. Industry structure is improving, with the forced exit of marginal operators. Cleanaway is at the forefront of the consolidation. Longer-term the company is also in a very strong position to benefit from the large opportunity in the conversion of waste into energy.
Similarly, long term portfolio company A2 Milk (ASX:A2M) fell more than 13% when it announced a lower margin outlook in FY20. Investors have taken a dim view as to whether increasing investments in marketing and consultants costs in FY20 will drive an uptick in top-line growth in the two largest consumer markets in the world – China and the USA. We believe that judging the performance of the company on the FY20 margin outlook in isolation is premature. Not only because it includes significant losses from its emerging fresh milk business in the US, but more importantly it fails to capture the impressive quality and momentum in top line revenue growth.
Market share continues to grow with the latest disclosure in June at 6.4% on a rolling year basis vs 6% in March. Offline sales in China have increased 100% with A2 now available in ~17,000 stores up from ~12,000 at the end of H1. There have also been some recent price rises put through in both fresh milk and infant formula. A2 clearly has some very strong momentum heading into FY20 even before the full benefits of these increased investments have had time to kick in.
A2 is a very cash generative, high growth company. The market appears to be ignoring that A2 has signalled that it sees significant opportunity to accelerate growth and will invest accordingly. We see this growth potential as a big positive for the share price longer-term and for these reasons it remains a material portfolio holding.
Afterpay – So much to like for investors
Strong momentum in all geographies underpinned Afterpay’s (ASX:APT) FY19 earnings announcement with the share price surging in anticipation of and following the announcement. The company’s share price rose by over 15% during August. There was a lot in the announcement that excited us about the company’s long term growth trajectory.
Firstly, the company’s operating metrics continued to accelerate in its key offshore growth markets (i.e. the US and UK). The US is scaling faster than the Australian business did, both in terms of underlying sales and return customer spend. Pleasingly, merchant margins in the US are now in line with Australia, which will underpin long-term profitability. The news from the UK was even more impressive and with the Clearpay offering, the company is outpacing the growth seen in the early stages of the US, with active users in the UK already over 200,000. This is a fantastic result when you remember that it only launched in the UK 17 weeks ago.
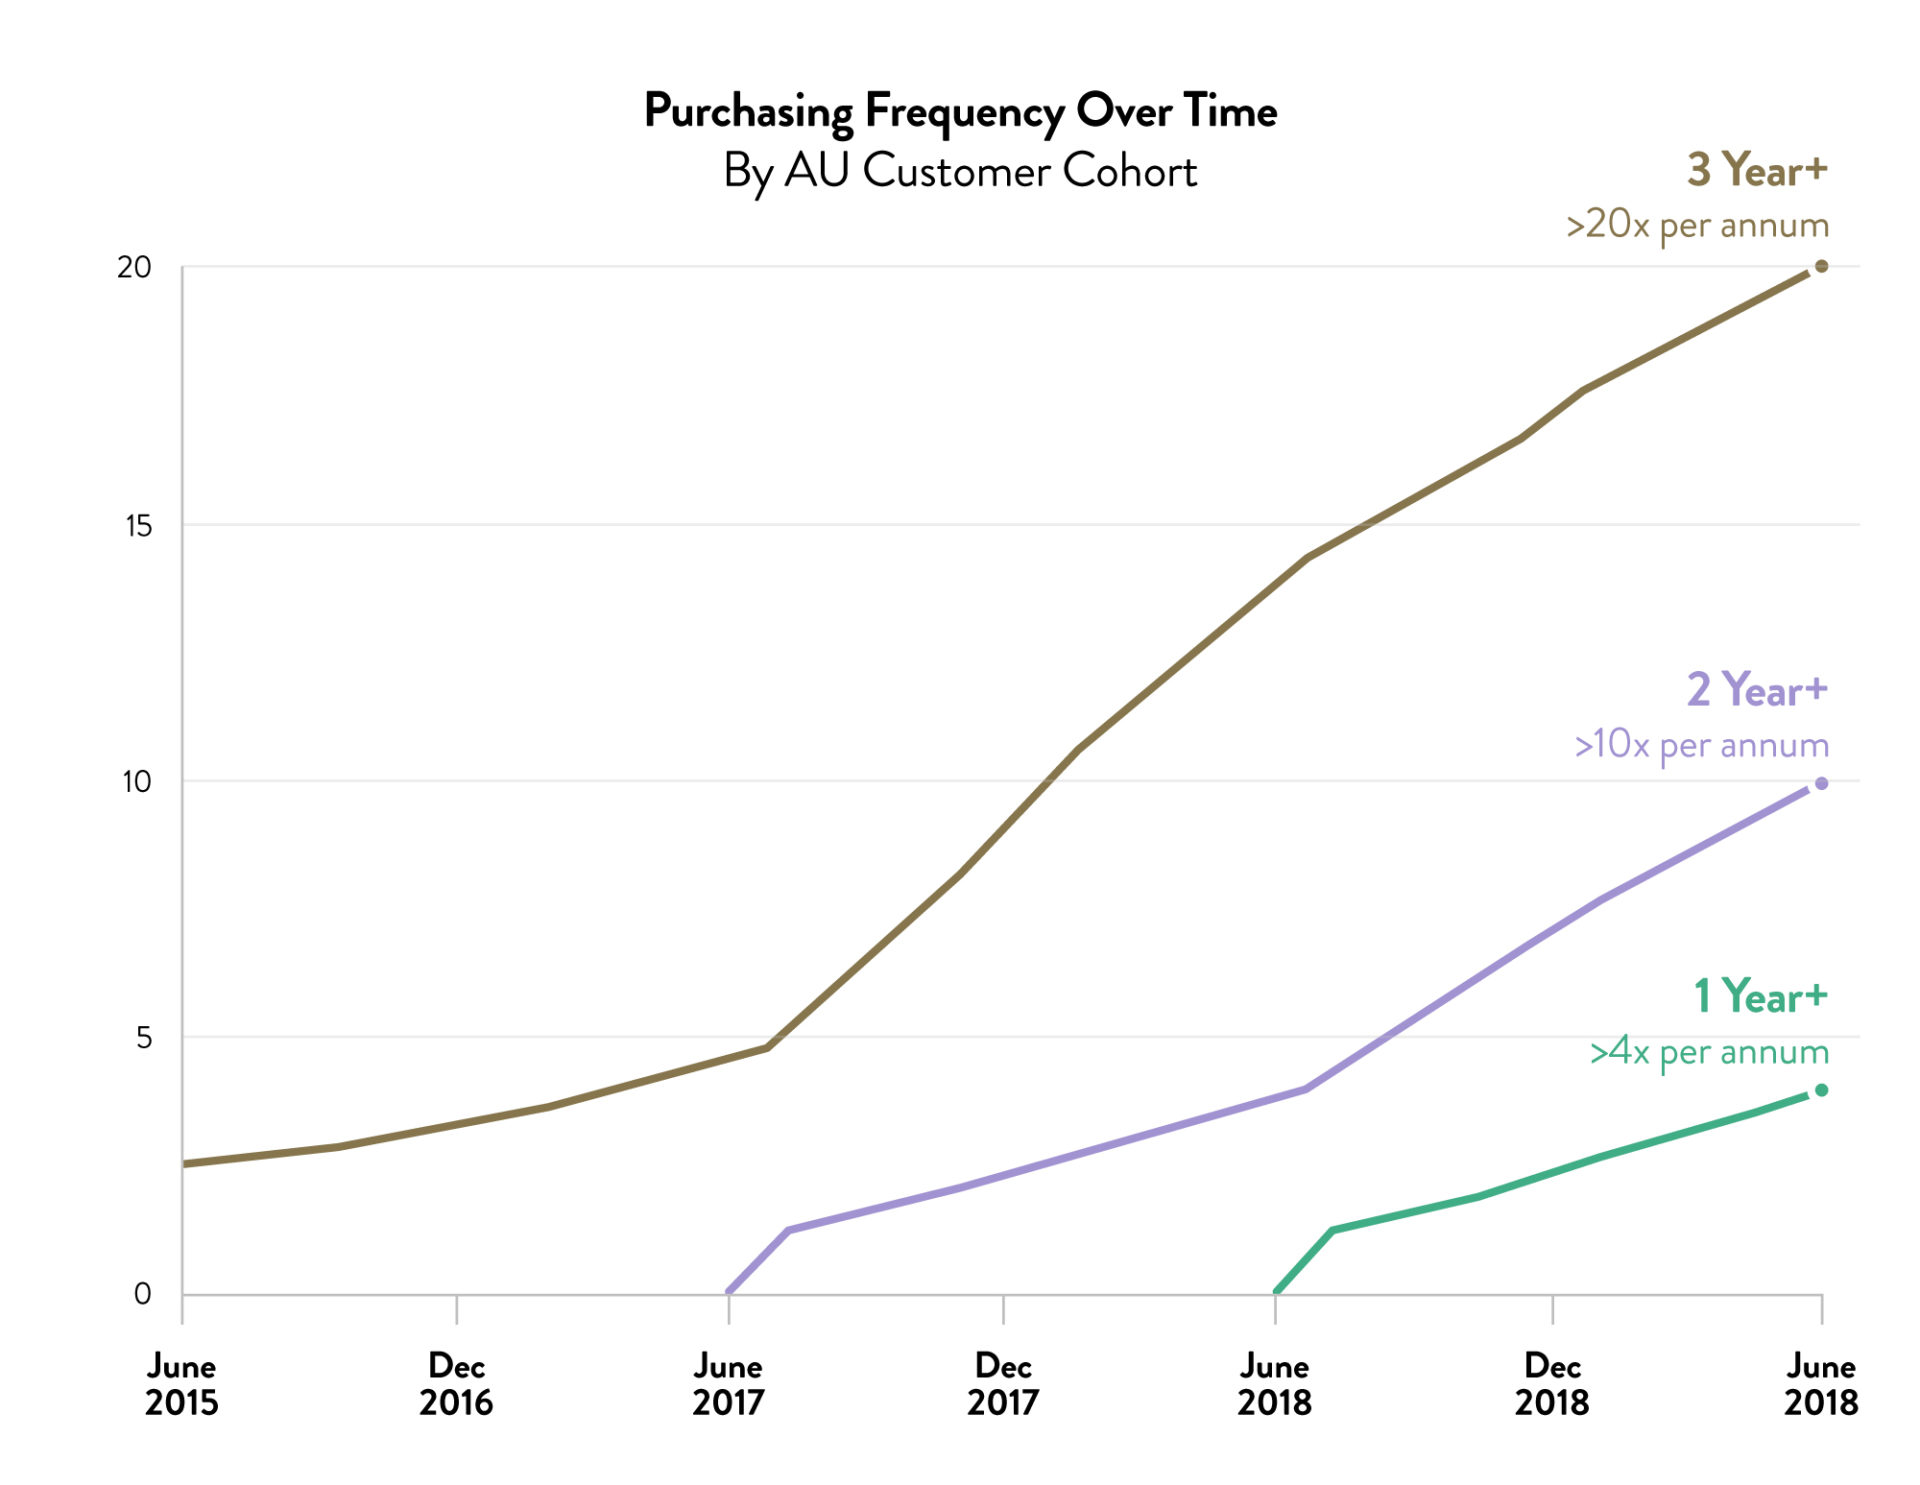
Secondly, underlying sales in Australia and New Zealand almost doubled for FY19 to $4.3 billion showing that there is still strong growth in the local business. Driving this growth is customer repeat usage which continues to increase and actually improve over time. For example, customers who have been using the platform for more than 1 year are transacting more than 4 times per annum but customers who have been using the platform for more than 3 years are transacting more than 20 times per annum. Early experiences in the US indicate that this is not just a local phenomenon with US customers also transacting more frequently the longer they use the platform. This is significant as it is changing customer behaviour in that they like using Afterpay and continue to use it more over time i.e. it’s not a fad.

Afterpay’s FY19 results highlighted management’s continued focus on execution discipline and the impressive progress the company is making in its offshore growth strategy in line with its FY22 objective of $20bn gross merchant value and 2% net transaction margin. The company continues to remain one of our largest portfolio holdings.
Portfolio positioning summary
While in some instances we have adjusted our portfolio weightings following information that has come to light during reporting season, we haven’t made any material changes to our portfolios. We continue to focus on businesses that are structurally growing and taking market share and we believe that our portfolios comprise a number of high quality companies doing exactly that.
There are clearly some overvalued high growth companies in the small and mid-cap segment. However, we believe that high quality companies that can demonstrate their ability to grow into big markets and take market share will continue to attract investor capital – particularly while interest rates have further to fall and these companies continue to meet, or beat, growth expectations. This is where we will be continuing to focus our investing efforts.
As always, thank you for entrusting your capital with us.
Kindest regards,
Andrew Mitchell & Steven Ng
Co-Founders & Portfolio Managers
Ophir Asset Management
This document is issued by Ophir Asset Management Pty Ltd (ABN 88 156 146 717, AFSL 420 082) (Ophir) in relation to the Ophir Opportunities Fund & the Ophir High Conviction Fund (the Funds). Ophir is the trustee and investment manager for the Ophir Opportunities Fund. The Trust Company (RE Services) Limited ABN 45 003 278 831 AFSL 235150 (Perpetual) is the responsible entity of, and Ophir is the investment manager for, the Ophir High Conviction Fund. Ophir is authorised to provide financial services to wholesale clients only (as defined under s761G or s761GA of the Corporations Act 2001 (Cth)). This information is intended only for wholesale clients and must not be forwarded or otherwise made available to anyone who is not a wholesale client. Only investors who are wholesale clients may invest in the Ophir Opportunities Fund. The information provided in this document is general information only and does not constitute investment or other advice. The information is not intended to provide financial product advice to any person. No aspect of this information takes into account the objectives, financial situation or needs of any person. Before making an investment decision, you should read the offer document and (if appropriate) seek professional advice to determine whether the investment is suitable for you. The content of this document does not constitute an offer or solicitation to subscribe for units in the Funds. Ophir makes no representations or warranties, express or implied, as to the accuracy or completeness of the information it provides, or that it should be relied upon and to the maximum extent permitted by law, neither Ophir nor its directors, employees or agents accept any liability for any inaccurate, incomplete or omitted information of any kind or any losses caused by using this information. This information is current as at the date specified and is subject to change. An investment may achieve a lower than expected return and investors risk losing some or all of their principal investment. Ophir does not guarantee repayment of capital or any particular rate of return from the Funds. Past performance is no indication of future performance. Any investment decision in connection with the Funds should only be made based on the information contained in the relevant Information Memorandum or Product Disclosure Statement.


