11 Dec, 2024

Letter To Investors - November

Letter to Investors • 14 mins read

Back to Insights Back to Insights

🡣 Download PDF


Why we Trust this Pilot to take off

November didn’t disappoint share market investors. A Trump-led rally shot the S&P500 (U.S. large caps) up +5.7% and the Russell 2000 (U.S. small caps) up +10.8% — the best monthly return for each index this year.

That was nothing compared to Bitcoin, which exploded +38.5%.  Trump is seen as a ‘BFF’ (Best Friend Forever) to the crypto market.

Aussie large-caps followed the U.S. up, adding +3.2%, though Aussie small caps lagged somewhat, rising +1.3%.

The big monthly return in U.S. small caps captured the headlines though, as the market has started to price in the potential benefits of Trump’s proposed tax cuts, as well as his more protectionist policy agenda. Both should disproportionately benefit smaller and more domestically orientated U.S. businesses.

We have been delighted at the recent surge in small-caps and in this month’s Letter to Investors we lift the lid to see just what’s driving the recovery. So far, it’s largely been a story of improving valuations. But could an earnings recovery kick in and help propel small-cap share prices even higher?

We also take a close look at Trustpilot, a stock that is bringing credibility and trust to internet reviews. We watched the company for some time before buying in October this year. As you’ll see, the company and its share price have huge upside potential and it’s a stock we’re particularly excited about.

U.S. large cap Santa rally is set to continue

It’s been a banner year so far for the heavyweight U.S. share market with returns year-to-date the strongest in at least 25 years.

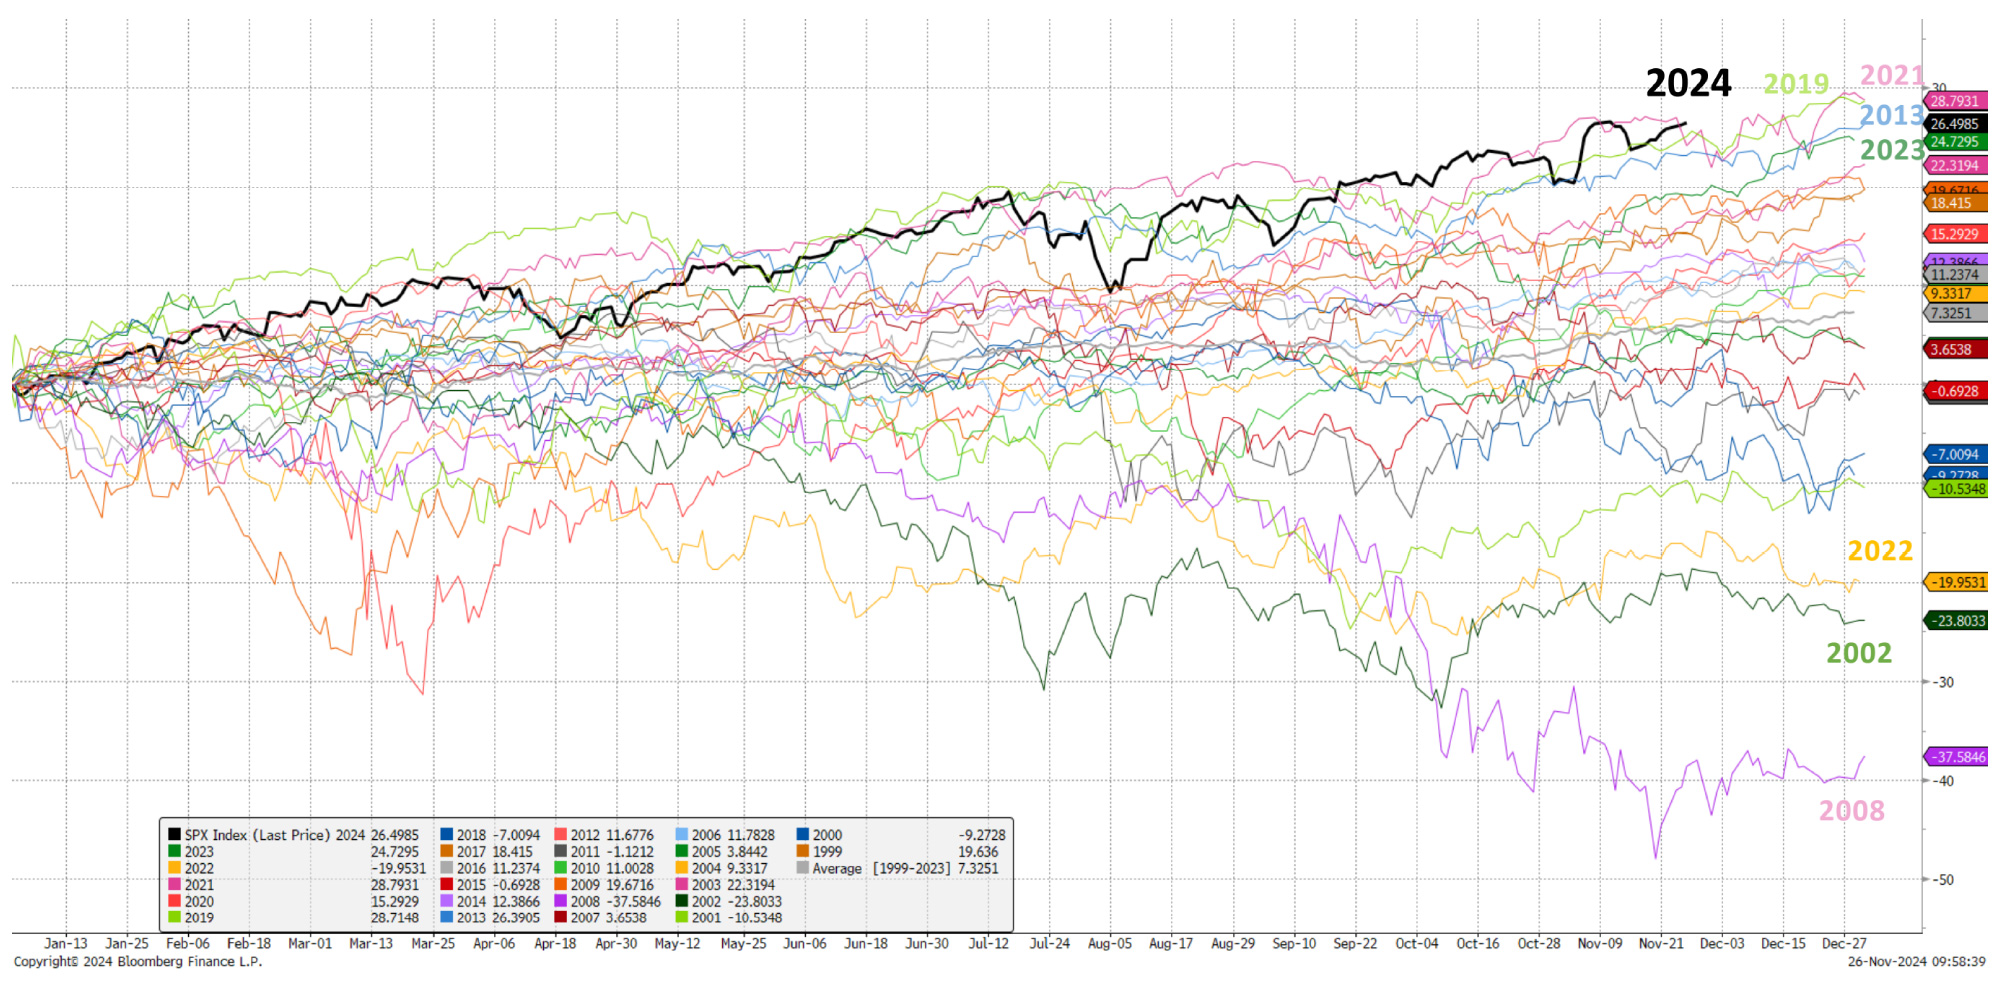
Source: Piper Sandler. Data to 26 November 2024.

About 17% of the 27% rise in the S&P500 this year to the end of November – or in other words a little more than half – has been expanding valuations (price to earnings ratio) as macro risks have been priced out.

The market has more comfort that U.S. inflation is under control, no recession is imminent, and election uncertainty has now been resolved.

Seasonally, we are also in the best two-month stretch for the U.S. share market (November and December), and there seems to be little that could get in the way of the Santa rally into year end.

Historically, PE re-rating is usually the precursor to a market rally as the market is forward looking despite declining or anaemic profit growth. So, the question on everyone’s mind is – will history repeat as it has done many times before?


November 2024 Ophir Fund Performance

Before diving into this month’s Letter, we’ve provided a detailed monthly update for each of the Ophir Funds below.

The Ophir Opportunities Fund returned +4.2% net of fees in November, outperforming its benchmark which returned +1.3%, and has delivered investors +23.1% p.a. post fees since inception (August 2012).

🡣 Ophir Opportunities Fund Factsheet

The Ophir High Conviction Fund (ASX:OPH) investment portfolio returned +7.5% net of fees in November, outperforming its benchmark which returned +3.5%, and has delivered investors +14.3% p.a. post fees since inception (August 2015). ASX:OPH provided a total return of +9.6% for the month.

🡣 Ophir High Conviction Fund Factsheet

The Ophir Global Opportunities Fund returned +11.9% net of fees in November, outperforming its benchmark which returned +6.8%, and has delivered investors +17.8% p.a. post fees since inception (October 2018).

🡣 Ophir Global Opportunities Fund Factsheet

The Ophir Global High Conviction Fund (Class A) returned +12.6% net of fees in November, outperforming its benchmark which returned +6.8%, and has delivered investors +13.7% p.a. post fees since inception (September 2020).

🡣 Ophir Global High Conviction (Class A) Fund Factsheet

The Ophir Global High Conviction Fund (Class B) returned +11.5% net of fees in November, outperforming its benchmark which returned +6.8%, and has delivered investors +29.1% p.a. post fees since inception (June 2023).

🡣 Ophir Global High Conviction (Class B) Fund Factsheet


A ray of light in small-cap earnings?

While U.S. large caps have seen earnings rise 10% this year (+17% valuation increase = the 27% S&P500 return), it’s been tougher in U.S. small-cap land where earnings (earnings per share or EPS in the chart below) have gone slightly backwards. Small businesses there have been suffering through more recession-like conditions.

The +16% return in the S&P600 index this year (another U.S. small cap index along with the Russell 2000) has been all driven by expanding valuations that still remain very cheap at around 19x forward earnings versus U.S. large caps at around 26x forward earnings.

Valuation increase drives all the return for U.S. small caps this year

Source: Piper Sandler at as 26 November 2024.

Valuation increases, though, are not a sustainable way to generate investment returns and do have an upper limit. Ultimately, earnings per share (EPS) growth is needed to drive the market higher over the long term.

As seen in the chart above, declines in annual earnings for U.S. small caps (S&P600) have been relatively rare. Yet it looks like both 2023 and 2024 will see U.S. small-cap earnings decline in aggregate.

The last time a decline occurred two years in a row was during the GFC in 2008 and 2009, though earnings fell much more back then, before surging strongly in 2010.

This gives some more hope that we may be nearing the end of the lengthy earnings falls or stagnation for U.S. small caps we have seen recently.

Our Funds’ portfolio companies are generating superior earnings growth

Certainly, the share market appears willing to give the new Trump administration – combined with the dialling back in monetary policy restriction from the U.S. Fed – the benefit of the doubt at present that better times are ahead for small-cap earnings.

We maintain a keen eye on small-cap earnings revisions and a handful of other key leading indicators for small-caps’ earnings to see if this is playing out.

Anecdotally, we are seeing an increasing number of our portfolio companies in the U.S. appearing more confident in their end markets given the current political and monetary policy setup. We’ll be watching closely whether this translates into increases in company guidance at their fourth-quarter results due in late January and throughout February early next year.

If it transpires, we will likely become even more positive on cyclically orientated businesses, and those that are leveraged more to the economic cycle.

Regardless, given the huge opportunity set at our disposal in our Global Funds at Ophir, and despite the slower broader backdrop for U.S. small-cap earnings this year, we still have not had trouble keeping average earnings growth in these Funds from our portfolio companies in the +20-25% range.

Trustpilot: Good things come to those who wait

“Trust is like the air we breathe – when it’s present, nobody really notices; when it’s absent, everybody notices.”  Warren Buffett

Trustpilot (LON: TRST) is a London-listed, Danish-founded consumer business operating a review website, which hosts reviews of businesses worldwide. Around 1 million new reviews are posted each month.

Reviews are written by any consumer with a Trustpilot account who has had a recent buying or service experience, as long as they follow the Guidelines for Reviewers, and don’t have a conflict of interest with the business they’re reviewing.

Consumers who’ve had an experience with a business can create a Trustpilot account and write an unsolicited review (“organic reviews”). Businesses can also ask their customers to leave a review by invitation. There should be no bias in the way customers are invited to review, with no offer of payment or incentive.

What sets Trustpilot apart is their commitment to transparency and neutrality. They ensure the platform is a trusted space where customers feel heard, and businesses can demonstrate their integrity.

A commissioned study conducted by Forrester Consulting on behalf of Trustpilot found that organisations deploying Trustpilot achieved a remarkable 401% return on investment over three years. These organisations experienced significant benefits, including improved customer acquisition and operational efficiencies.

Additionally, Trustpilot helped increase web traffic by 25% in the first year, 30% in the second, and 35% by the third year. These metrics underscore Trustpilot’s pivotal role in enhancing business performance through trust and transparency.

Trustpilot’s business model has strong network effects. As more consumers use Trustpilot to review more businesses, more domains and businesses are added to the platform. More businesses claim their profiles, and over time become customers.

As the flywheel keeps spinning – this drives organic growth, strengthens the brand and market position, while simultaneously and creating high barriers to entry.

Trust follows the adage of “goes up the escalator and down the elevator” demonstrating barriers/ time to build adequate consumer reviews yet easy loss of confidence in website if reviews aren’t honest.  If the business can overcome this dynamic, then it should build adequate moat to monetise model as difficult for competitors to replicate.

Lofty initial expectations came back towards earth

We first met Trustpilot management during the 2021 IPO process. Despite evidence of good early momentum across the business, we passed on valuation grounds. At the 265p IPO price we were being asked to pay too much for potential success in the U.S. where there was limited penetration at the time.

Patience pays off

Source: Ophir, Bloomberg. Data to 30 November 2024.

This was a good decision because Trustpilot’s share price declined materially after peaking towards the end of 2021 and tracked broadly sideways from mid-2022 and much of 2023 due to macro factors.

Stock-specific factors also impacted the share price. The initial roll-out in the U.S. was ‘scatter-gun’ and lacked focus. That was a key element holding us back from buying the stock.

Yet because of its unique business model and significant market opportunity, we continued to follow the company.

But during 2023 we noticed Trustpilot’s approach to the U.S. became much more focused. The company homed in on a few core verticals (e.g. financial services, education).

This improved growth and more specifically net revenue retention (another way to describe customer retention). That was the evidence we needed to see before re-engaging with the company.

So in early 2024, we met with management in their U.S. headquarters in Denver. We were impressed with the ongoing execution in the UK, as well as the momentum that was building in other jurisdictions globally, including the U.S.

We subsequently caught up with the company on a handful of occasions over the next few months, after which we invested in the company. Our patience and valuation discipline allowed us to see the company execute for several years and, ultimately, we initiated our position below the IPO price.

We see big upside for the company and its share price for several reasons:

  1. The UK and other markets remain underpenetrated

The UK is Trustpilot’s most penetrated region. However, with 1H24 bookings of US$47m in a serviceable addressable market (SAM) of ~US$1.7 billion this equates to only ~5% penetration.

Source: Ophir. Company Financials.

This provides a meaningful growth runway; while also providing a reasonable blueprint for what the terminal/mature economics of the business may look like for the group.

  1. Trustpilot continues to show strong network effects

Since 2018 UK bookings have grown at a ~20% compound annual growth rate (CAGR), while sales and marketing dollars have remained broadly stable, based off our internal estimates for the UK division. This demonstrates the strong network effects when consumer awareness hits a tipping point.

Source: Ophir. Company Financials.

  1. The company is still seriously undervalued

Our comparative analysis shows that businesses with a similar growth and margin profile to Trustpilot’s UK business trade on 8-9x annual recurring revenue (ARR).

This results in a UK valuation of ~US$1 billon and implies we are paying ~US$500 million (or 3x ARR) for Europe & the Rest of the World (RoW) and North America, which combined are 10x the SAM of the UK.

  1. Data shows strong momentum globally

We think near-term momentum will show acceleration in the U.S. and EU/Row based off our data tracking, calls with regional experts and tracking of onboarded and paying companies.

For key markets and verticals, we closely monitor Google search visibility, the quality and volumes of reviews as well as engagement and conversion. We also track corporates who are signed up and paying them.

Our data tracking shows Trustpilot’s robust performance in established markets such as the UK. It also demonstrates the critical U.S. market is accelerating alongside Germany, France and Italy, which are core to the Europe/RoW segment.

Source: Ophir, Google Trends.

  1. Trustpilot’s U.S. position continues to strengthen

When compared to competitors in the U.S., such as Stamped, Yotpo, Bazaarvoice and Birdeye, Trustpilot has demonstrated more consistent performance and a positive trajectory. This suggests a strengthening of its position in the U.S. market. The strong interest levels against a backdrop of competitor volatility suggests Trustpilot is on the path to becoming the pre-eminent platform in the trust and review ecosystem.

Source: Ophir, Google Trends.

A significant runway for growth

Given their large markets, significant upside to penetration, high long-term margins and limited competition due to high barriers to entry, as well as strong network effects, we see significant upside for Trustpilot.

As management continues to execute, the market will get more comfortable with the long-term growth opportunity in North America, Europe and the Rest of the World.

This is a great example of how being patient and waiting for a better entry point can pay off. By applying our GARP (growth at a reasonable price) investment philosophy at the time of the IPO, we were effectively given a free look at how the business executed for the following 3 years.

As always, thank you for entrusting your capital with us.

Kindest regards,

Andrew Mitchell & Steven Ng

Co-Founders & Senior Portfolio Managers

Ophir Asset Management


This document is issued by Ophir Asset Management Pty Ltd (ABN 88 156 146 717, AFSL 420 082) (Ophir) in relation to the Ophir Opportunities Fund, the Ophir High Conviction Fund and the Ophir Global Opportunities Fund (the Funds). Ophir is the trustee and investment manager for the Ophir Opportunities Fund. The Trust Company (RE Services) Limited ABN 45 003 278 831 AFSL 235150 (Perpetual) is the responsible entity of, and Ophir is the investment manager for, the Ophir Global Opportunities Fund and the Ophir High Conviction Fund. Ophir is authorised to provide financial services to wholesale clients only (as defined under s761G or s761GA of the Corporations Act 2001 (Cth)). This information is intended only for wholesale clients and must not be forwarded or otherwise made available to anyone who is not a wholesale client. Only investors who are wholesale clients may invest in the Ophir Opportunities Fund. The information provided in this document is general information only and does not constitute investment or other advice. The information is not intended to provide financial product advice to any person. No aspect of this information takes into account the objectives, financial situation or needs of any person. Before making an investment decision, you should read the offer document and (if appropriate) seek professional advice to determine whether the investment is suitable for you. The content of this document does not constitute an offer or solicitation to subscribe for units in the Funds. Ophir makes no representations or warranties, express or implied, as to the accuracy or completeness of the information it provides, or that it should be relied upon and to the maximum extent permitted by law, neither Ophir nor its directors, employees or agents accept any liability for any inaccurate, incomplete or omitted information of any kind or any losses caused by using this information. This information is current as at the date specified and is subject to change. An investment may achieve a lower than expected return and investors risk losing some or all of their principal investment.  Ophir does not guarantee repayment of capital or any particular rate of return from the Funds. Past performance is no indication of future performance. Any investment decision in connection with the Funds should only be made based on the information contained in the relevant Information Memorandum or Product Disclosure Statement.

Previous

11 Dec, 2024 What’s caused the recent outperformance in our Global Funds?

Next

16 Jan, 2025 Letter To Investors - December
11 Dec, 2024

What’s caused the recent outperformance in our Global Funds?

Investment Strategy • 5 mins read

Back to Insights Back to Insights

🡣 Download PDF


For our Global Opportunities Fund, November 2024 was its best single month of performance since its inception in October 2018, some 74 months ago. A pleasing result. Similarly, for our Global High Conviction Fund, November was its second-best performance month since inception in 2020.

When we have sizable out or underperformance relative to our benchmarks, we are really interested in understanding what caused that performance.

Is it because of some intended, or perhaps even unintended, ‘factor’ exposure? (A factor is a fairly obtuse term for a collection of stocks that share a common characteristic, such as size, value, geography or industry.)

Or is it because of good old-fashioned stock picking?

At Ophir, over the long term, we would obviously expect our stock picking skills to explain most of our outperformance, rather than factors, which investors can increasingly gain exposure to cheaply elsewhere.

Lifting the lid on November’s outperformance

Let’s firstly examine what drove November’s outperformance.

If we take the Global High Conviction Fund, below we show the Fund’s November performance versus its benchmark (left chart). And in the right chart we show the breakdown of its outperformance by various different factors, such as country, beta (a fancy finance term for companies whose share price tends to go up more when the share market goes up), style and size exposure … but also by ‘selection effect’.

GHCF November Performance Review

Source: Bloomberg & Ophir. Data as of 30 November 2024. Benchmark is the MSCI World SMID Cap Index NR (AUD). Factor analysis uses proxy of the Bloomberg Global Developed Mid Small Index.

Selection effect is the proportion of the outperformance versus the benchmark that you can attribute to specific companies Ophir has selected, after subtracting off any factor exposures/bets.

(At Ophir, our investment style gives us two primary factor exposures: ‘small cap’ and ‘growth’. We don’t overpay for that growth and investment consultants call our style Growth at a Reasonable Price, or GARP for short. But we don’t expect our style to deliver outperformance over the long run. It is the stocks we pick within that style that allow us to outperform.)

What the analysis shows is that selection effect, or stock picking, has contributed the lion’s share – in fact 81% of the outperformance for November.

This is a very similar number for our Global Opportunities Fund given the high overlap in stock holdings (75-80% overlap by weight).

This is crucially important because outperformance through stock picking is exactly what our investment process targets and what we spend all our time trying to achieve. It is also the most sustainable form of outperformance, in our view, given factor tailwinds can easily reverse and become headwinds (like we saw in 2022 when our small-cap growth style went against us).

The main Factor contributor to performance in November was country allocation, which made up 14% of the outperformance. This was mainly through us being overweight (versus the benchmark’s allocation) to U.S. companies whose performance tended to be better in the month, and underweight Japanese companies (we have zero allocation compared to the benchmark’s 10% allocation) which tended to have poorer performance.

What about the past year’s outperformance?

While it’s great that stocking picking has been the major driver of performance in November, it’s just one, albeit strong, month.

But if we zoom out a little, performance over the last year in the Ophir Global Funds has also been strong. The Global Opportunities Fund and Global High Conviction Fund are up +55.0% and +54.5% respectively, versus their common benchmark up +28.2%.

GHCF 1 Year Performance Review

Source: Bloomberg & Ophir. Data as of 30 November 2024. Benchmark is the MSCI World SMID Cap Index NR (AUD). Factor analysis uses proxy of the Bloomberg Global Developed Mid Small Index.

As shown above, if we perform the same analysis for the +26.3% outperformance over the last year in the Global High Conviction Fund, we see that 105% of the outperformance was driven by stock picking. An even better result than November.

How can stocking picking have driven more than 100% of the outperformance?

Easy. It’s because the ‘factor’ attribution to outperformance was actually negative -5%. That is, factor exposures of the Fund hurt relative performance.

What were the bigger factor headwinds to relative performance over the last year for the Global High Conviction Fund?

  • This time Country exposure went against us. Being overweight French stocks hurt as the French share market underperformed.
  • Also, size went against us. That is, larger companies tended to outperform smaller companies in the global share market over the last year.

It wasn’t all bad news, though, from a factor perspective.

Relative industry weights, and exposure to higher price momentum and higher beta stocks all added positively to returns.

It’s just on a net basis; factor exposures were a headwind.

Ophir’s hard work and stock picking skills paying off

The key takeaway remains though, just like November, the strong outperformance over the last year has been driven overwhelmingly by stock picking.

This is great news for investors.

It means the Ophir investment process is working. It means outperformance over the last year is not being primarily driven or being given any ‘free kicks’ from intended or unintended exposures to certain common characteristics of stocks – so-called ‘factor’ exposures that investors might be able to buy cheaply elsewhere.

Over the last year for our Global Funds, we did over 1,000+ company meetings to help us understand which companies we think will outperform. Not only did we meet with the company itself, but its customers, suppliers, competitors, industry experts, ex-employees … the list goes on. Many of these meetings are in person, traveling all over the world to gather our insights.

The hard work has been paying off both recently and over long term time periods, as shown by our Funds long-term track records.

Outperformance doesn’t necessarily happen in any given month or year. But it’s great to see that this year it has.

And, of course, the work continues.

Previous

18 Nov, 2024 Letter To Investors - October

Next

11 Dec, 2024 Letter To Investors - November
18 Nov, 2024

Letter To Investors - October

Letter to Investors • 14 mins read

Back to Insights Back to Insights

🡣 Download PDF


No one else wanted to look here, but we found a bargain

After a hot streak of five months, the global share market took a breather in October. The MSCI World Index (in USD) fell -2.0%; the S&P500 got off a little lighter, down -0.9%. It was a surge in the U.S. 10-year Treasury bond yield, which rocketed up +0.5% in the month to 4.3%, that weighed on share market valuations across the world.

Not only did long-term interest rates in the U.S. move sharply higher over the month, but so too did expectations for short-term rates. Only four 0.25% Fed cuts are now expected this cycle (at writing), down from eight 0.25% expected at the start of October.

Why such a sharp move higher in short and long-term interest rates in the U.S.? In short there are two key reasons:

  1. U.S. economic data has continued to surprise on the upside. The unemployment rate has dropped back to 4.1%; inflation has continued to moderate back towards the Fed’s 2% target; and real GDP growth is running above trend at just a shade under 3%.
  2. In October polls showed momentum was swinging towards Donald Trump and a Republican win in the November U.S. election (which, unless you’ve been hiding under a rock has subsequently been proven right with a big win earlier this month). Trump’s policy platform of tariffs, reduced immigration and tax cuts are all inflationary, so markets started pricing in higher rates. The day after the election, November 6, when it was clear Trump had won, the U.S. 10-year jumped 0.16%. Most of this rise came from higher inflation expectations (10-year breakeven inflation expectations).

A natural hedge

For Australians invested in unhedged global shares (such as those in Ophir Global Funds), October’s pullback in global share markets, and more specifically the U.S. share market, was totally offset by a big fall in the Aussie Dollar versus the U.S. Dollar.

The benchmark for our Global Funds, the MSCI World SMID Cap Index posted a negative total return of -2.6% in October. But when converted to $AUD, it rose +3.1%.

Being unhedged for your global shares is usually a positive for Australian investors during declining markets. When global shares fall, the Australian Dollar often (though not always) also falls.

October 2024 Ophir Fund Performance

Before we jump into the Letter in more detail, we have included below a summary of the performance of the Ophir Funds during October. Please click on the factsheets below if you would like a more detailed summary of the performance of the relevant fund.

The Ophir Opportunities Fund returned +5.1% net of fees in October, outperforming its benchmark which returned +0.8%, and has delivered investors +22.9% p.a. post fees since inception (August 2012).

🡣 Ophir Opportunities Fund Factsheet

The Ophir High Conviction Fund (ASX:OPH) investment portfolio returned +3.7% net of fees in October, outperforming its benchmark which returned -0.8%, and has delivered investors +13.6% p.a. post fees since inception (August 2015). ASX:OPH provided a total return of +0.0% for the month.

🡣 Ophir High Conviction Fund Factsheet

The Ophir Global Opportunities Fund returned +3.4% net of fees in October, outperforming its benchmark which returned 3.1%, and has delivered investors +15.9% p.a. post fees since inception (October 2018).

🡣 Ophir Global Opportunities Fund Factsheet

The Ophir Global High Conviction Fund (Class A) returned +3.3% net of fees in October, outperforming its benchmark which returned +3.1%, and has delivered investors +10.7% p.a. post fees since inception (September 2020).

🡣 Ophir Global High Conviction (Class A) Fund Factsheet

The Ophir Global High Conviction Fund (Class B) returned +3.2% net of fees in October, outperforming its benchmark which returned +3.1%, and has delivered investors +21.3% p.a. post fees since inception (June 2023).

🡣 Ophir Global High Conviction (Class B) Fund Factsheet


Two charts you should know about

Before we get into our stock in focus for the month, we wanted to highlight two quick charts we think you should know:

1. Ophir Global Funds: A strong year driven by stock picking

The Ophir Global Opportunities Fund and the Ophir Global High Conviction Fund had a tough late 2021 and early 2022 when interest rates ripped higher and small-cap growth valuations got torched. But over the last year their performance has surged.  While their benchmark, the MSCI World SMID Cap Index NR (AUD), was up about 26% in the last 12 months to the end of October, both Funds were up about 46%. That’s about 20% outperformance!

So what drove that outperformance?

Source: Ophir & Bloomberg. Data as of 31 October 2024.

In the chart above we show how $100 invested a year ago into the Ophir Global High Conviction Fund has grown versus the same investment into our official benchmark. We’ve also included different size (mid, SMID, small, micro) and style (growth & value) indices.

It’s clear that the last year’s outperformance was not due to size factors – as you can see mid, SMID and small caps all performed similarly and were lagged by microcaps. Growth and Value styles of investing also provided very similar results.

So Ophir’s small-cap growth company bias didn’t generate the outperformance.

What was it then?

It was good old-fashioned stock picking.

All the top contributors to performance beat the markets expectations on their earnings results and raised guidance for future results. That’s exactly what our investment process targets and that – rather than size or style – is the most sustainable form of outperformance for our funds.

2. The valuation ‘catch up’ still hasn’t happened

Some investors might have been wondering if the Ophir Global Funds’ strong performance over the last year was because small-cap valuations simply caught up with the stocks that have led this bull market since 2022 – ie. large caps and the Magnificent 7?

Source: Ophir and Bloomberg. Data to 31 October 2024.

But as you can see in the chart above, both small (gold line) and large (grey line) caps have both benefited from valuations (here price to earnings ratios) increasing. Yet the gap (shaded area) has not closed.

So, it’s still highly likely there is a period ahead in the next five years where small caps will catch up and outperform large caps due to their much cheaper starting valuations.

On a relative basis, small caps are the cheapest they have been in a quarter century and to us they represent a once in a generation relative opportunity to large caps. This year’s strong performance in the Ophir Global Funds has not changed that.

Stride: The company no fundie wanted to see

In January 2021 vaccines were rolling out, people were starting to travel again; and the share market had flipped back from ‘stay at home’ stocks to the ‘re-opening trade’. That was when we attended the Needham Growth Conference in New York and found one of our best stocks of the last few years.

The Needham Conference is one of the biggest small-cap investment conferences. Fund managers were lining up to meet the management of companies primed to capitalise on the tidal wave of services spending as consumers emerged from hibernation.

So, what did we do?

We asked the conference organisers: “What are the companies at the conference with the least requested number of meetings by fundies?”

The company that no one wanted to see was Stride (NYSE:LRN). Stride provides online education solutions to kindergarten through Year 12 students in the U.S. and their solutions are used in the classroom. But originally and still, they are used by students homeschooled for various reasons including bullying, parental preferences; even for child actors.

When we were all going to ‘work from home’ during COVID, students were going to ‘learn from home’. Stride’s share price rocketed from around US$20 to over US$50 between March and August 2020 as demand, and expectations of demand, for their products and services ballooned.

But by January 2021, the time of the Needham Conference, the balloon had popped. As students returned to school, investors thought there’d be no durable increase in demand, so Stride’s share price returned to US$20. In any case, fundies had turned their attention elsewhere.

What we found when we decided to dance with the ‘wallflower’ Stride

Stride was the proverbial ‘wallflower’ at the prom. But we decided to dance with Stride and we found:

  • A company structurally benefitting from increasing adoption of virtual schooling more generally (despite schools having been reopened), which could lead to sustained growth in a market in which Stride was a leader.
  • Defensive revenue growth of 8-10% revenue, underpinned by state government budgets that fund the 70 schools across 35 US states in which Stride had solutions.
  • This was flowing through at high incremental profit margins, driving what we expected would be 20%+ earnings growth.
  • A depressed EV/EBITDA (Enterprise Value to Earnings Before Interest Tax Depreciation and Amortisation) valuation multiple of just 5x.

Of course, we never just take what the company says at face value, so we got to work. We checked data around individual school’s login traffic; called enrolment centres for intel, including the number of open enrolment applications; spoke to public and private school peers around market share changes; and spoke with school district budget allocators to ensure funding was rock solid.

We initially bought Stride later in January 2021 between US$22-25. And we have held ever since, building our conviction and knowledge around the business.

And boy has it delivered. From financial year 2020 through to 2024 it has:

  1. Doubled revenue from US$1.04 billion to US$2.04 billion
  2. Improved EBITDA margins from 11% to over 18%, and
  3. 10x’ed profit from US$24.5 million to US$240 million (12 months to Sept 2024)

Fuzzy Panda tests our conviction

But then last month our conviction was really tested.

Fuzzy Panda (FP) – no not a Sesame Street character, but a well-known short-selling organisation – released a report on the 16th October dubbing Stride “the last COVID over earner”.

The stock tanked over -9% on the day, but Stride was down -24% if you include the falls leading up to the report, when FP was clearly putting on their short position.

FP was essentially claiming that Stride was a big beneficiary of the US$190 billion in Federal emergency relief funding program for U.S. schools during COVID. The funding was ending in September 2024 and FP warned Stride’s profits were about to “fall off a COVID cliff”.

Australian investors in ASX listed companies probably aren’t that used to “short reports” as they’re not that prevalent domestically. However, they are big business in the U.S. and par for the course if you’ve been investing there long enough. The playbook is simple.

Take a short position, put out a scary short report questioning the company’s profits, many investors shoot first dumping the stock (regardless of the merits of the short report), the shorter closes the short by buying back the stock at the now lower price, pocketing a tidy profit.  Sometimes there is merit to the short report, sometimes it’s just hot air.

Over the last three years we have owned the stock we have spoken with Stride’s management on multiple occasions each quarter. We have found them diligent, trustworthy and conservative.

But we also did more work.

We already knew from the publicly available individual school budgets that the federal COVID funding was used to offset funding from the states during COVID. But we also went through the corresponding publicly available state budgets in detail that showed the states were increasing their education spend to offset the federal grant funding that was ceasing. So, this gave us comfort there was no big looming funding shortfall from state schools for Stride’s offering. This gave us the conviction to hold through the short report.

When Stride reported its September quarter results aftermarket on the 22nd of October, it blew the market’s expectations away. both at a revenue and profit level.

The next trading day the stock popped around +40%!

Source: Ophir & Bloomberg. Data as of 31 October 2024.

The future of Stride

So where to next for Stride?

Even though they are the largest online education provider in the U.S. by enrolment, they are still very underpenetrated across schools. They can also fuel growth by entering or expanding into education verticals including:

  1. Experiential learning: Through extended, augmented and virtual reality modes; AI voice and chat learning software; and games and simulation teaching solutions.
  2. Learning support: Building out their tutoring business which we think could add 30-40%+ to today’s earnings over the medium to longer term, given their existing relationships with students and teachers.
  3. Workforce and talent development and acquisition: Providing certifications to the increasing number of U.S. high school leavers who are shunning four-year college degrees and opting instead to directly enter jobs. Stride already owns a business called Tallo, which connects students from Stride-powered schools to opportunities (the Tallo app has 1.7million users already!).

A long career ahead

Today, Stride is still growing earnings at 20%+. That’s two to three times the market’s growth. Yet it operates in a defensive end market with a large share of its revenues underpinned by state government education budgets. It’s a great all-weather stock.

But its valuation is lower than the market. Stride trades on a still cheap 13x price to earnings ratio. Most of the share price move since we have owned has actually been driven by earnings growth and not valuation expansion. We think it could still be a 20x P/E business.

So while it’s been a great performer for our Funds, we still think there is a long ‘career’ ahead for Stride.

…the hard work pays off

It would have been easy to crack during the Fuzzy Panda short drama and sell Stride.

The only way to know whether to ‘keep the faith’ or to ‘fold’ is to put in the work and back yourself. It won’t always work out on your side, but if you go the extra mile, it will more often than not.

We are proud of the team and the work they have done which allowed us to keep our conviction in Stride.

We’re also glad we took that meeting that no one else wanted back in 2021!

As always, thank you for entrusting your capital with us.

Kindest regards,

Andrew Mitchell & Steven Ng

Co-Founders & Senior Portfolio Managers

Ophir Asset Management


This document is issued by Ophir Asset Management Pty Ltd (ABN 88 156 146 717, AFSL 420 082) (Ophir) in relation to the Ophir Opportunities Fund, the Ophir High Conviction Fund and the Ophir Global Opportunities Fund (the Funds). Ophir is the trustee and investment manager for the Ophir Opportunities Fund. The Trust Company (RE Services) Limited ABN 45 003 278 831 AFSL 235150 (Perpetual) is the responsible entity of, and Ophir is the investment manager for, the Ophir Global Opportunities Fund and the Ophir High Conviction Fund. Ophir is authorised to provide financial services to wholesale clients only (as defined under s761G or s761GA of the Corporations Act 2001 (Cth)). This information is intended only for wholesale clients and must not be forwarded or otherwise made available to anyone who is not a wholesale client. Only investors who are wholesale clients may invest in the Ophir Opportunities Fund. The information provided in this document is general information only and does not constitute investment or other advice. The information is not intended to provide financial product advice to any person. No aspect of this information takes into account the objectives, financial situation or needs of any person. Before making an investment decision, you should read the offer document and (if appropriate) seek professional advice to determine whether the investment is suitable for you. The content of this document does not constitute an offer or solicitation to subscribe for units in the Funds. Ophir makes no representations or warranties, express or implied, as to the accuracy or completeness of the information it provides, or that it should be relied upon and to the maximum extent permitted by law, neither Ophir nor its directors, employees or agents accept any liability for any inaccurate, incomplete or omitted information of any kind or any losses caused by using this information. This information is current as at the date specified and is subject to change. An investment may achieve a lower than expected return and investors risk losing some or all of their principal investment.  Ophir does not guarantee repayment of capital or any particular rate of return from the Funds. Past performance is no indication of future performance. Any investment decision in connection with the Funds should only be made based on the information contained in the relevant Information Memorandum or Product Disclosure Statement.

Previous

18 Nov, 2024 How will Trump’s epic win affect the share market?

Next

11 Dec, 2024 What’s caused the recent outperformance in our Global Funds?
18 Nov, 2024

How will Trump’s epic win affect the share market?

Investment Strategy • 5 mins read

Back to Insights Back to Insights

🡣 Download PDF


On the 5th of November 2024, U.S. voters resoundingly elected Donald Trump as the nation’s 47th President.

New governments inevitably bring about change. In most instances new policies are forgotten and business continues as before.

Yet sometimes a new government can attempt radical reform – such as the repeal of the Glass Steagall Act or the implementation of the Affordable Care Act (Obamacare) – that may require a total reassessment of the opportunities and risks facing listed companies.

Not only has Trump won the Presidency, but the Republican Party appears on track to control both the House and Senate. A clean sweep could pave the way for Trump to implement radical reform and upend the outlook.

In the lead-up to the election, the tightness of the race resulted in some market swings as the probabilities of outcomes shifted between candidates, but overall, markets didn’t see a significant amount of volatility. However, since the election, the Trump trade has been well and truly on.

Source: Ophir, Bloomberg.

But do elections really alter the fortunes of equities, particularly when the governing party changes? And should investors be concerned about the potential impact of the Trump victory on the stock market and other markets?

The impact of elections on equities

We looked at how the S&P500 Index traded through each U.S election since 1960. The period covers 16 elections, with nine Democrat wins and seven Republican victories.

As you can see, on average, the S&P500 rose 10.2% in the first twelve months following a U.S. election. When the government changed hands, the increase in the S&P500 was less material at 6.0%.

Interestingly, in the first year following a Democratic win, the S&P500 index has generated stronger returns than a Republican win. This may sound counter-intuitive, as conventional wisdom suggests Republicans are better for markets given their pro-business stance.

Source: Ophir, Bloomberg.

As we look deeper into the data, the return profiles following elections since 1984 have been more attractive, with the same Democrats vs Republican trends holding true.

Source: Ophir, Bloomberg.

Presidential performances

Typically, a change in government is good for U.S. equities, which can be seen in the chart below.

However, individual terms and specifically the first year following an election can be heavily influenced by idiosyncratic factors that aren’t necessarily linked to the governing party:

  • Bill Clinton’s two terms in office saw the fastest market rally. The S&P500 gained of 203% over eight years. The rally was fuelled by the repeal of the Glass-Steagall Act, which allowed commercial and investment banks to merge and expand financial product offerings.
  • During Barak Obama’s term the S&P gained 148% gain in a post-GFC rally. Had the financial crisis occurred during Obama’s tenure (instead of just before), it would have weighed down the market returns through his term.
  • Under Ronald Reagan, the market rose 105% with the Black Monday crash of 1987 causing the underperformance.
  • The Iraq war and the September 11 attacks dragged the market down 32% under Bush Jr.

What policies is Trump looking to implement?

Now that Trump has won the presidency and likely both chambers of Congress, he has a platform to enact sweeping and impactful change.

Trump plans include, but are not limited to:

  • Reduced Corporate tax rates
  • Reduced personal taxes through reduced social security taxes, no tax on tipped income or overtime pay as well as reductions for first responders and military.
  • Increased tariffs, particularly on China.
  • Propping-up fossil fuel industries, particularly oil and gas.
  • Potential deportation of unauthorised immigrants.
  • Mixed outcomes on defence with a potential pull back from Ukraine and Europe more broadly, but a likely redirection towards China.
  • Building a U.S. Strategic Bitcoin Reserve of 1 million Bitcoin over the next 5 years.

Resulting from these policies we could see:

  • Upward pressure on inflation, reducing the rate in which the Federal Reserve will cut rates.
  • A strengthening in the U.S. Dollar as higher rates makes the U.S. relatively more attractive for investors seeking higher yields.
  • Deregulation will benefit sectors including financial services, technology and fossil fuels. The Trump campaign, for example, promised to reduce environmental protection and expand U.S. energy production (oil and gas drilling).
  • Ongoing support for cryptocurrency markets

How will Trump’s victory impact small caps?

As highlighted above, markets reacted positively to the Trump Presidency with the S&P500 up 3.5% and the Rusell 2000 up 5.8% in the week since the election.

Michael Kantrowitz at Piper Sandler and Co points out this is the fourth time small caps have seen an outperformance spike compared to large caps more recently. This has been driven by multiple expansion, with the market pricing in a better outlook for growth and earnings.

Source: Piper Sandler & Co, November 2024

So why do we think this time is different to the last three?

Given the protectionist nature of Trump policies, this should support U.S. companies who operate domestically. By their nature this tends to favour smaller companies that haven’t yet grown enough to justify offshore expansion.

While increased inflationary pressures from Trump’s policy agenda could impact the profit margins of smaller companies, this will likely coincide with an improved growth outlook. Against this backdrop, we believe strong top-line trends could drive upwards EPS revisions across the Russell 2000. Should this transpire, it could act as the catalyst for the significant valuation gap between large and small caps to begin to close.

At Ophir we focus on businesses with resilient earnings that can perform throughout market cycles. Our positioning remains a mix of cyclical and defensive names, and we have high conviction that our Funds will perform through the market cycle.

Previous

17 Oct, 2024 Letter To Investors - September

Next

18 Nov, 2024 Letter To Investors - October