21 Jan, 2026

Letter to Investors - December 2025

Letter to Investors • 10 mins read

Back to Insights Back to Insights

The missing ingredient for small cap outperformance is here.


PDF


The 2025 narrative rollercoaster

With Trump 2.0 at the helm of the world’s largest economy, many investors expected 2025 to be a wild ride and boy, it certainly did not disappoint.

Shifting investor narratives were enough to cause whiplash, turning the morning headline check here in Australia into a real rollercoaster.

Consider just some of the questions that were crammed into a single year:

Is the U.S. headed for a recession?

Does Trump want to tank the U.S. economy to drive rates lower?

Does Trump want to run the economy hot, caring less about returning inflation to target?

Are we in a market bubble? Or maybe just an AI bubble?

Will the Fed Chair be fired, or will the Fed lose its independence?

How high will U.S. tariffs go, and what will that mean for growth and inflation?

Is rising U.S. imperialism hurting its investability?

Is World War III about to start?!

Are all our jobs going to be replaced by AI?

Despite all that, including a -19% drawdown in April after Trump’s Liberation Day tariff announcements, the S&P 500 put on a very healthy +16.4% in 2025. This followed gains of +23.3% and +24.2% gains in 2024 and 2023. It has been a very good few years for global share market investors, particularly those exposed to U.S. large caps, more specifically, mega cap tech companies.


New year, same winners

Perhaps the most surprising thing is that, despite the macro and political volatility dominating headlines, you were better off throwing your crystal ball in the bin at the start of 2025 and simply sticking with what had worked in 2024 and 2023.

As shown below, U.S. large caps again outperformed mid and small caps, while growth orientated stocks outperformed value.

On a sector basis, the winners were once again familiar, with Technology (think Nvidia, Apple, Microsoft) and Communication Services (think Google & Meta) coming out on top.
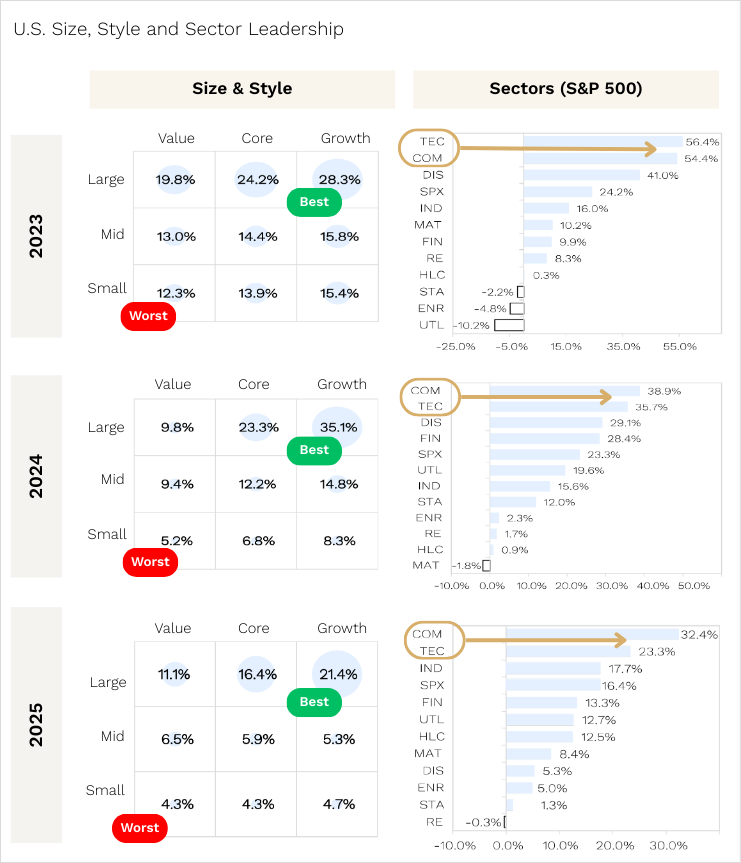
Source: Piper Sandler, Ophir.

BUT, we do not see 2026 as a “Connect 4” year where the same large cap growth playbook delivers a fourth consecutive year of outperformance. We unpack why a little later.

First though, despite U.S. and global small caps underperforming large caps again in 2025, we want to highlight what drove the larger than normal outperformance across our global funds.


2025 Ophir performance highlights

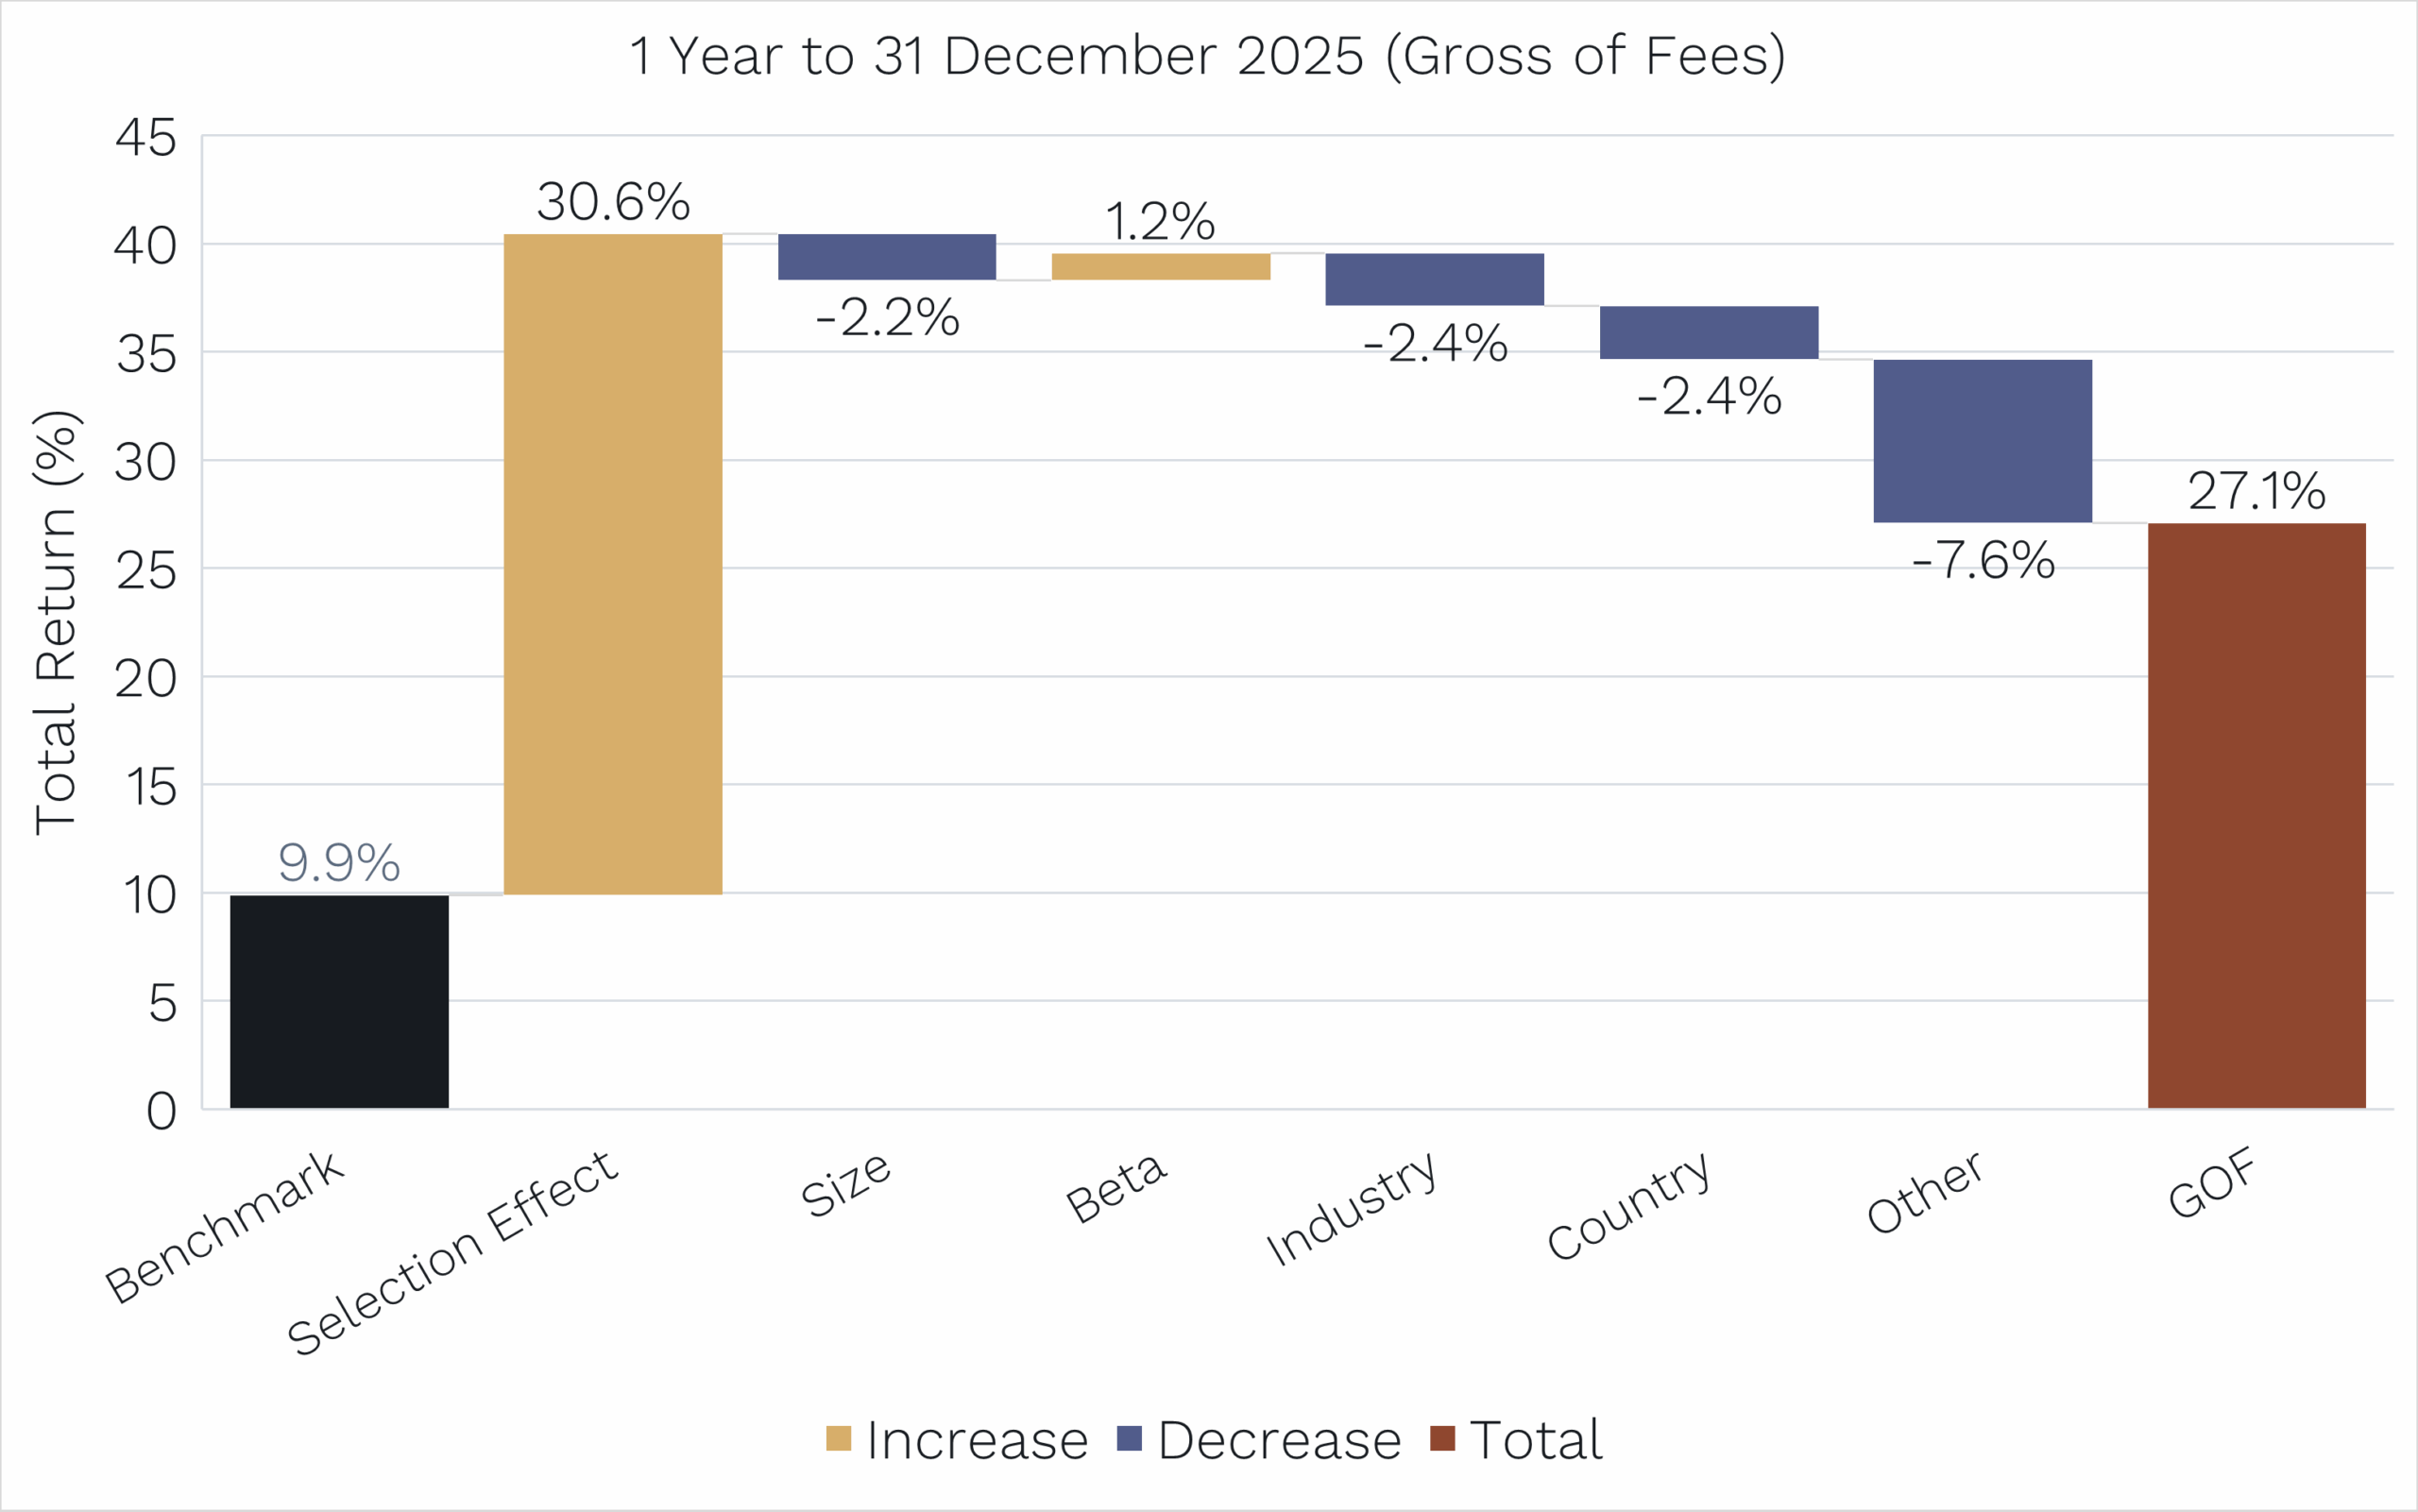
Enter the multi-factor performance attribution we have been sharing with investors over the last few years. In 2025, our Global Opportunities Fund returned +27.1% before fees (+25.6% after fees) compared with its benchmark, the MSCI World SMID Cap Net Return Index (in AUD) which returned +9.9%.


Global Opportunities Fund: Multi Factor Attribution
Source: Ophir, Bloomberg, Citi. Past performance is not a reliable indicator of future performance.

Crucially, this outperformance was not driven by tailwinds from industry or country skews, nor by a bias towards small companies relative to the benchmark. In fact, all of the typical factors or characteristics monitored by our performance attribution software detracted from returns in aggregate.

Instead, “Selection Effect” or stock-picking, accounted for more than 100% of the outperformance, contributing +30.6% of the +17.2% excess return.

As regular readers will know, this is great news.

It confirms that our bottom-up due diligence is doing the heavy lifting, rather than returns being boosted by unintended factor exposures or “free kicks”.

Another stand out feature of the Global Opportunities Fund’s performance in 2025 was how it behaved in both rising and falling markets.

While the return profile remained consistent with our long term style, it was even better than usual.

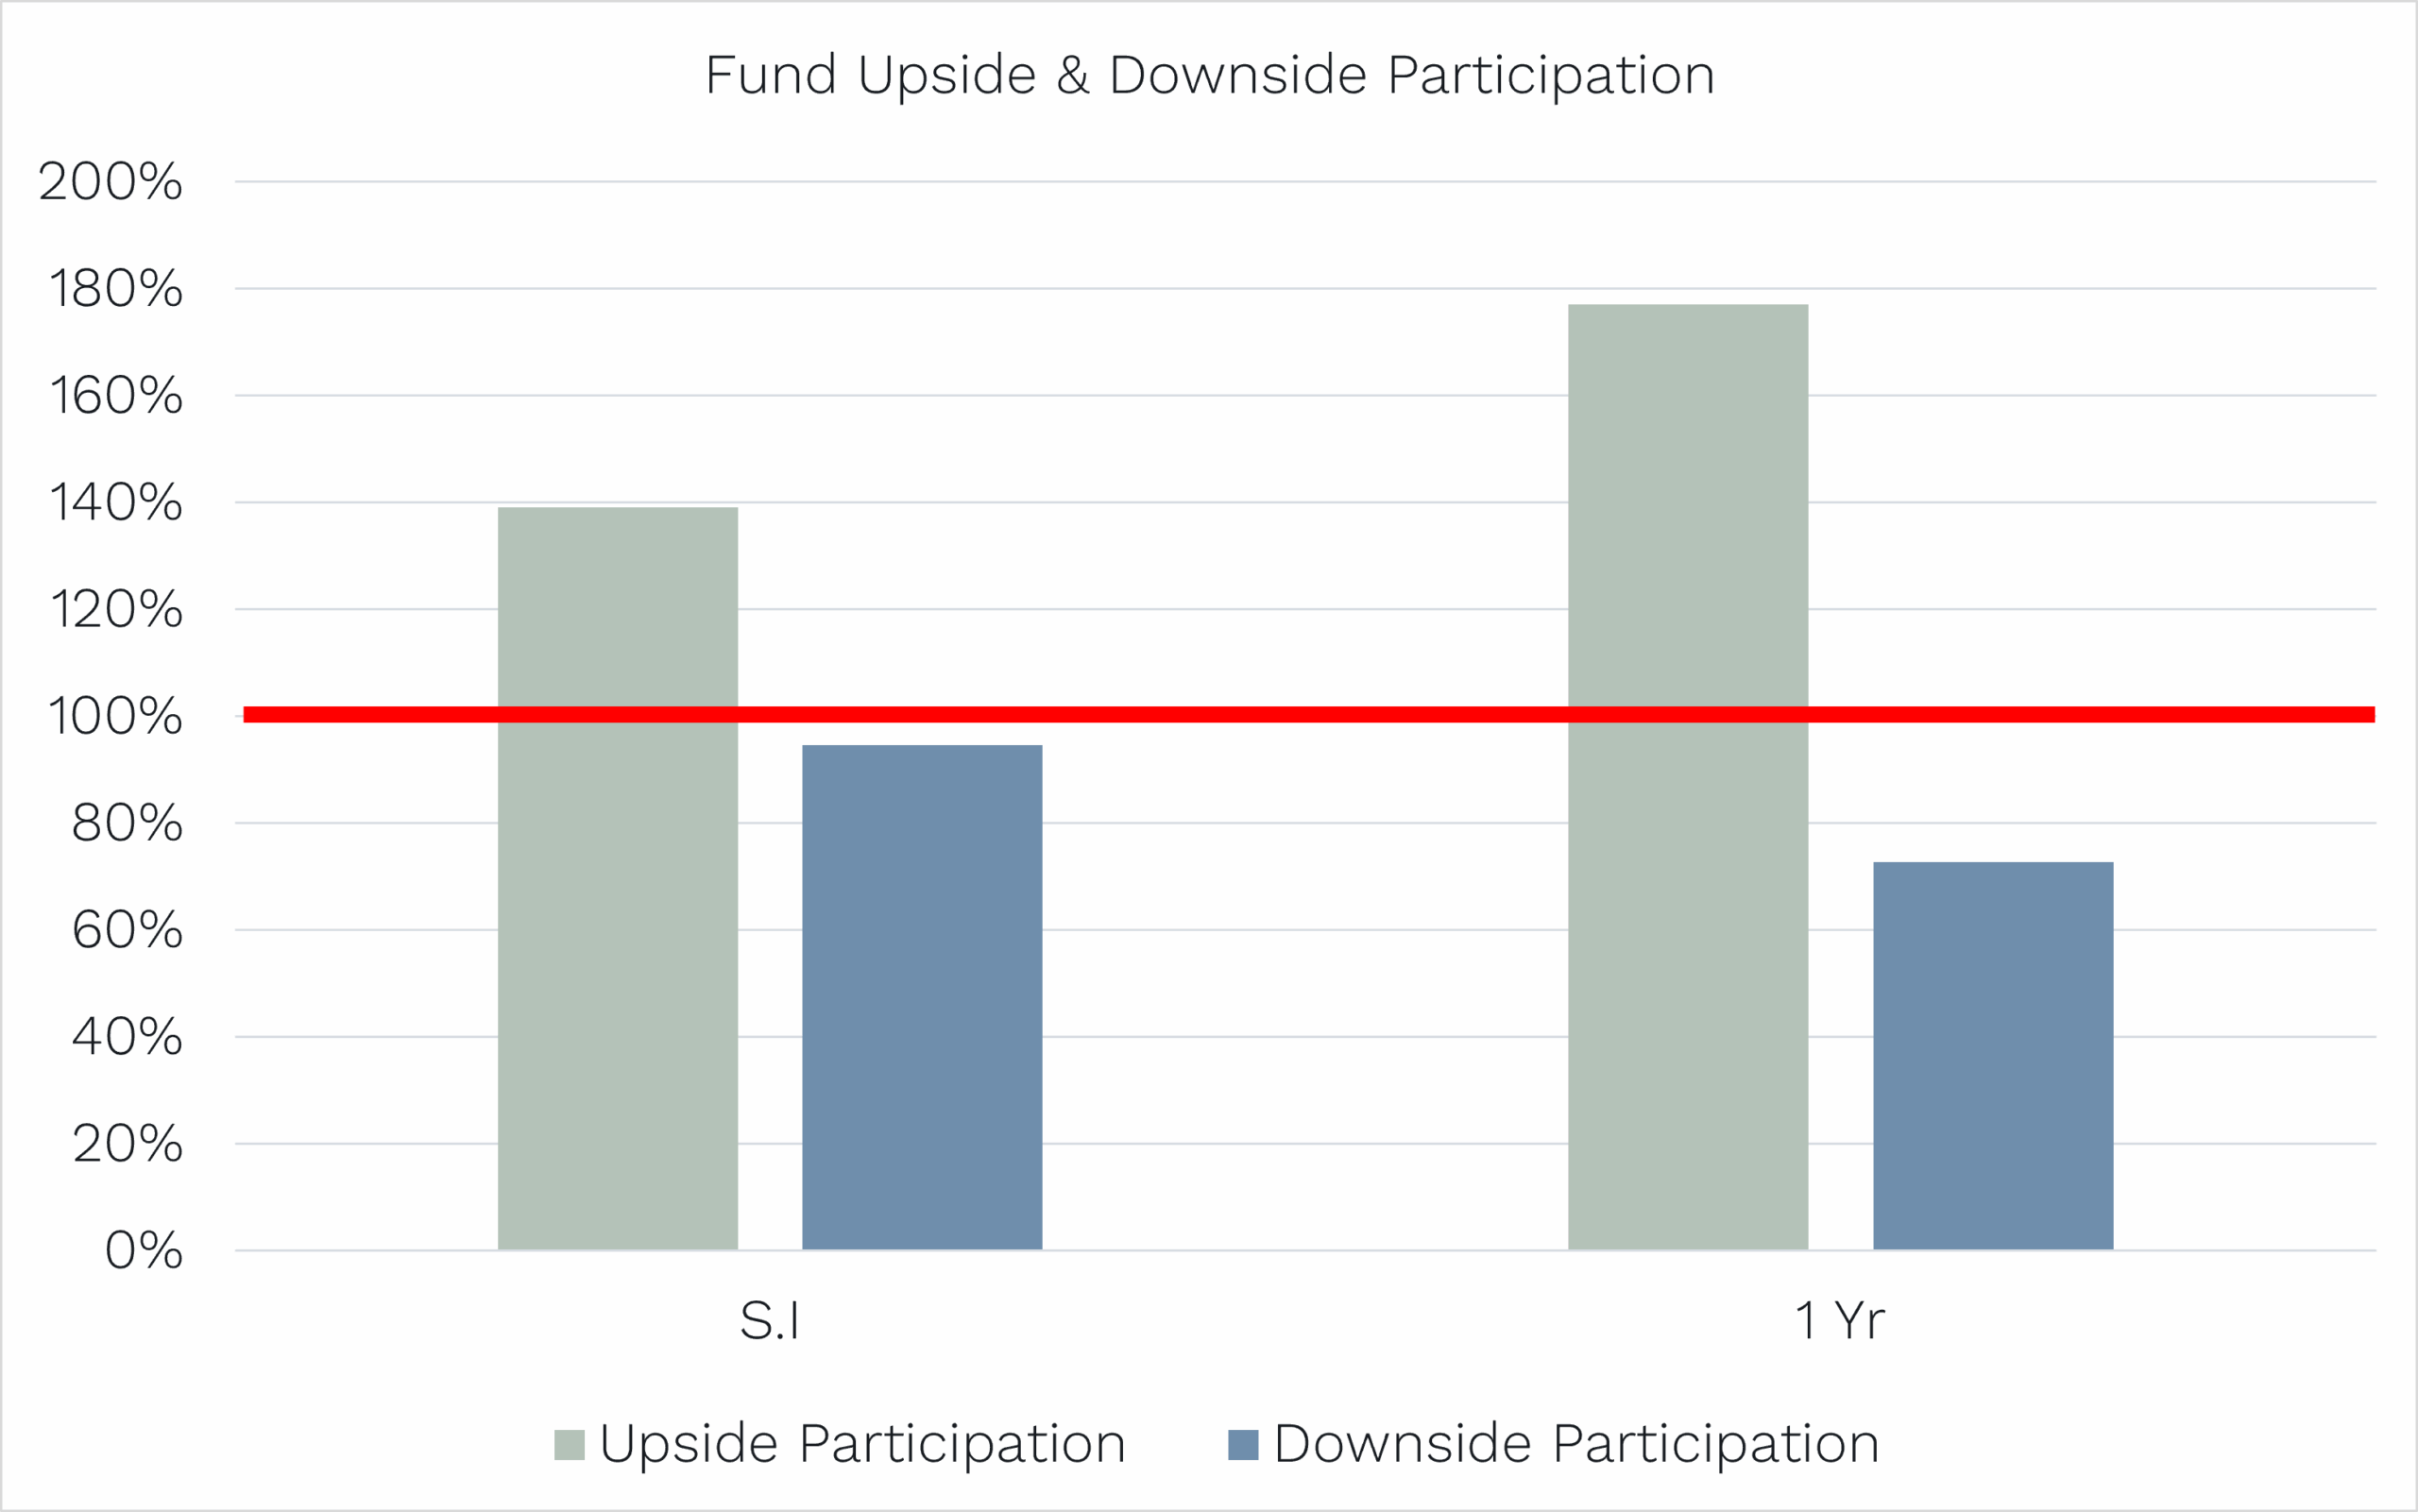
As shown below, since inception “S.I” (October 2018), in months when the benchmark has risen, the fund has delivered, on average, around 140% of the benchmark’s return.

For example, if the benchmark rose by +1.0% in a month, the fund rose by around +1.4% on average. This highlights our tendency to outperform in rising markets.


Global Opportunities Fund: Outperforming in up markets & protecting capital in down markets
Source: Ophir, Citi. Past performance is not a reliable indicator of future performance.

On the flip side, in months when the market has fallen, the fund was down only around 95% of the benchmark on average.

Or for example, if the benchmark fell -1% in a month, we fall around -0.95% on average. This means, on average, we fall less in down markets.

The key takeaway here is that we generally outperform by more in up markets than we tend to outperform in down markets, while still delivering outperformance across both environments. This characteristic is shared across all Ophir funds.

In 2025, this profile was even more favourable. The Global Opportunities Fund captured almost 180% of the upside, well above the long term average of 140%. On the downside, it fell only 73% of the market on average, compared with the long term average of 95%.

The result was a smoother and more attractive experience for investors over the year, something we continually seek to improve.

And finally, on the topic of investor experience, we want to highlight progress in an important statistic called “Tracking Error“, a statistic closely watched by sophisticated institutional allocators, such as large superannuation and pension funds, which has almost halved over recent years – a great thing!

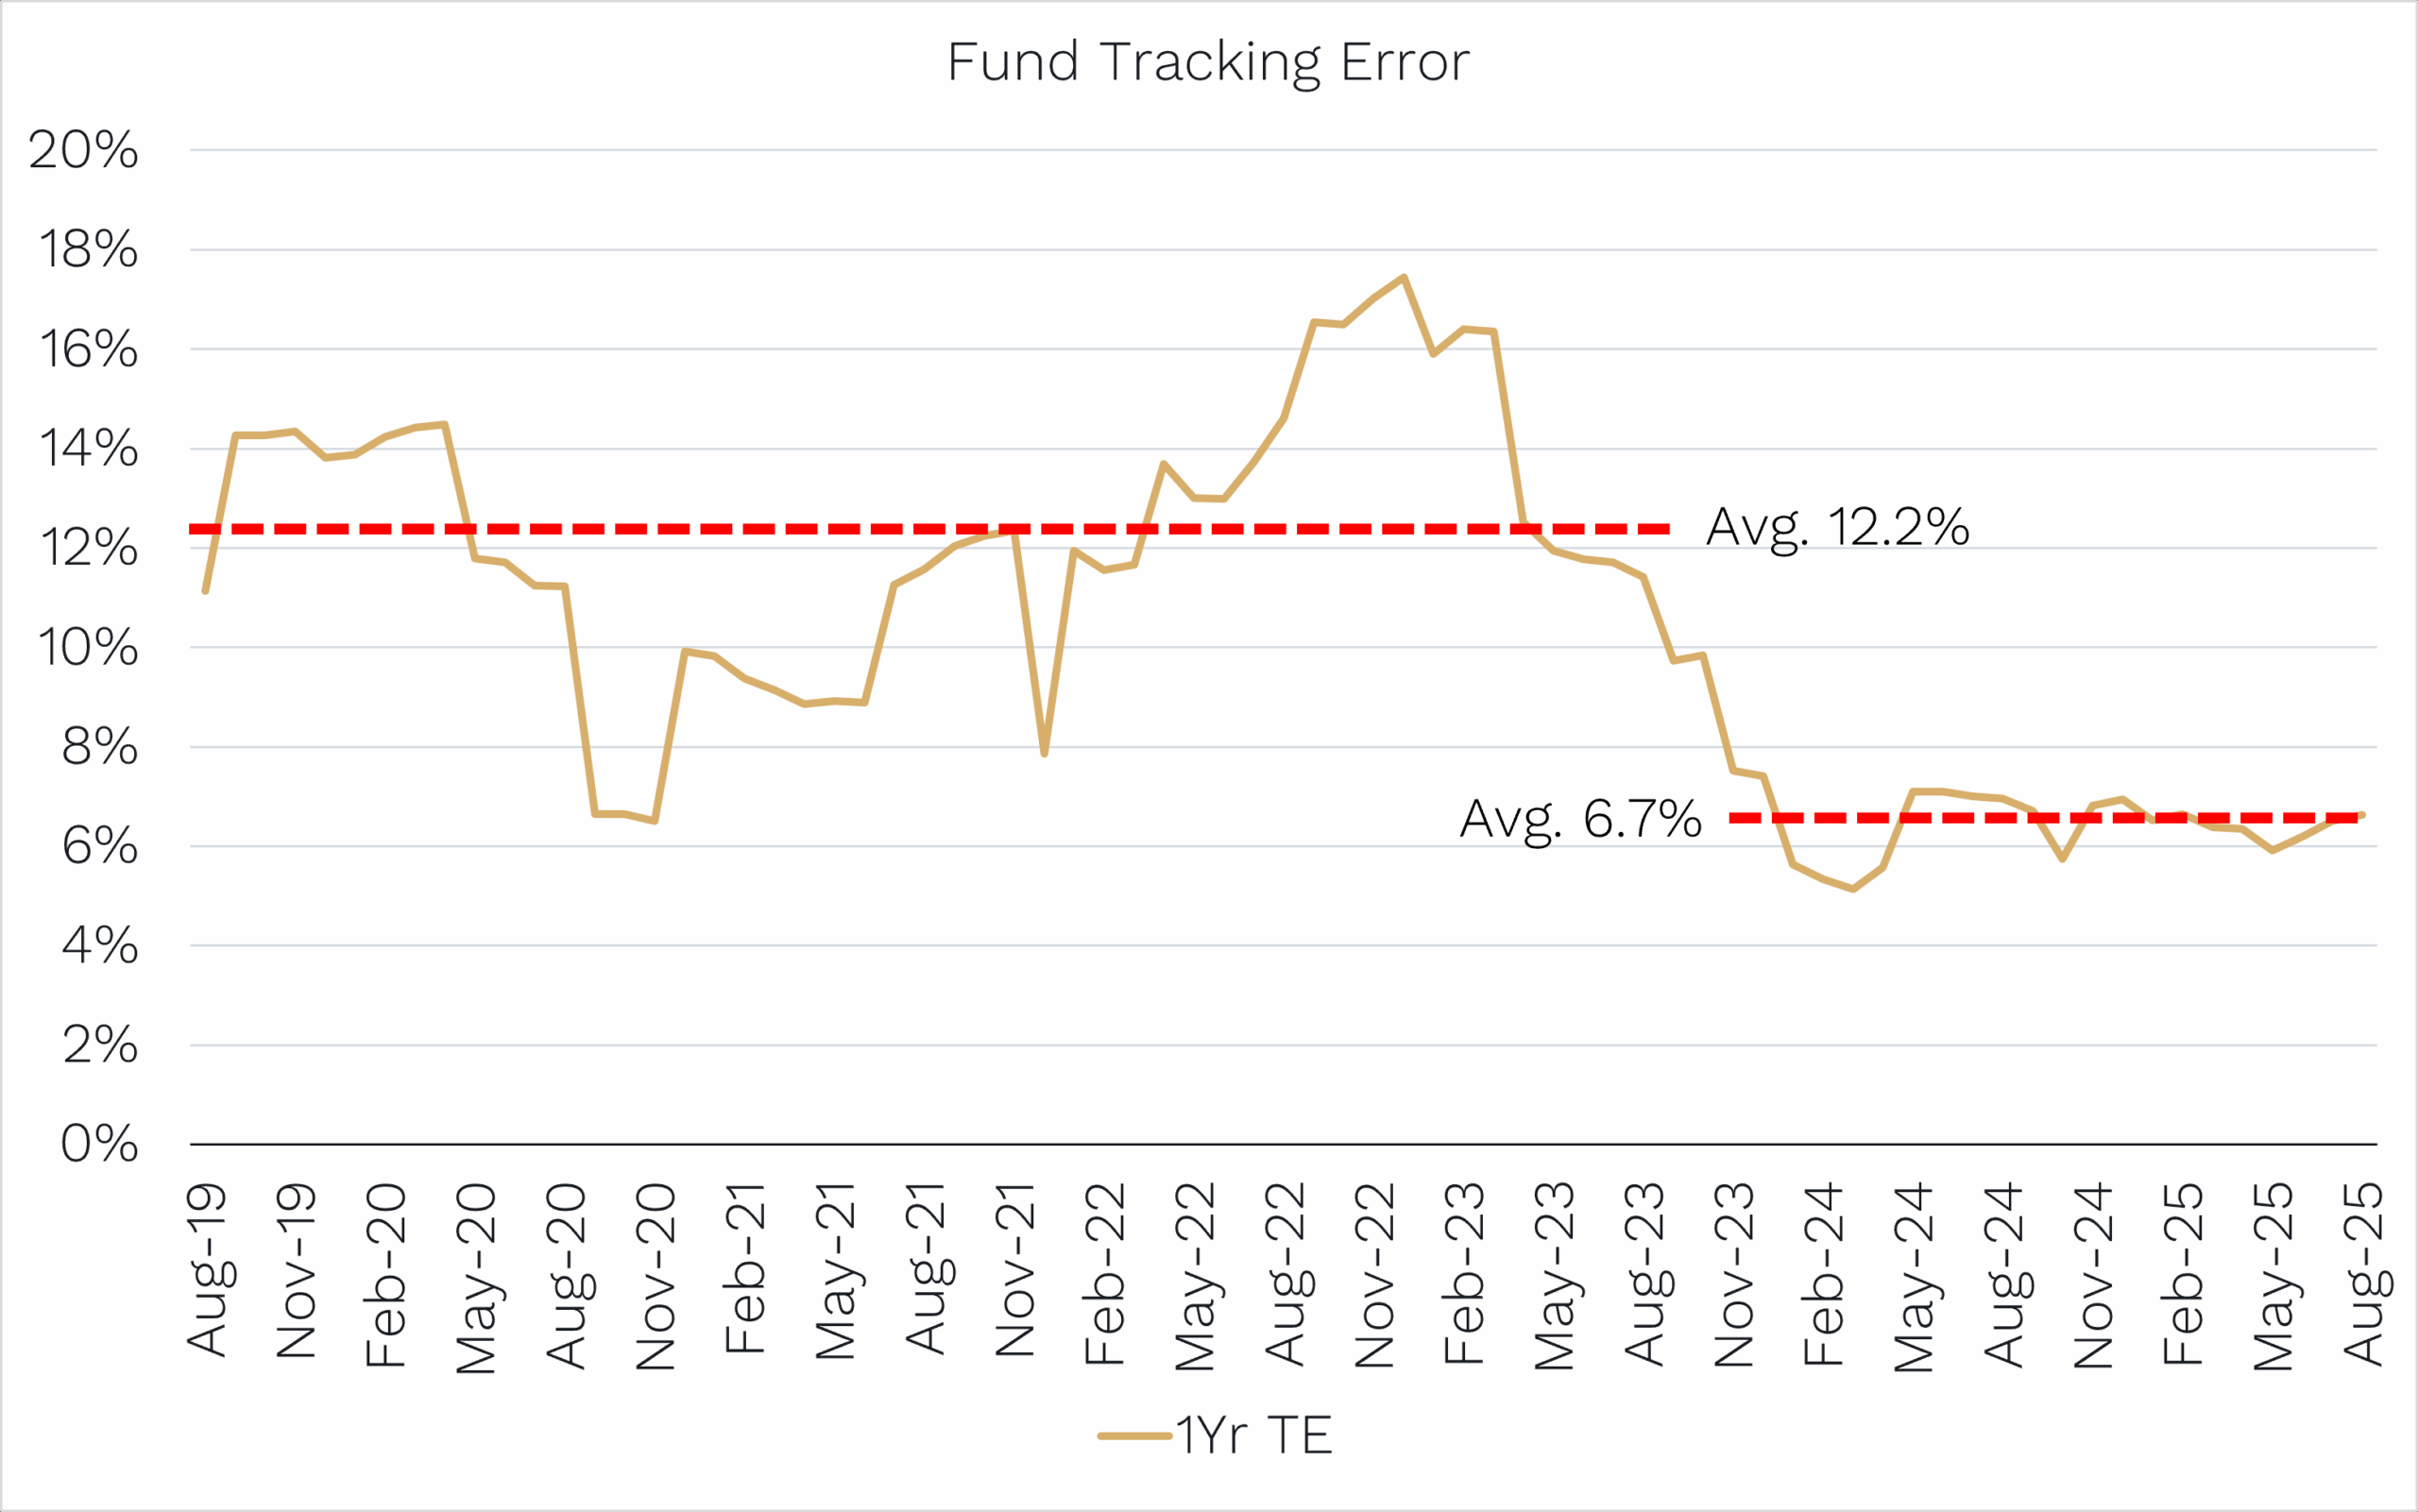
What is tracking error? Put simply, it measures the volatility of a fund’s monthly outperformance or underperformance relative to its benchmark.

For example, in December the Global Opportunities Fund (Class A) returned +1.6% compared with a benchmark return of -0.8%, meaning an outperformance of +2.4%. Tracking error measures how consistent or variable those monthly relative returns are over time [1].

Clearly investors want outperformance, but they also want that outperformance to be delivered consistently. More stable relative returns are generally viewed as more reliable than returns driven by a small number of exceptional months.

Looking at the rolling one-year returns for the Global Opportunities Fund, the volatility of relative performance (1 year tracking error) has fallen sharply to around 6 to 7% per annum, compared with around 12% per annum in the early years of the fund.

Importantly, this improvement has not come at the expense of returns.

Over the past three years, the fund has outperformed its benchmark by +10.9% per annum after fees, delivering +26.0% per annum versus +15.1% per annum. Since inception in 2018, outperformance has averaged +9.4% per annum after fees, with returns of +18.5% per annum versus the benchmark’s +9.1% per annum.

More outperformance, delivered more smoothly. That’s something every investor wants.


Global Opportunities Fund: Volatility of out/underperformance almost halved
Source: Ophir, Citi. Past performance is not a reliable indicator of future performance.


The Missing Ingredient: Earnings

There is no shortage of geopolitical risks for investors to digest, from ICE raids in Minnesota, to the toppling of a dictator in Venezuela, and the prospect of military action involving Iran and Greenland, to name just a few.

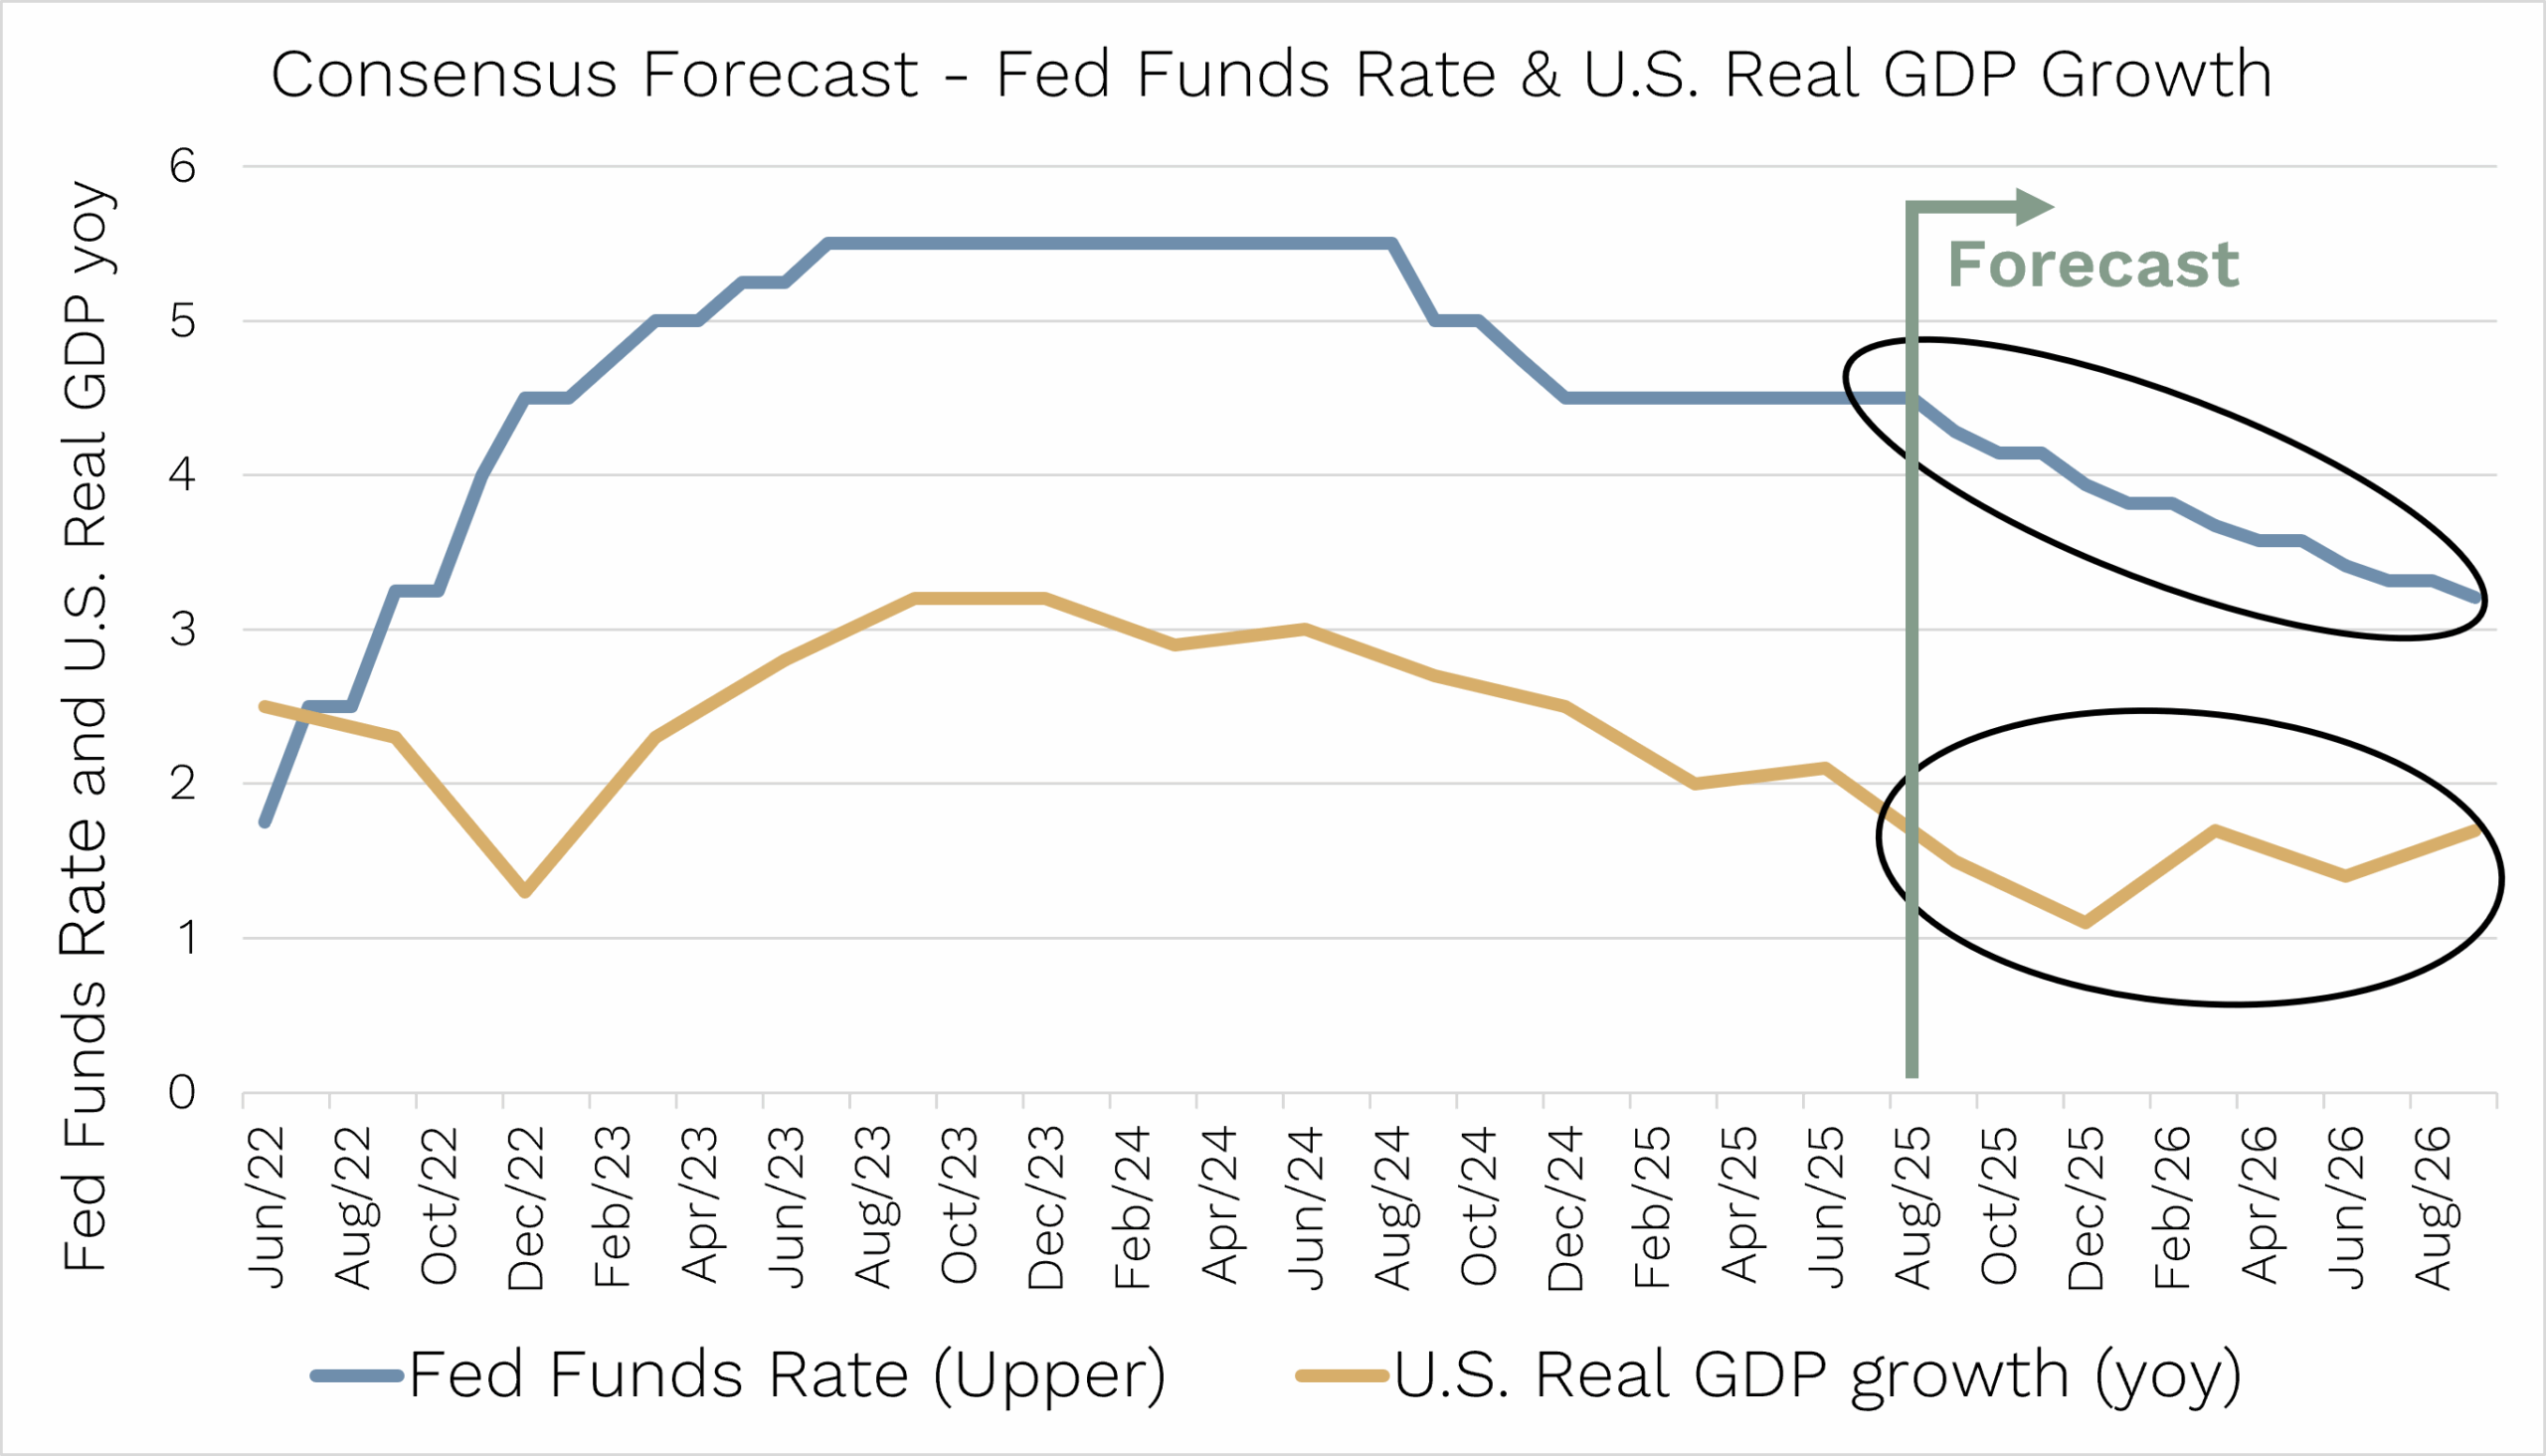
From an economic perspective, however, particularly in the U.S. as the world’s primary growth engine, there are several positives supporting ongoing equity market strength:

  • The lagged effect of Fed interest rate cuts with the potential for more to come;
  • Falling oil prices which effectively act as a tax cut for consumers;
  • Large tax refunds flowing to U.S. households, alongside accelerated depreciation for capex and R&D expenditure under Trump’s One Big Beautiful Bill;
  • Ongoing deregulation, with the likelihood of further stimulus and affordability measures ahead of the U.S. mid term elections in November.

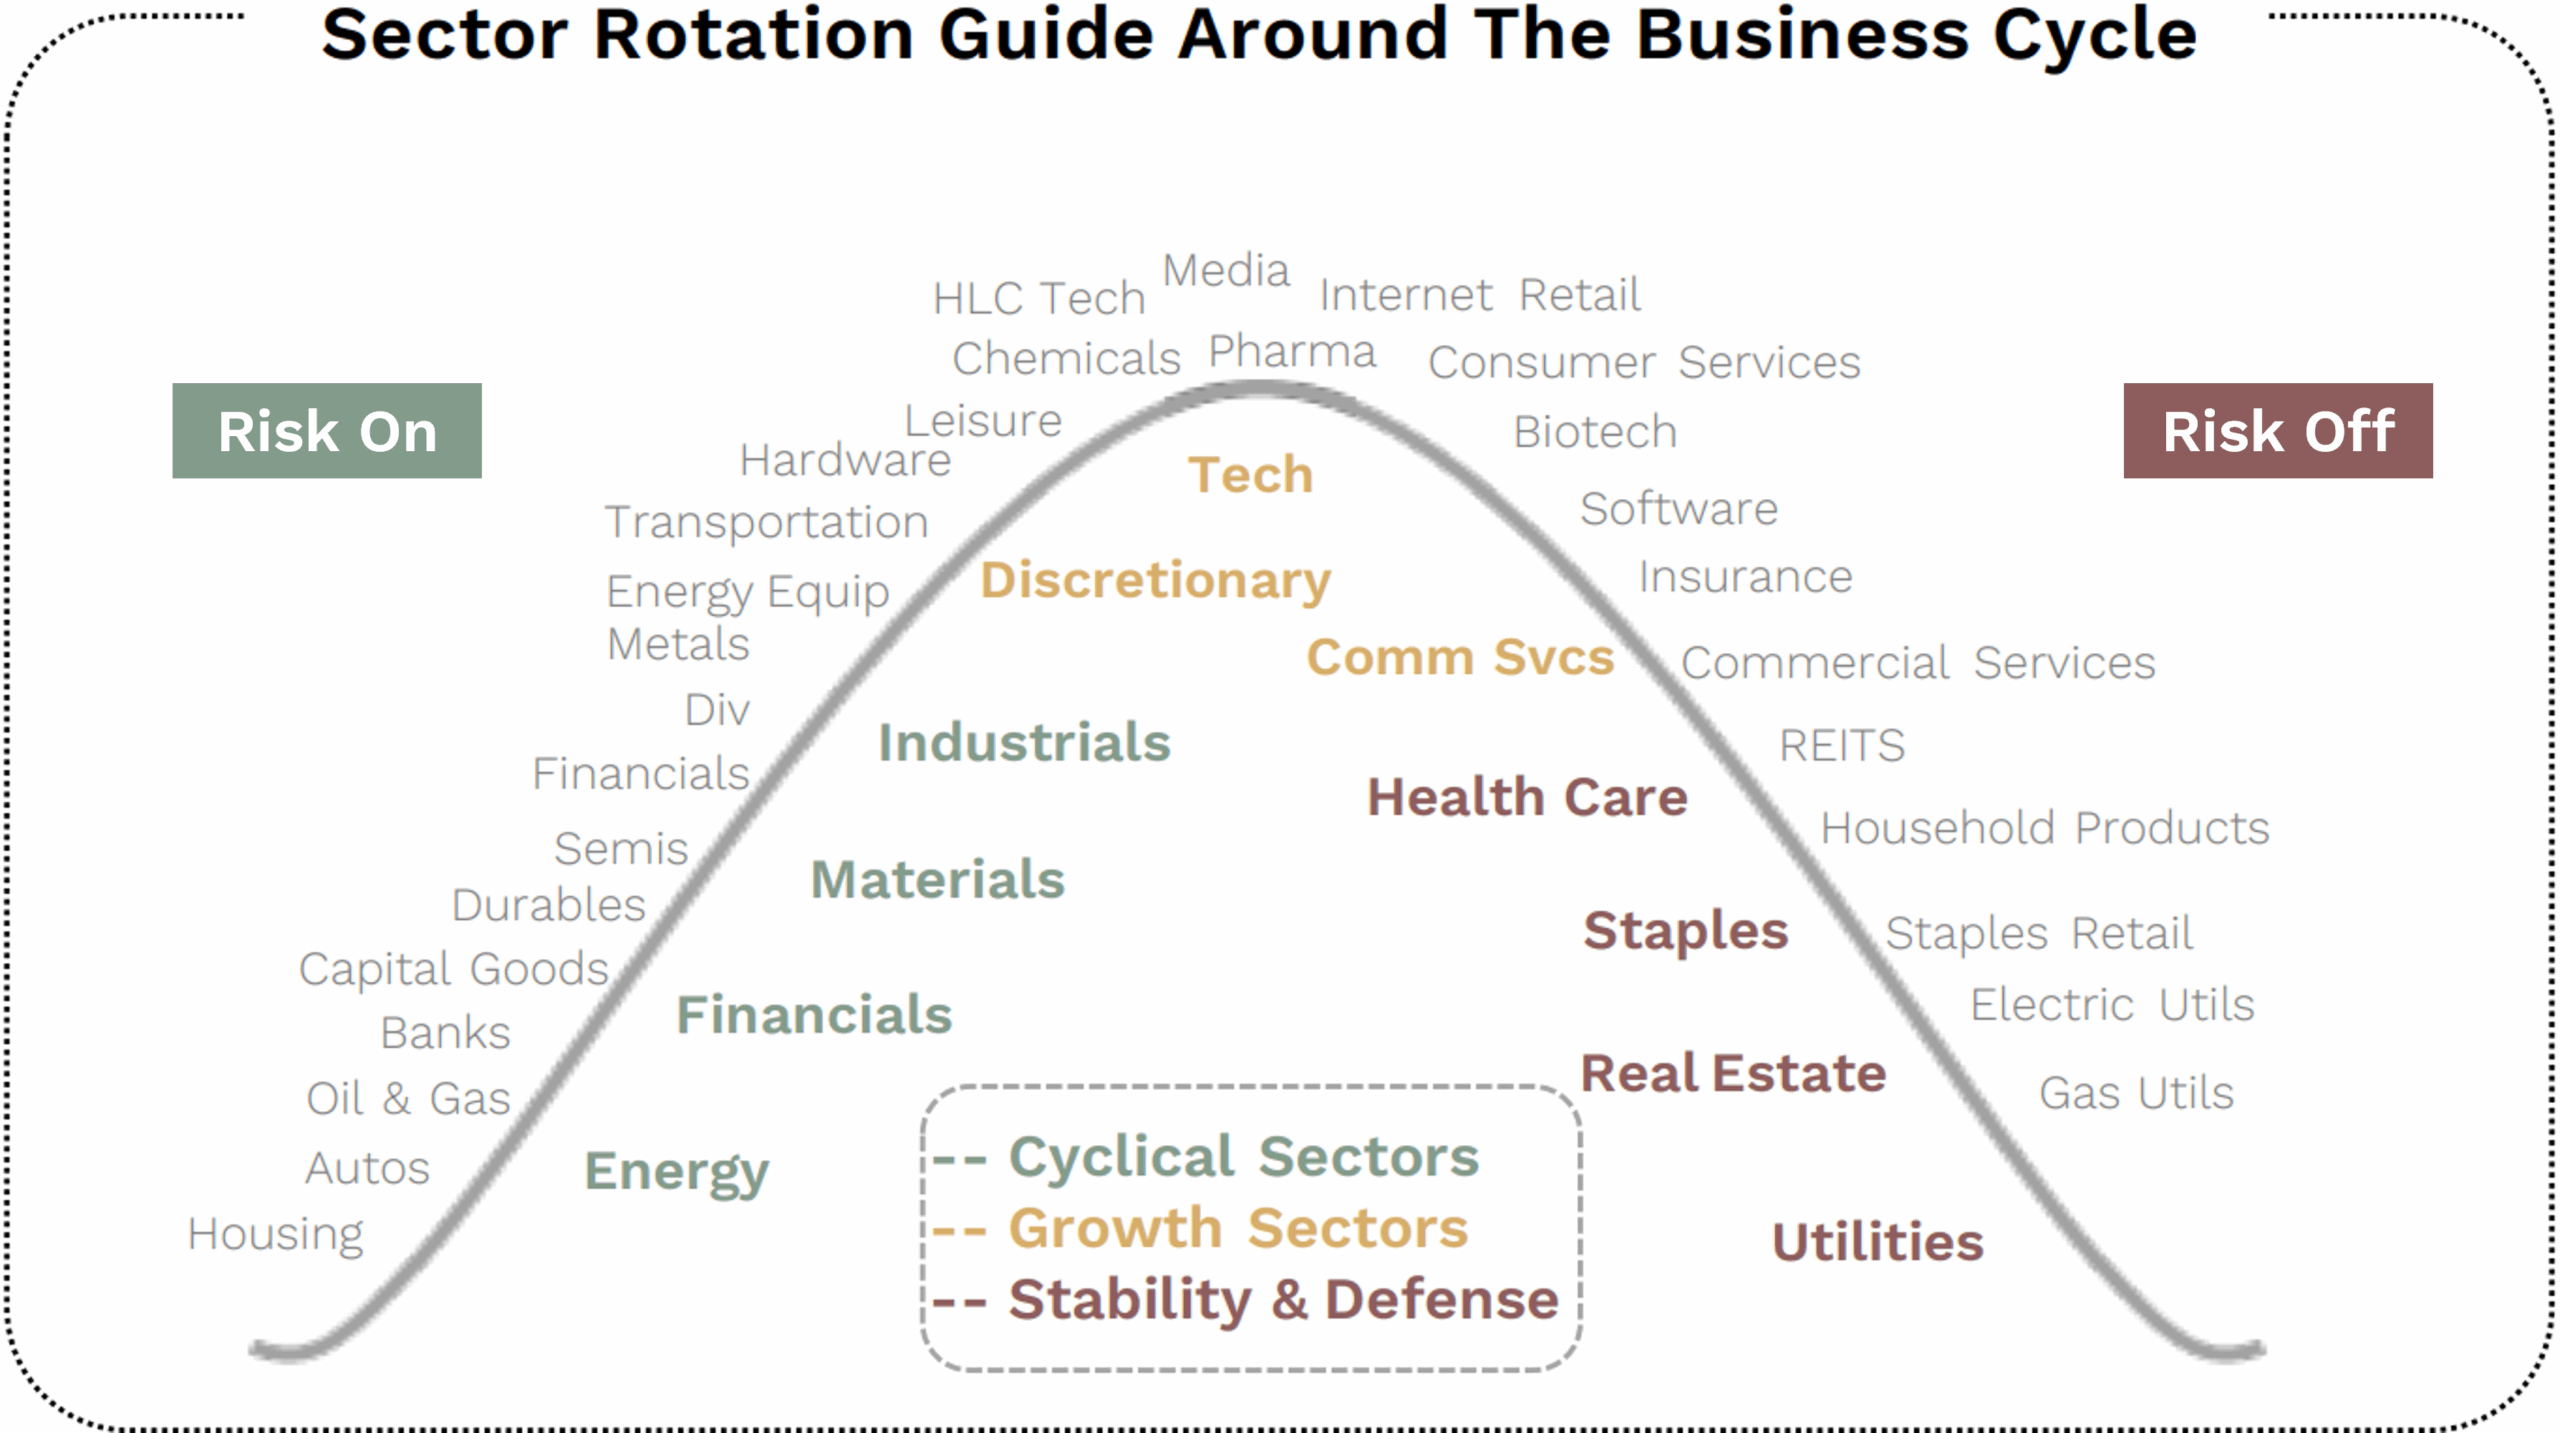
Together, these factors have recently driven outperformance in more cyclical areas of the U.S. share market, such as transport, housing and manufacturing, helping broaden market participation beyond a narrow group of stocks.

Since the rates induced sell-off in equity markets in late 2021, small caps, one of the more cyclical and risk sensitive segments of the market, have underperformed.

This is illustrated in the chart below, where the red line shows the Russell 2000 (U.S. small caps) divided by the S&P 500 (U.S. large caps). It’s been heading south for a LONG time which highlights prolonged small cap underperformance relative to large caps.

While there have been brief rallies lasting days or weeks linked to hopes for lower inflation or interest rates, these moves have not been sustained.

What has been missing is the key catalyst investors expect lower rates to deliver: earnings growth. The gold line in the chart shows small cap earnings expectations relative to large caps over the next twelve months.
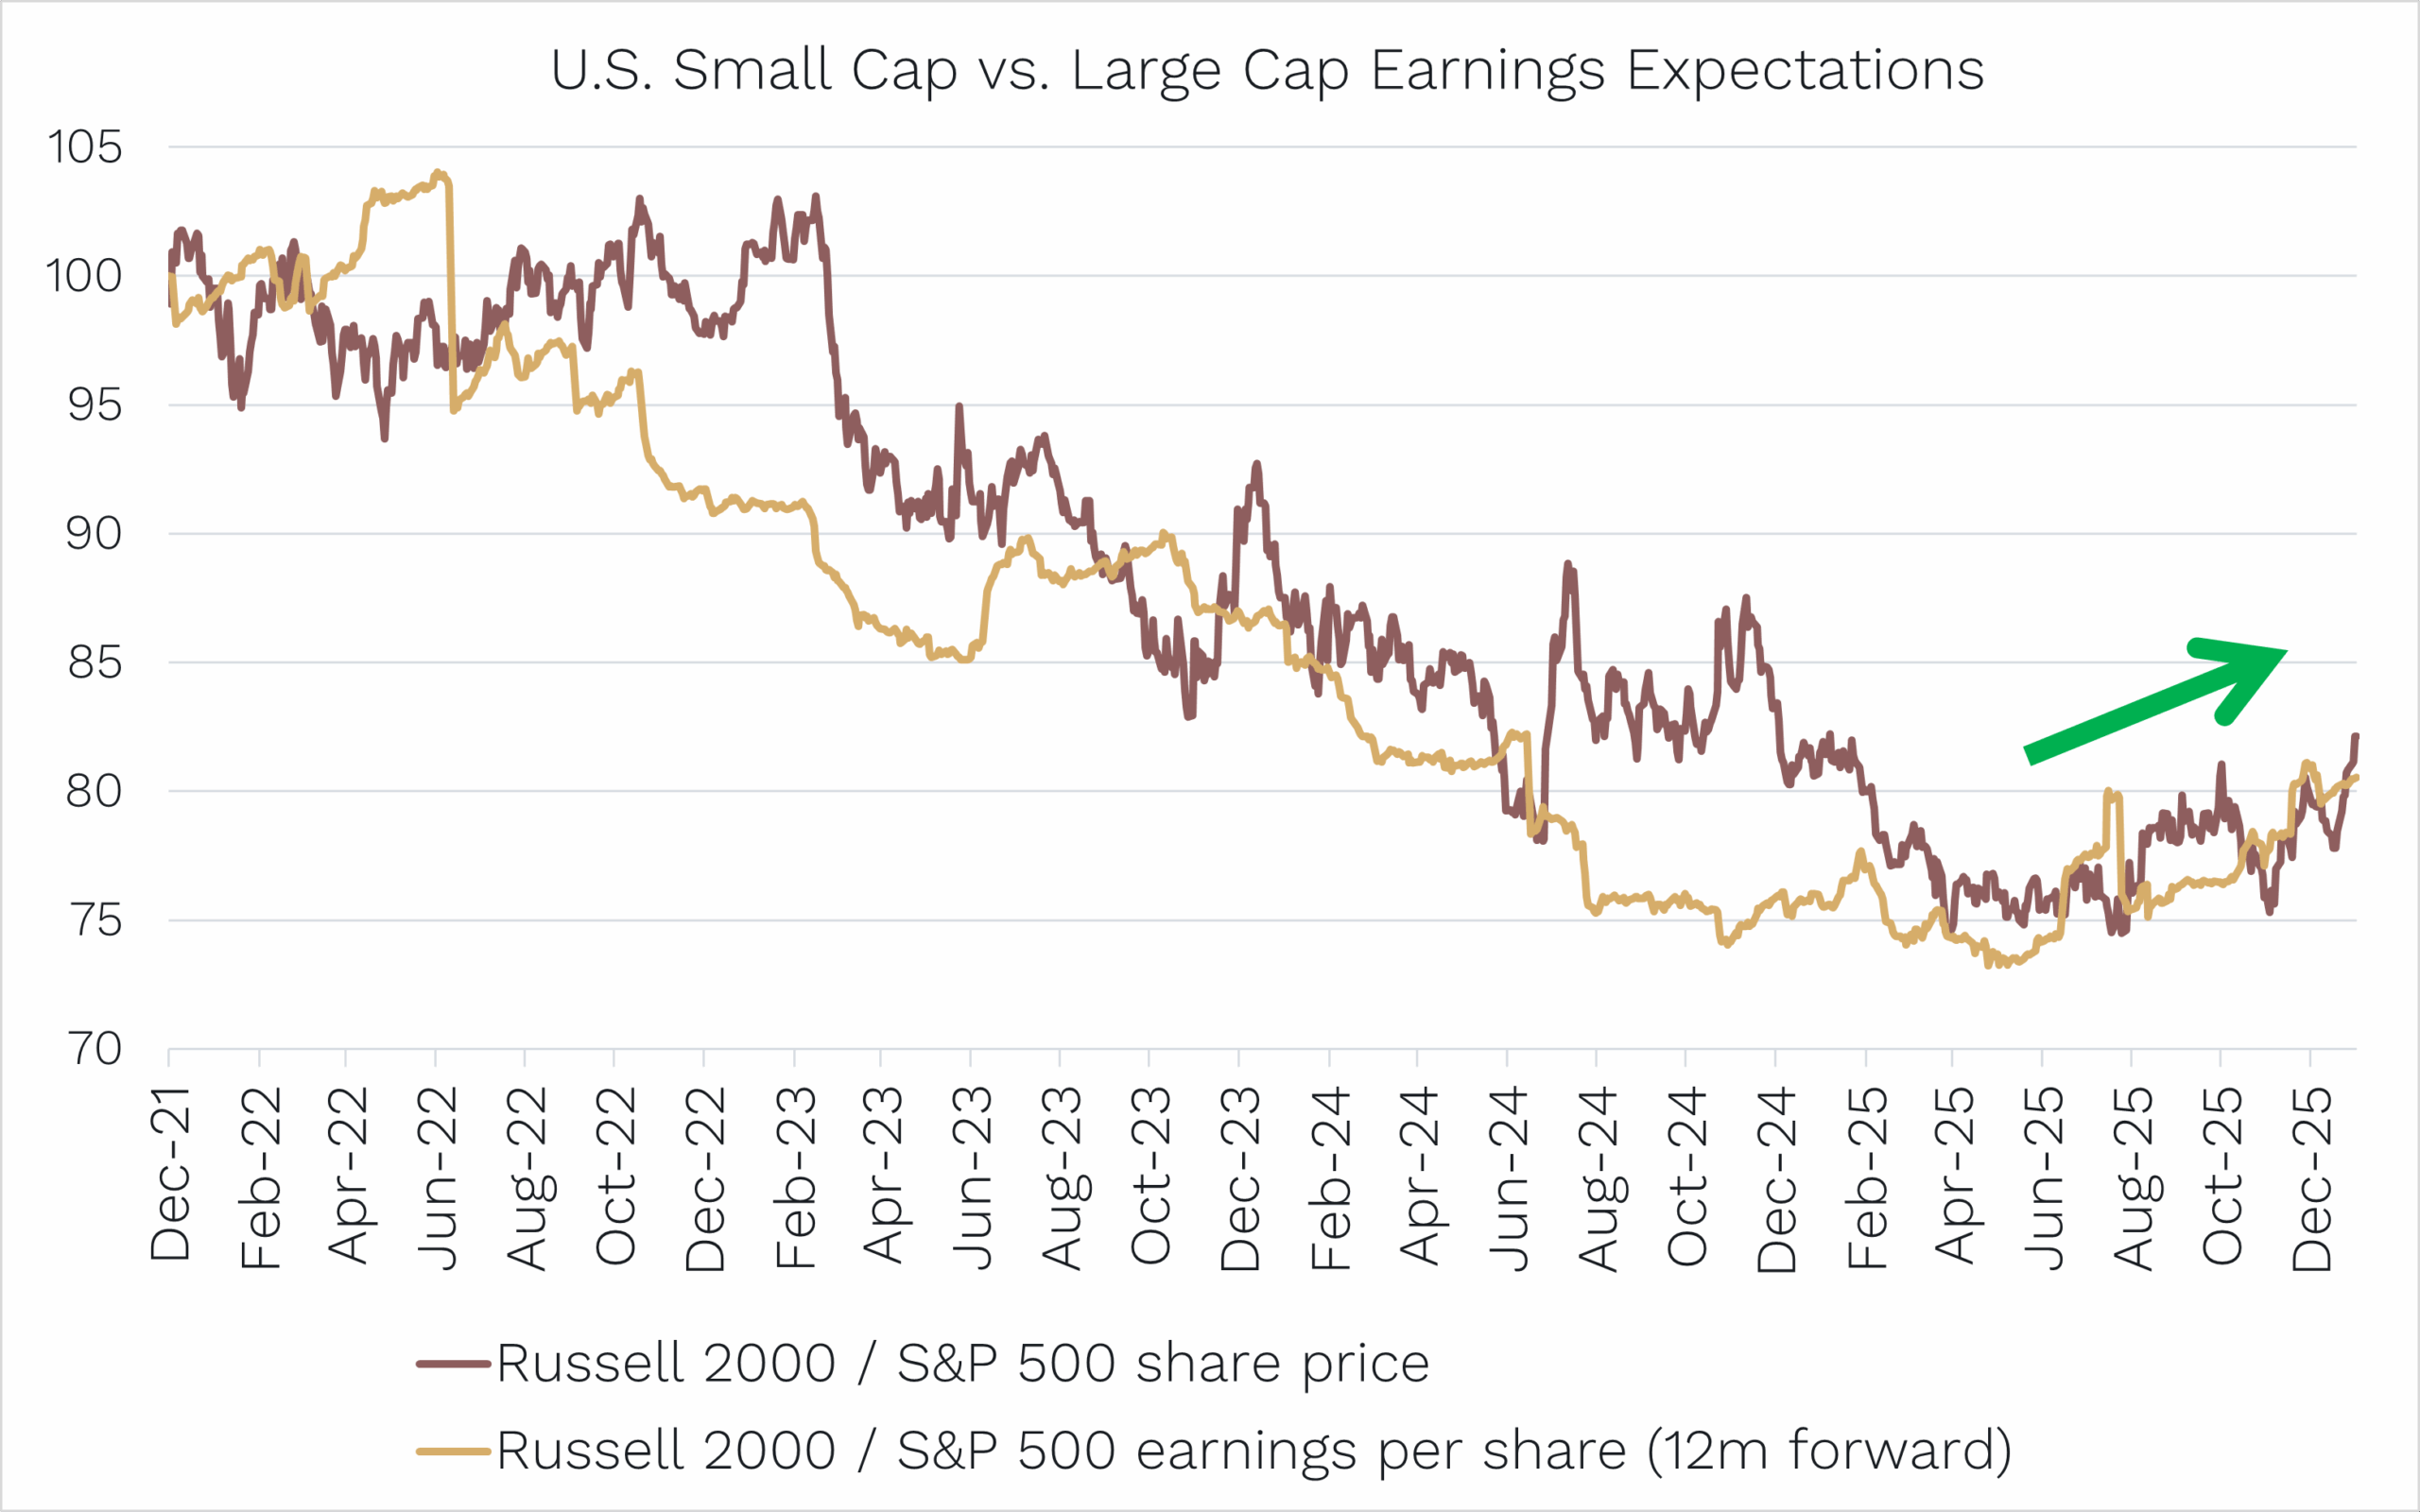
Source: Bloomberg. Indices indexed to 100.

As with individual stocks, earnings are the primary long term driver of index performance. From 2022 through to mid 2025, small cap underperformance closely mirrored their relative earnings underperformance.

There is now compelling evidence that this is changing.

When combined with improving momentum in early cycle sectors, a supportive economic backdrop and broader market participation, this emerging earnings outperformance represents the final ingredient needed to support sustained small cap outperformance.

It has been a long wait, but as small cap specialists, we believe this shift sets up a favourable tailwind for the asset class in 2026 and beyond, and ultimately for the Ophir funds.

[1] Technically tracking error is calculated as the standard deviation (volatility) of monthly out or underperformance.


As always, if you’d like to chat to us about any of the Funds, please feel free to call us on (02) 8188 0397 or email us at ophir@ophiram.com.

Thank you for entrusting your capital with us.

Kindest regards,
Andrew Mitchell & Steven Ng

Co-Founders & Senior Portfolio Managers

Ophir Asset Management

This document has been prepared by Ophir Asset Management Pty Ltd (ABN 88 156 146 717, AFSL 420082) (“Ophir”) and contains information about one or more managed investment schemes managed by Ophir (the “Funds”) as at the date of this document. The Trust Company (RE Services) Limited ABN 45 003 278 831, the responsible entity of, and issuer of units in, the Ophir High Conviction Fund (ASX: OPH), the Ophir Global Opportunities Fund and the Ophir Global High Conviction Fund. Ophir is the trustee and issuer of the Ophir Opportunities Fund.

This is general information only and is not intended to provide you with financial advice and does not consider your investment objectives, financial situation or particular needs.  You should consider your own investment objectives, financial situation and particular needs before acting upon any information provided and consider seeking advice from a financial advisor if necessary. Before making an investment decision, you should read the relevant Product Disclosure Statement (“PDS”) and Target Market Determination (“TMD”) available at www.ophiram.com or by emailing Ophir at ophir@ophiram.com. The PDS does not constitute a direct or indirect offer of securities in the US to any US person as defined in Regulation S under the Securities Act of 1993 as amended (US Securities Act).

All Ophir Funds are deemed high risk within their respective Target Market Determination documentation.  Ophir does not guarantee the performance of the Funds or return of capital.  An investment may achieve a lower than expected return and investors risk losing some or all of their principal investment.  Past performance is not a reliable indicator of future performance.  Any opinions, forecasts, estimates or projections reflect our judgment at the date of this was prepared, and are subject to change without notice.  Rates of return cannot be guaranteed and any forecasts, estimates or projections as to future returns should not be relied on, as they are based on assumptions which may or may not ultimately be correct.

Actual returns could differ significantly from any forecasts, estimates or projections provided.

The Trust Company (RE Services) Limited is a part of the Perpetual group of companies. No company in the Perpetual Group (Perpetual Limited ABN 86 000 431 827 and its subsidiaries) guarantees the performance of any fund or the return of an investor’s capital.


Previous

16 Dec, 2025 Stock in Focus - Zeta Global (NYSE: ZETA)

Next

11 Feb, 2026 Letter to Investors - January 2026
16 Dec, 2025

Stock in Focus - Zeta Global (NYSE: ZETA)

Stock in Focus • 5 mins read

Back to Insights Back to Insights

PDF

Finding Alpha in Zeta

In a sea of marketing tech companies competing for attention, Zeta has quietly established itself as one of the most compelling players in the space. But it hasn’t all been smooth sailing, especially when it listed.

We first met Zeta in 2021 during a virtual roadshow shortly after what can only be described as a disastrous IPO. Just after listing, the analyst from the bank who listed the stock came out with a Neutral recommendation and a price target below the listing price. This contributed to the stock falling nearly 50% post IPO, and for a while, Zeta became a name most investors avoided.

So we took a meeting, did the work, and came away with a very different conclusion.


How We Gained Conviction

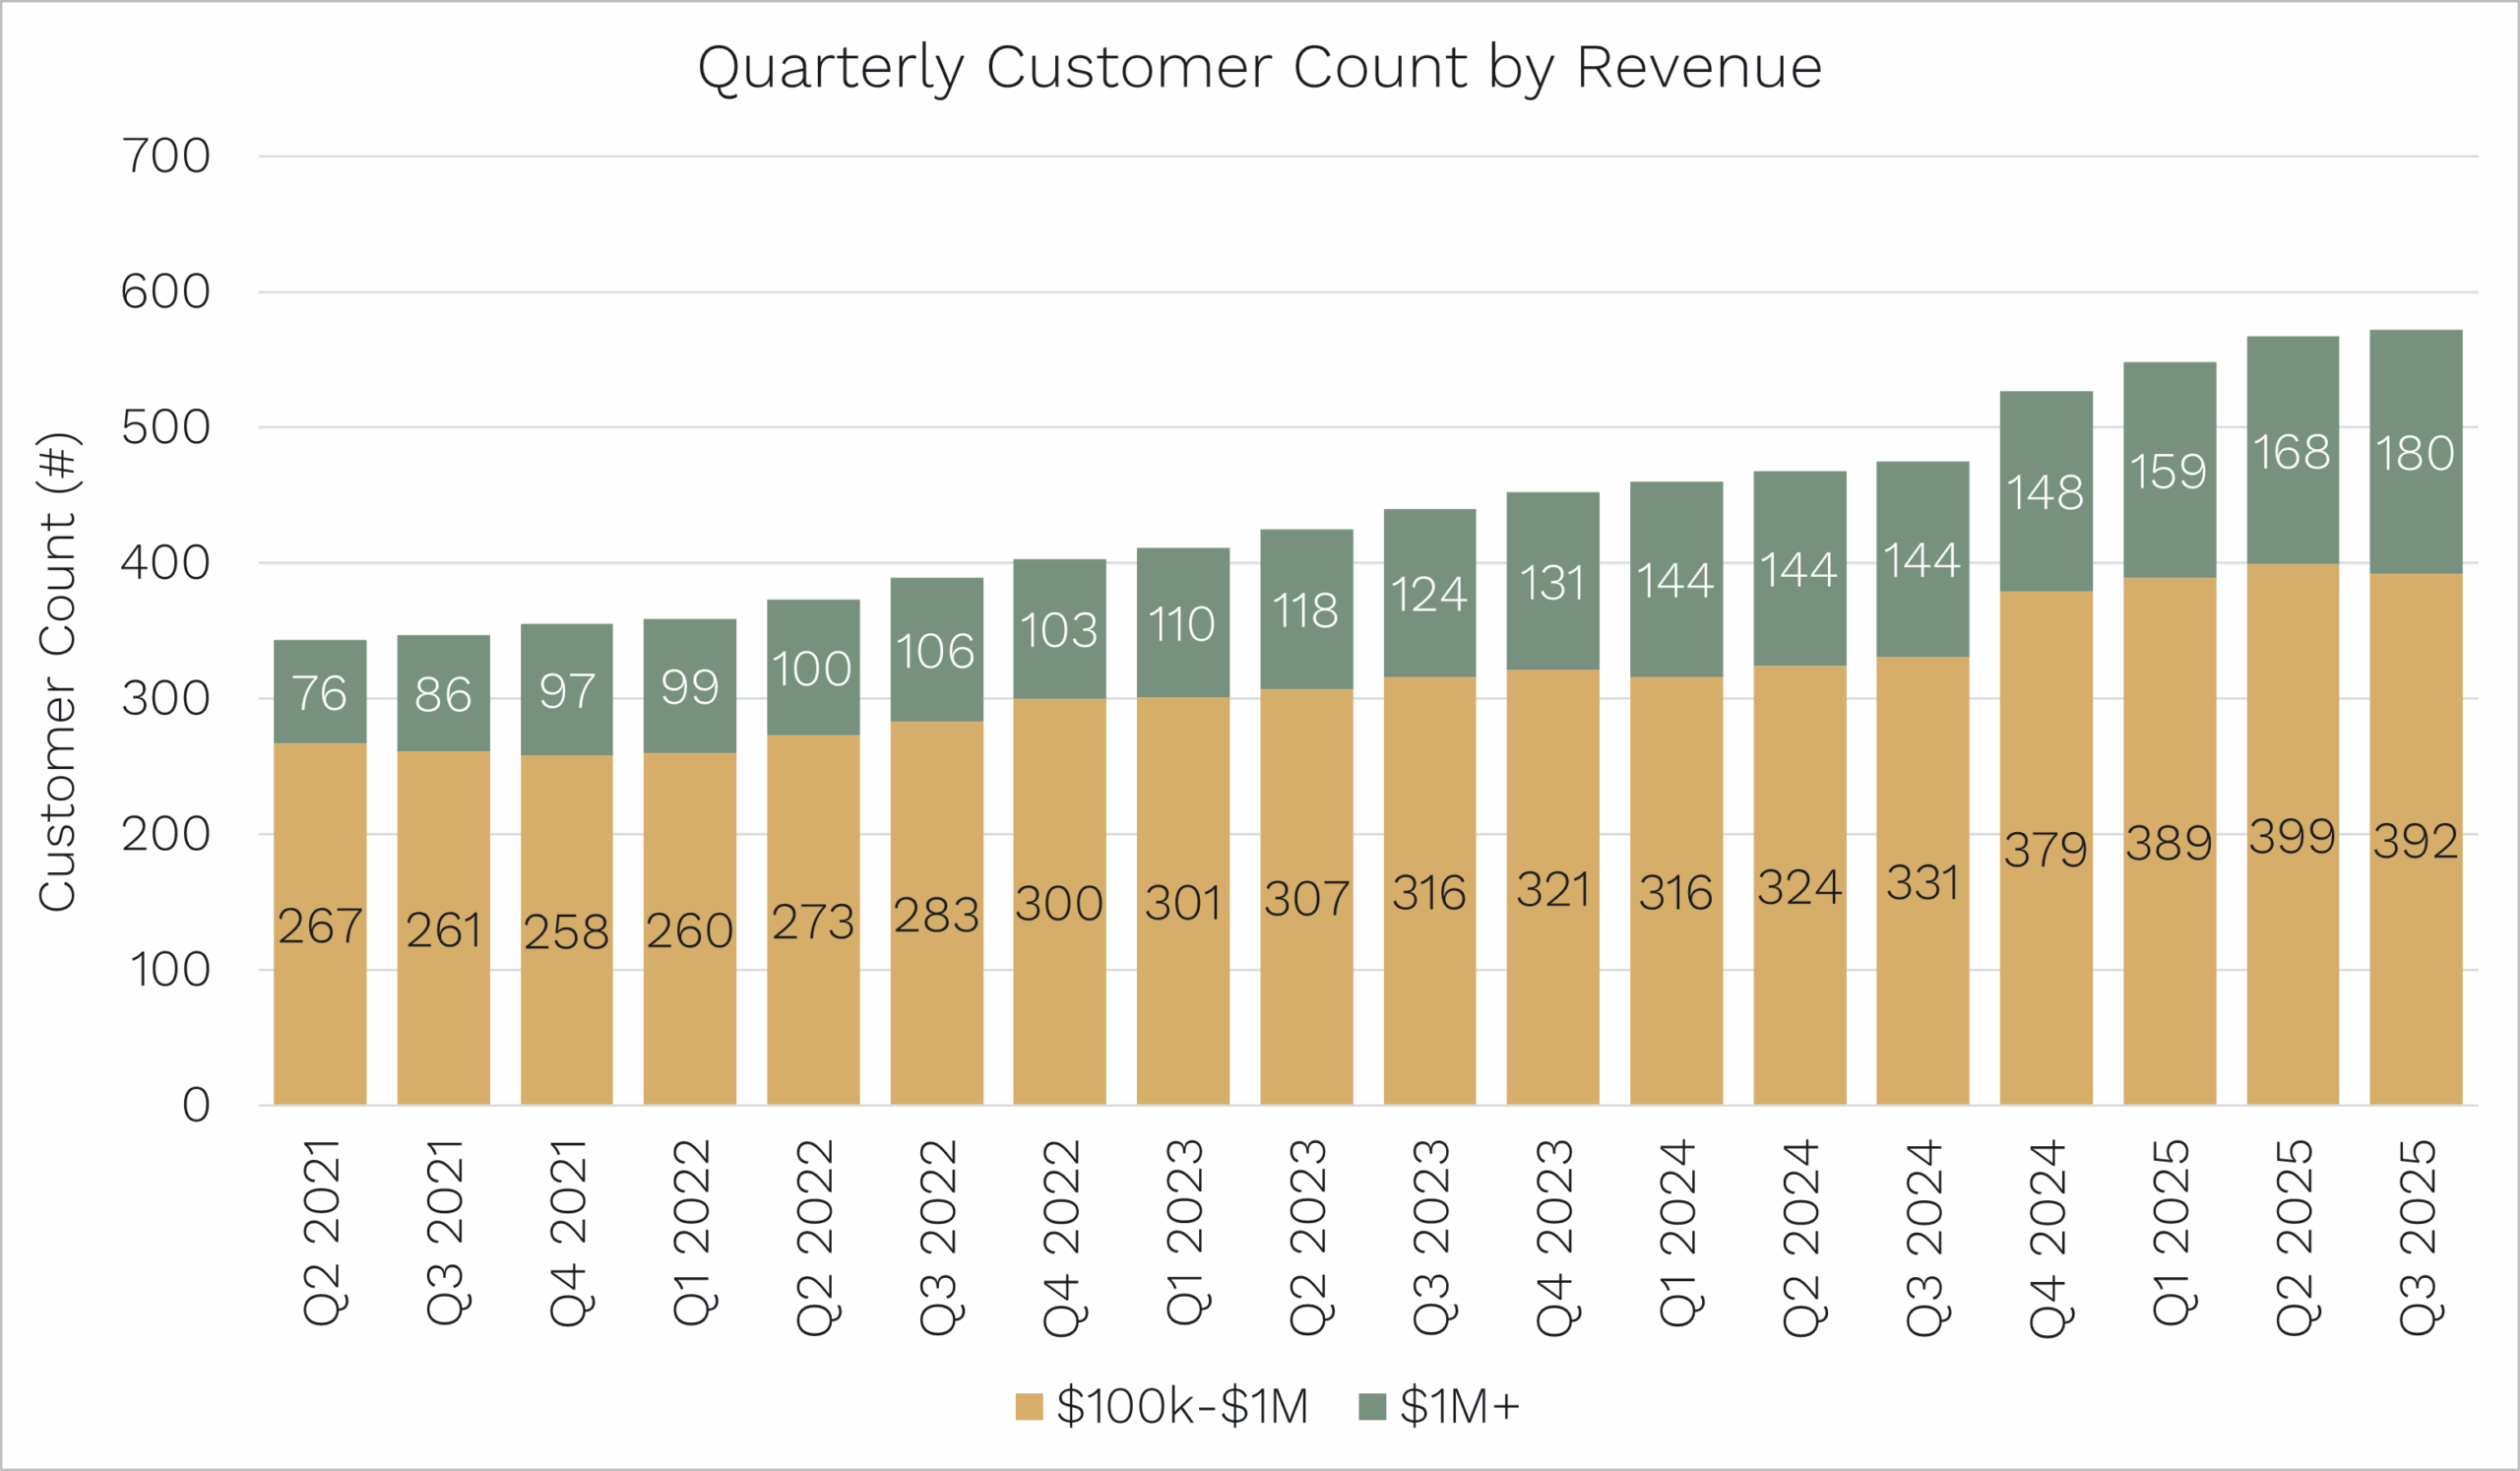
Major agency partners are the core customer base in Zeta’s market. After a series of diligence calls, we found repeated evidence of Zeta’s superior return on ad spend (ROAS) compared to the incumbents. We also sat through a two-hour technical demo with Zeta’s product engineers and walked away convinced the platform had the scalability, usability, and performance to support sustained growth with large enterprise clients.

In short, Zeta was misunderstood, but not broken.


Keeping Our Finger on the Pulse

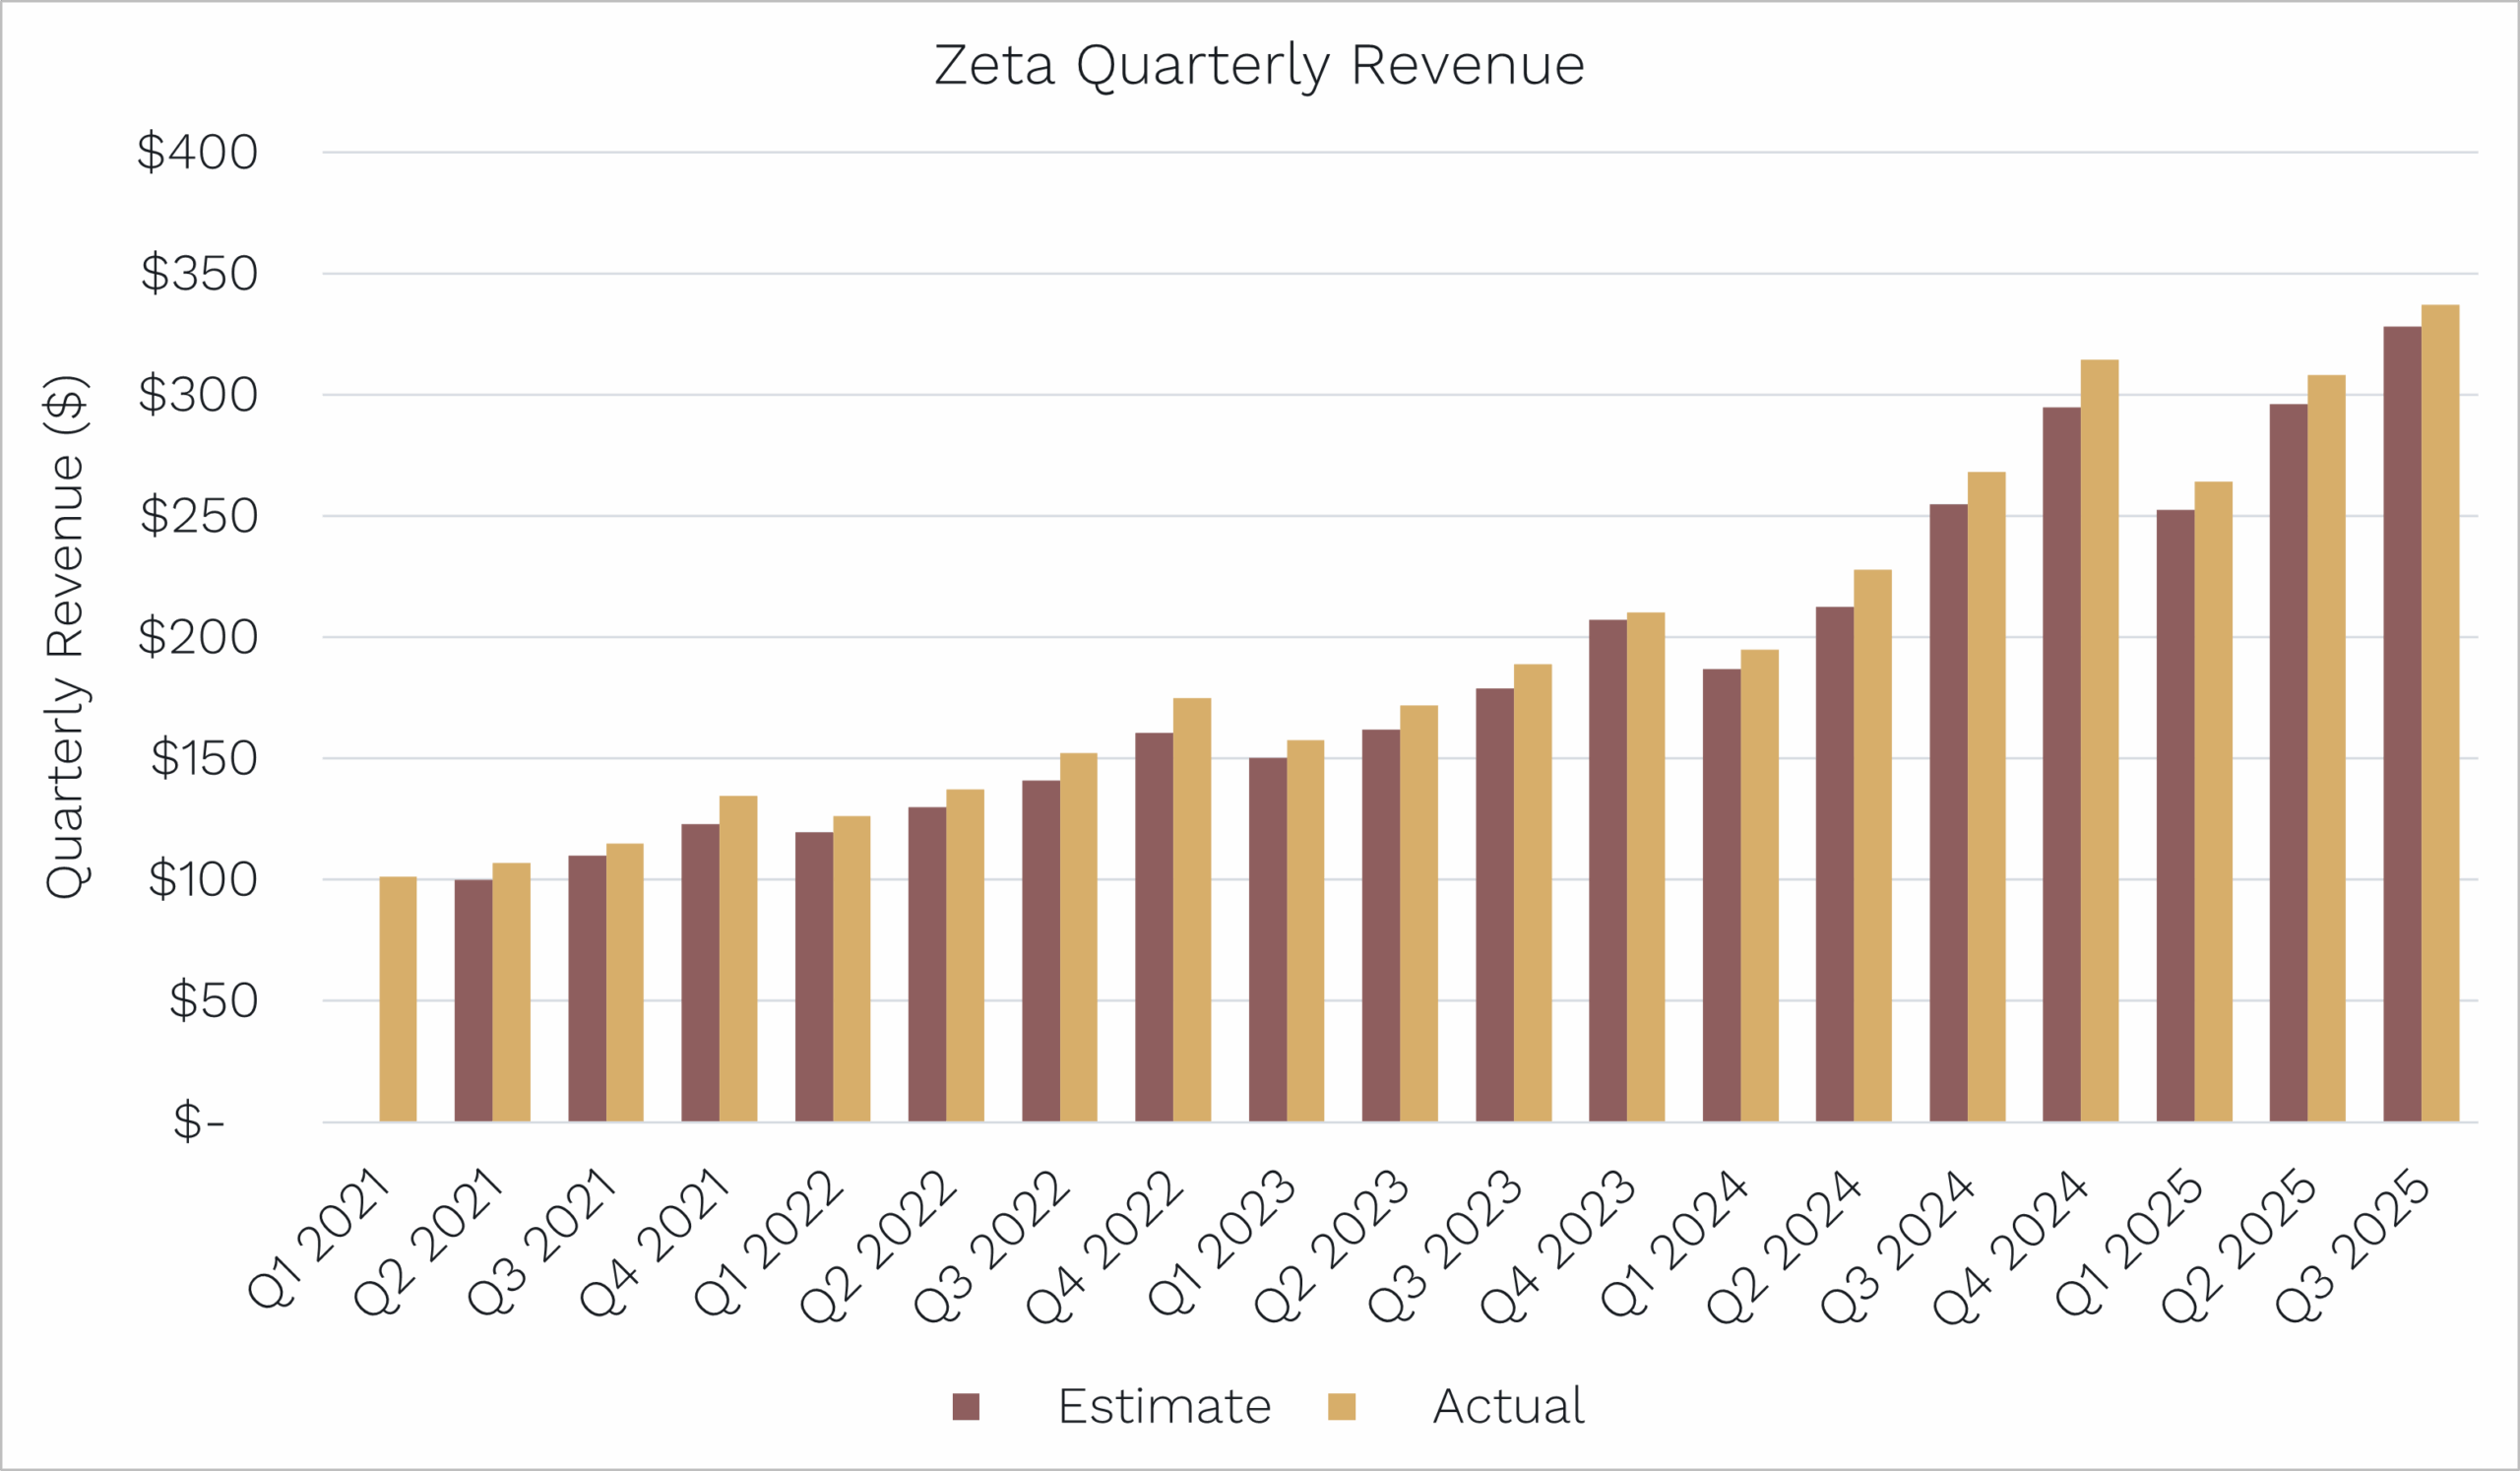
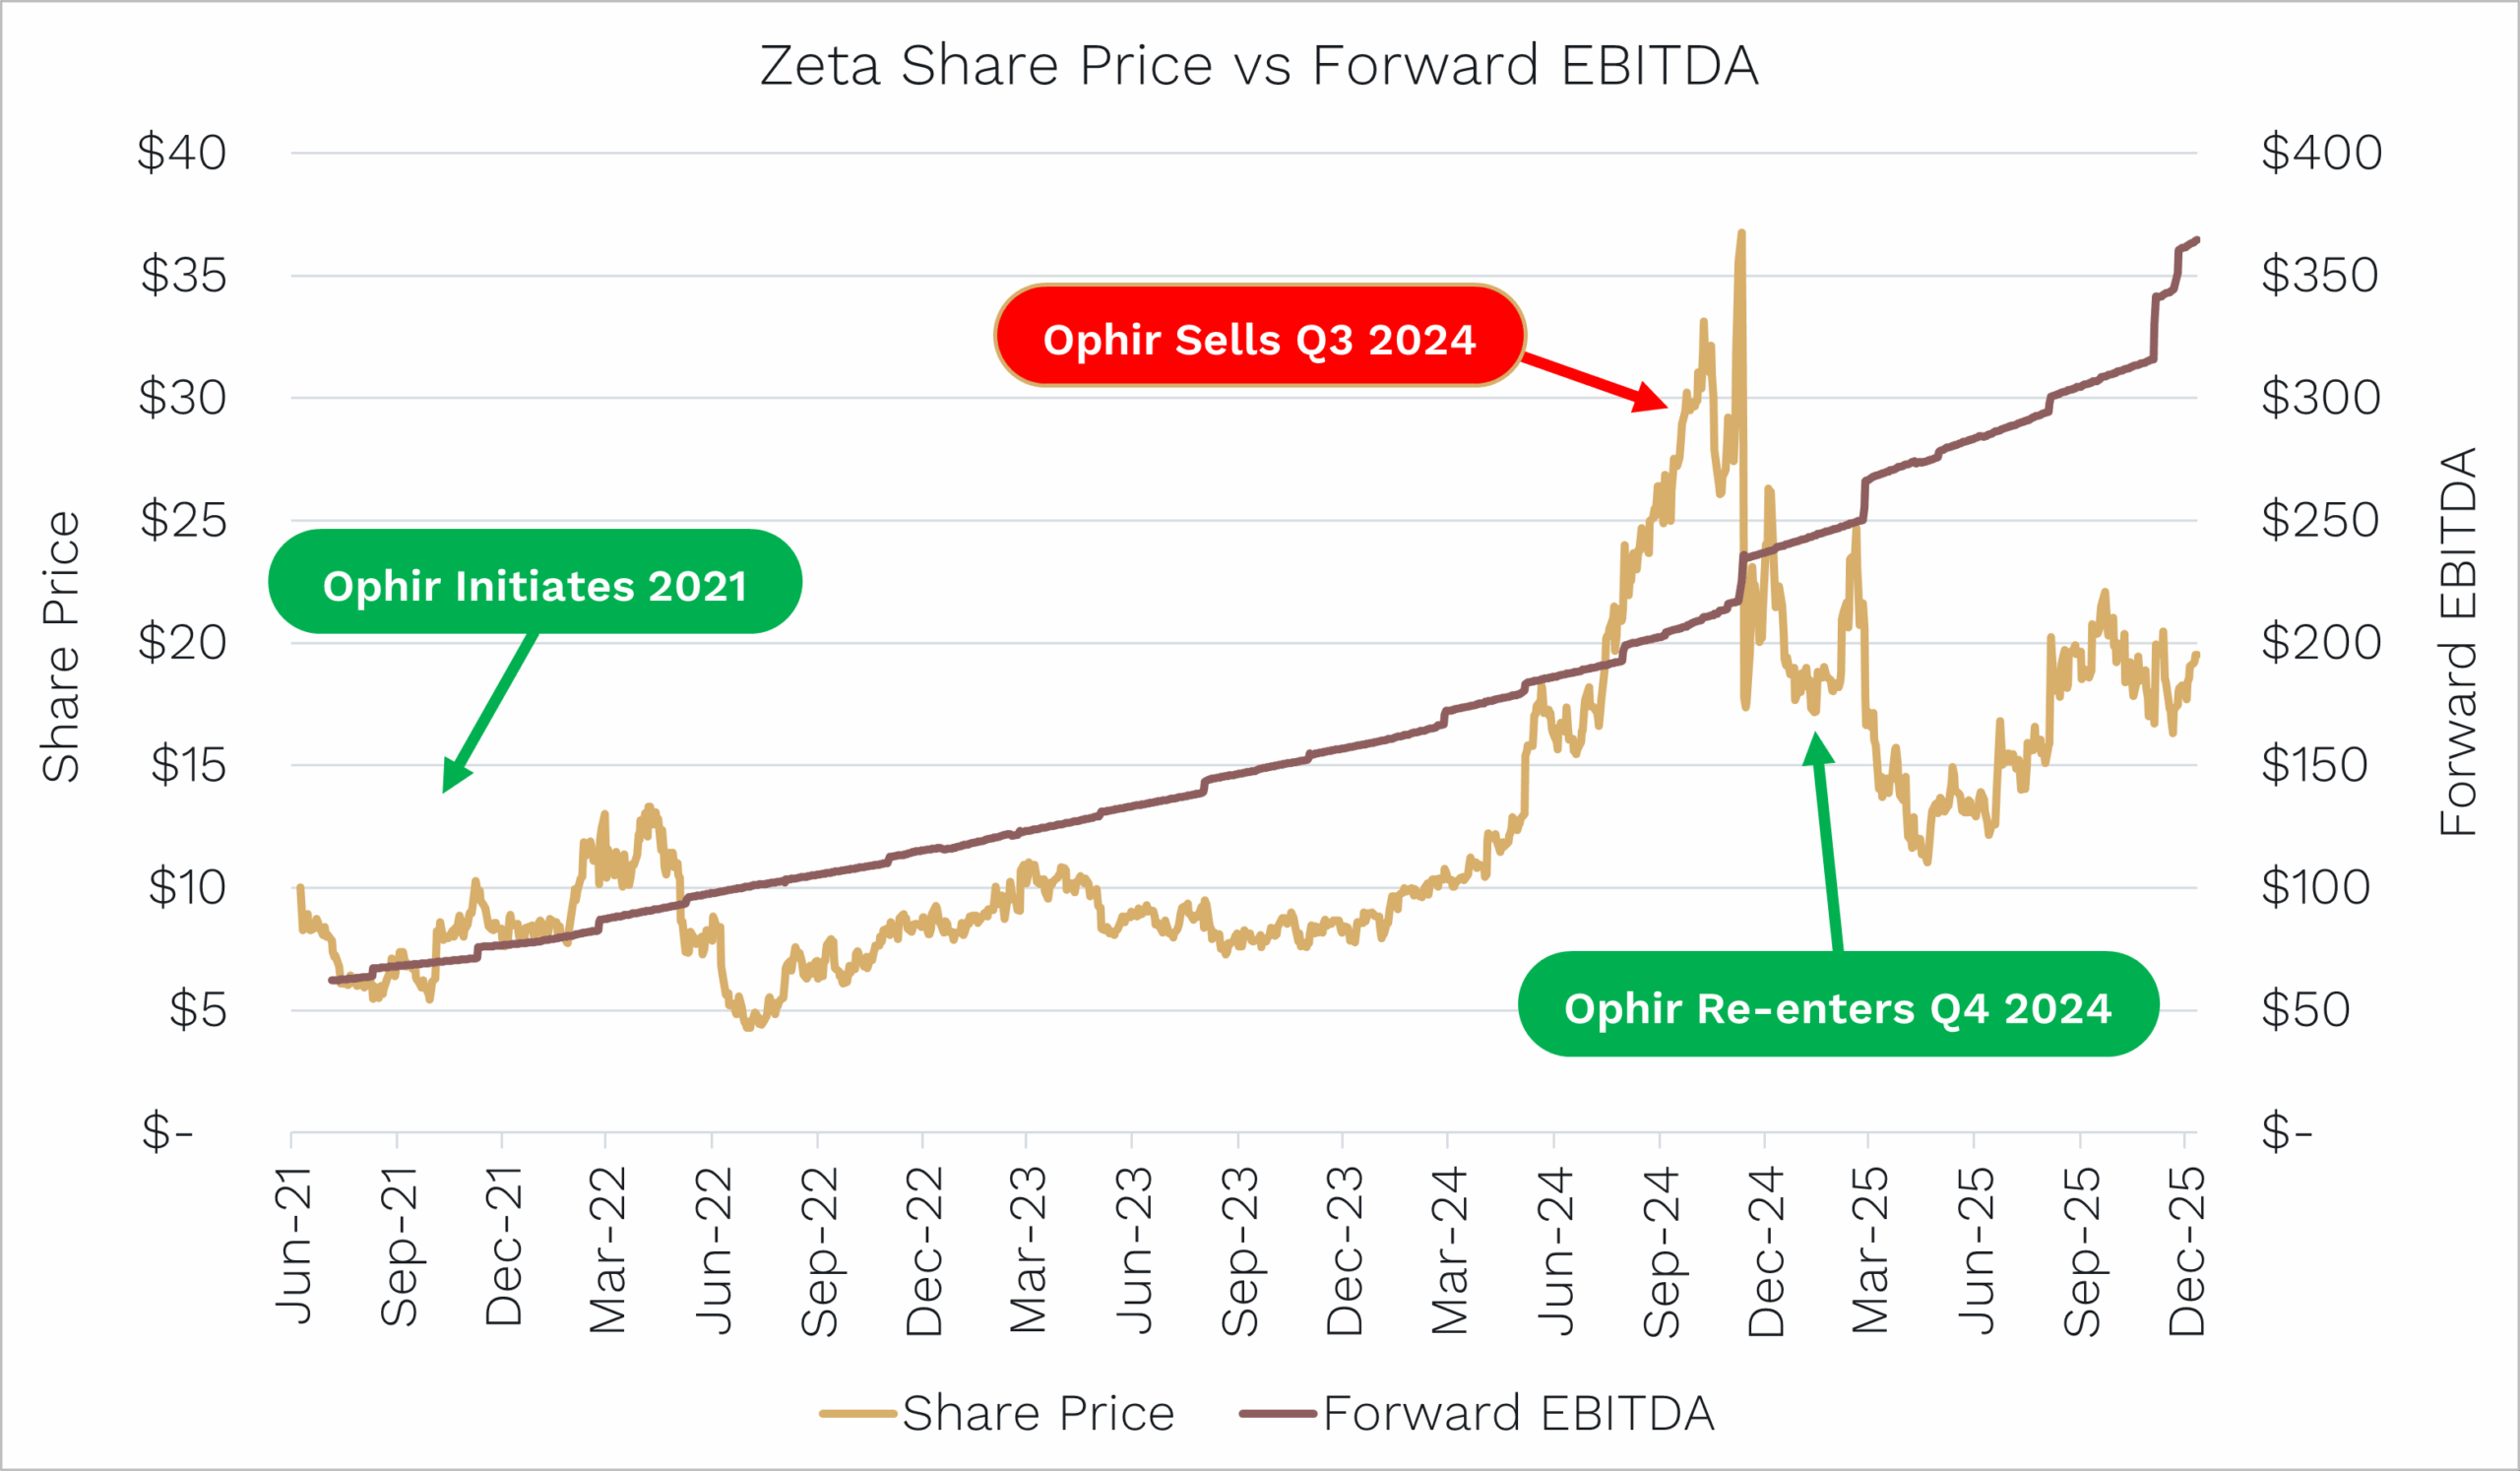
In Q3 2024, with the stock having exceeded our price target, we exited our position. After consistently beating and raising every quarter post IPO, we believed the stock was priced for perfection and the market was paying two years forward. We still liked the story, but felt the set-up required growth to accelerate further.

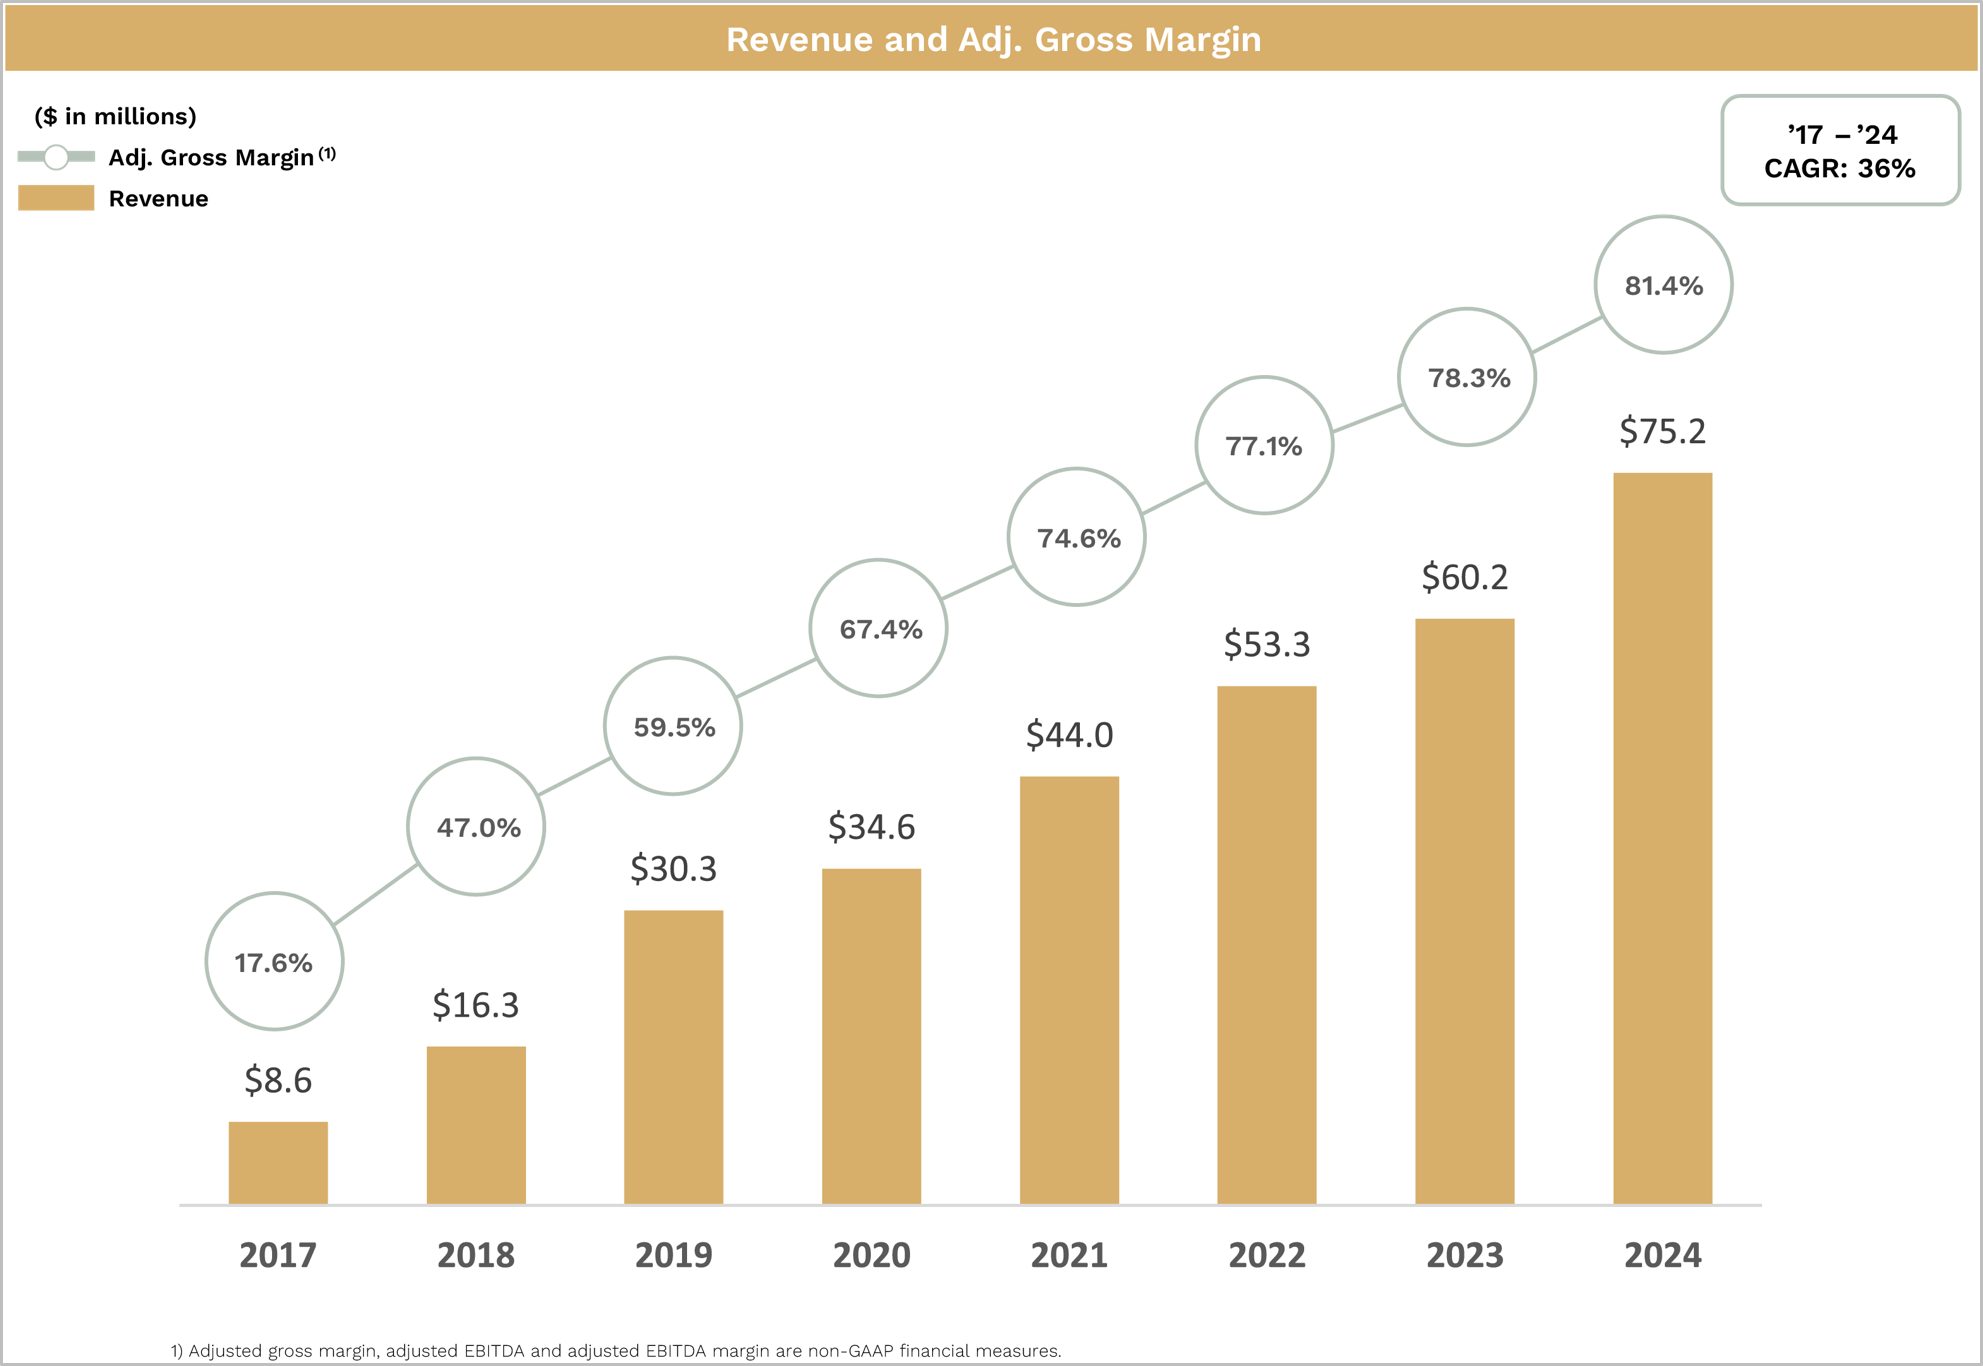
Source: Zeta Global Investor Day Presentation, October 2025.

As anticipated, guidance wasn’t enough to satisfy the markets’ elevated expectations.

Following the conservative 2025 guide, a short report attacking Zeta’s data integrity was released. This is a classic vulnerability for advertising technology (AdTech) businesses and the stock was sold off aggressively. We had already done deep diligence on Zeta’s data pipeline and knew from customer and partner conversations that the underlying data quality had been reviewed and validated by some of the most sophisticated agency buyers globally.

We believed the short report, while well-timed, was opportunistic. So we re-entered in Q4 2024 at a significant discount to intrinsic value.

Source: Ophir. Bloomberg Data as of 10 December 2025.

What They Do and Why It Works

Zeta is a leading U.S. marketing technology (MarTech) company. Their platform helps large enterprise customers identify, engage, and retain customers more effectively by using predictive AI, real-time signals, and a differentiated first-party data graph.

Unlike traditional software companies that sell you an “empty” database to fill with your own customer data, Zeta provides the software already filled with a massive proprietary dataset of consumer identities and behaviours.

This unique combination allows them to bridge the gap between AdTech (acquiring new customers via ads) and MarTech (retaining customers via email/SMS), a convergence that defines the current industry landscape.

Source: Zeta Global Investor Day Presentation, October 2025.

The Thesis in Focus

Zeta is a classic, Rule of 40 compounder, but isn’t currently trading like one.

  • Organic revenue growth of 20%+
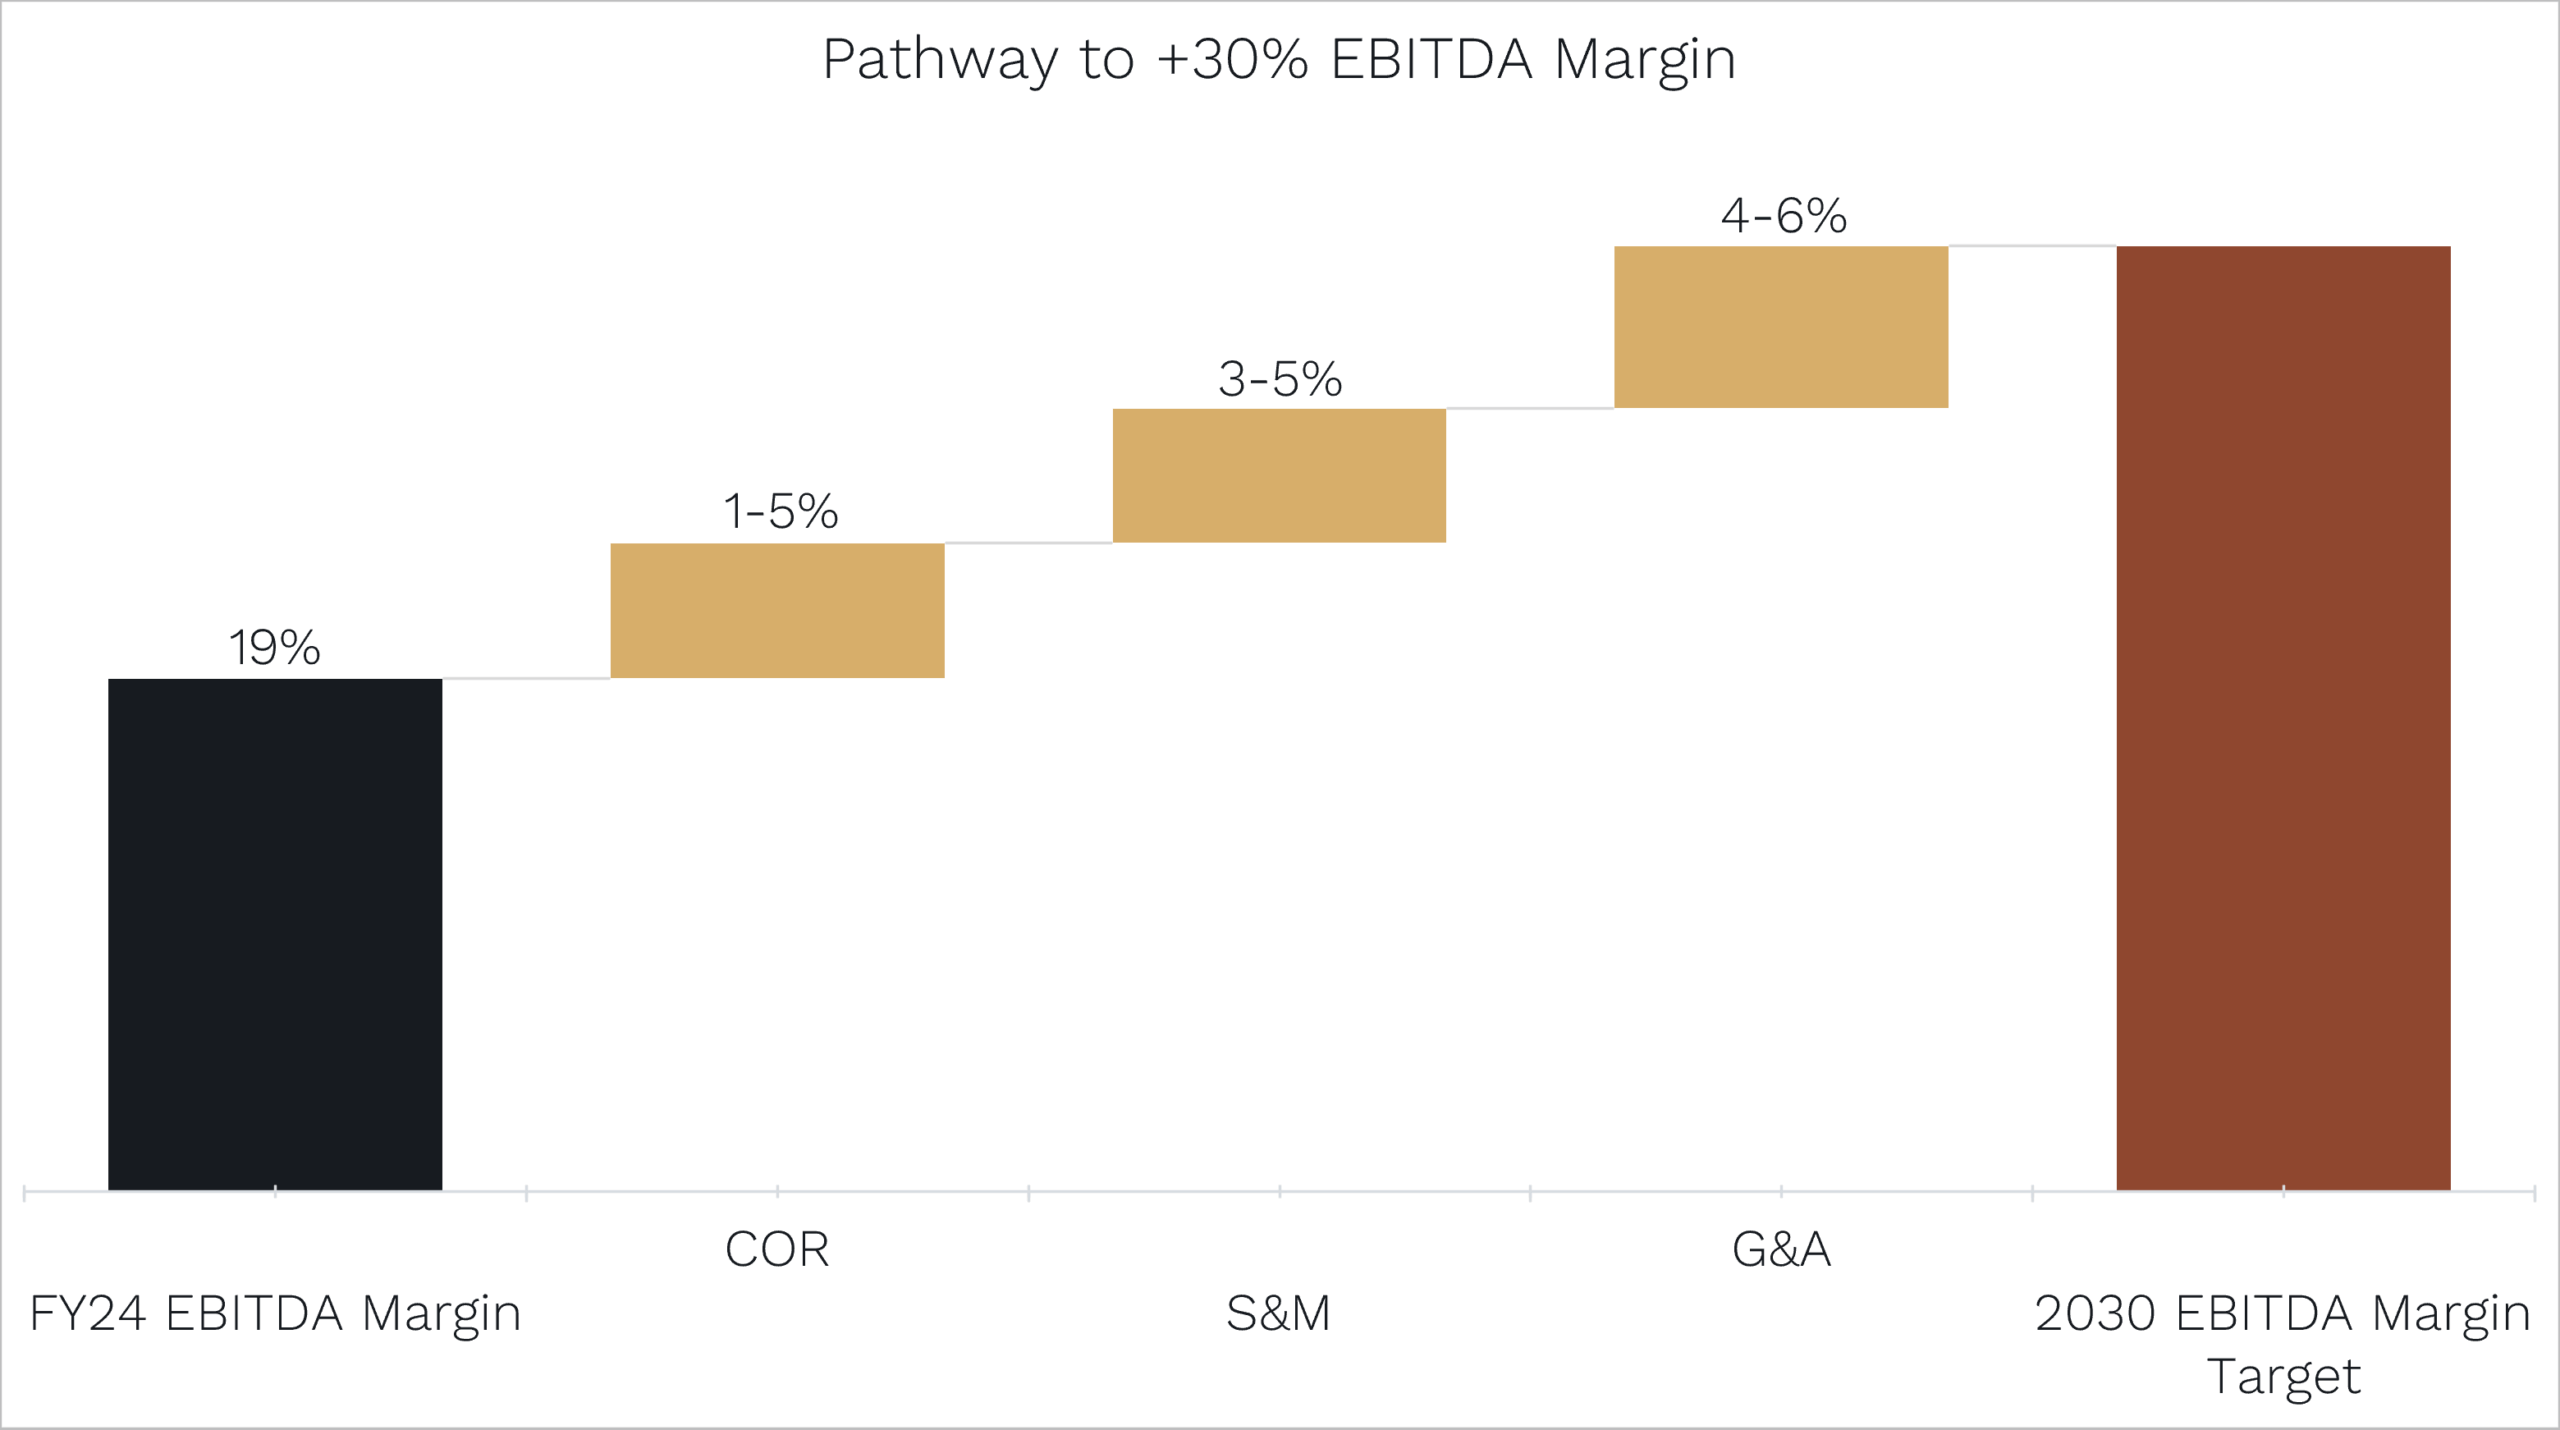
  • EBITDA margins in the low 20s, growing toward 30%+ by 2030
  • Multiple M&A levers to accelerate platform expansion
  • Trades on just ~11x forward EBITDA

With margin expansion and top line momentum both in place, we believe Zeta deserves to re-rate back to the high-teens multiples it saw during prior periods of growth acceleration.

COR refers to Cost of Revenue, S&M to Sales and Marketing, and G&A to General and Administrative expenses.

Source: Zeta Global Investor Day Presentation, October 2025.

What Gives Us the Edge

  • 20+ customer and agency diligence calls across several years
  • Portfolio company usage validation from advertisers and data partners
  • Three separate product walkthroughs with Zeta’s engineers to assess capability evolution
  • Built conviction through multiple cycles — pre-IPO dislocation, post-rally exit, and re-entry after short attack


Why We Still Hold

We held a mid-sized weight going into the most recent result, halved it post-print due to macro uncertainty, and have since increased our position size as macro uncertainty has started to abated (relatively speaking).

  • Q3 results beat EBITDA by ~10%, and consensus for 2026 was upgraded
  • Yet the stock finished flat for the month
  • Multiple is now at its lowest in years, despite ongoing earnings momentum

This isn’t about betting on the macro, but if risk sentiment improves, Zeta is well-positioned to slingshot out of this multiple compression phase.

Managing the Beta

It’s important to highlight: Zeta is a cyclical, higher-beta name. And that’s a feature, not a bug.

  • It offers tremendous upside when confidence returns to the macro
  • We believe the downside remains manageable, but it can be volatile during periods of macro uncertainty

For now, we’re happy owning a mid-sized position given the attractive multiple and as the macro backdrop shifts, we can flex the weight accordingly.


Final Word

Zeta may have started its public life under a cloud, but what’s emerged since is a category leader with a clear value proposition, an expanding product suite, and the kind of performance profile that earns loyalty from budget-conscious agency buyers.

With ongoing growth, rising margins, and a valuation that provides more reward than risk, we see Zeta as a name that can quietly compound, then quickly re-rate when sentiment catches up.

Previous

16 Dec, 2025 Letter to Investors - November 2025

Next

21 Jan, 2026 Letter to Investors - December 2025
16 Dec, 2025

Letter to Investors - November 2025

Letter to Investors • 11 mins read

Back to Insights Back to Insights

PDF


Investing in the share market: Go all-in or stage your entry?

In this Letter to Investors we look at

  • The importance of ‘factors’ in driving short-term market moves.
  • How a radical reshaping of interest rate cuts in November led certain factors, particularly growth, to underperform during the month.
  • How these factor dynamics temporarily affected our Ophir Funds performance in November, and how they’re now unwinding … assisting with outperformance in our Global Funds at writing in December.
  • We also look at the vital topic of whether to invest your money all at once in the market (lump sum) or in staged investments (staged market entry) over time.
  • As part of our analysis, we look at which strategy – lump sum or staged – has outperformed over the last 50 years.
  • And we then factor in risk/volatility and examine how staged investing is really like an insurance policy.

Last month, a very well-known Australian businessman said he wanted to  invest in one of our share Funds.

But then he asked us: “Should I invest all at once, or stage it in over time?”

A great question – and one every investor faces.

And in this month’s Letter to Investors, we want to share our answer.

But first, we’d like to touch on November’s performance. All of our Funds underperformed during the month. But we are not concerned.

Why?

Factor facts

While earnings drive share prices over the long term, so-called factor headwinds or tailwinds can sway performance in the short term.

What are these factors?

There are an almost unlimited number of ‘factors’ professionals track these days. But essentially, they are various characteristics shared by certain groups of shares, including:

  • The size of the company (small caps, mid-caps, etc)
  • How liquid its shares are
  • How fast their earnings are growing
  • The stock’s valuation (cheap, etc.)

Professional investors often crowd in and out of these ‘factors’ at different times based on when they think the macroeconomic or market environment is going to suit a particular factor.

A radical move

November was one of these months where we saw big factor moves.

The precipitation factor? (pardon the pun).

The U.S. Federal Reserve.

Heading into the end of October, markets thought the Fed was a sure thing to cut rates at its next meeting in December.

But then Chair Powell poured cold water on that idea at his post-meeting press conference on October 29.

As a result, over the first three weeks of November, the market switched to expecting a higher-for-longer interest rate environment.

The probability of a December rate cut crashed from 100% to about 30%.

For those who don’t track market pricing for these probabilities, for such a brief period, this is a radical move.

Probability of Rate Cuts

Source: Bloomberg for FOMC meeting at 10th December 2025. Data as of 30 November 2025.

Growth hit

The new higher-for-longer expected rate environment triggered winners and losers amongst various factors:

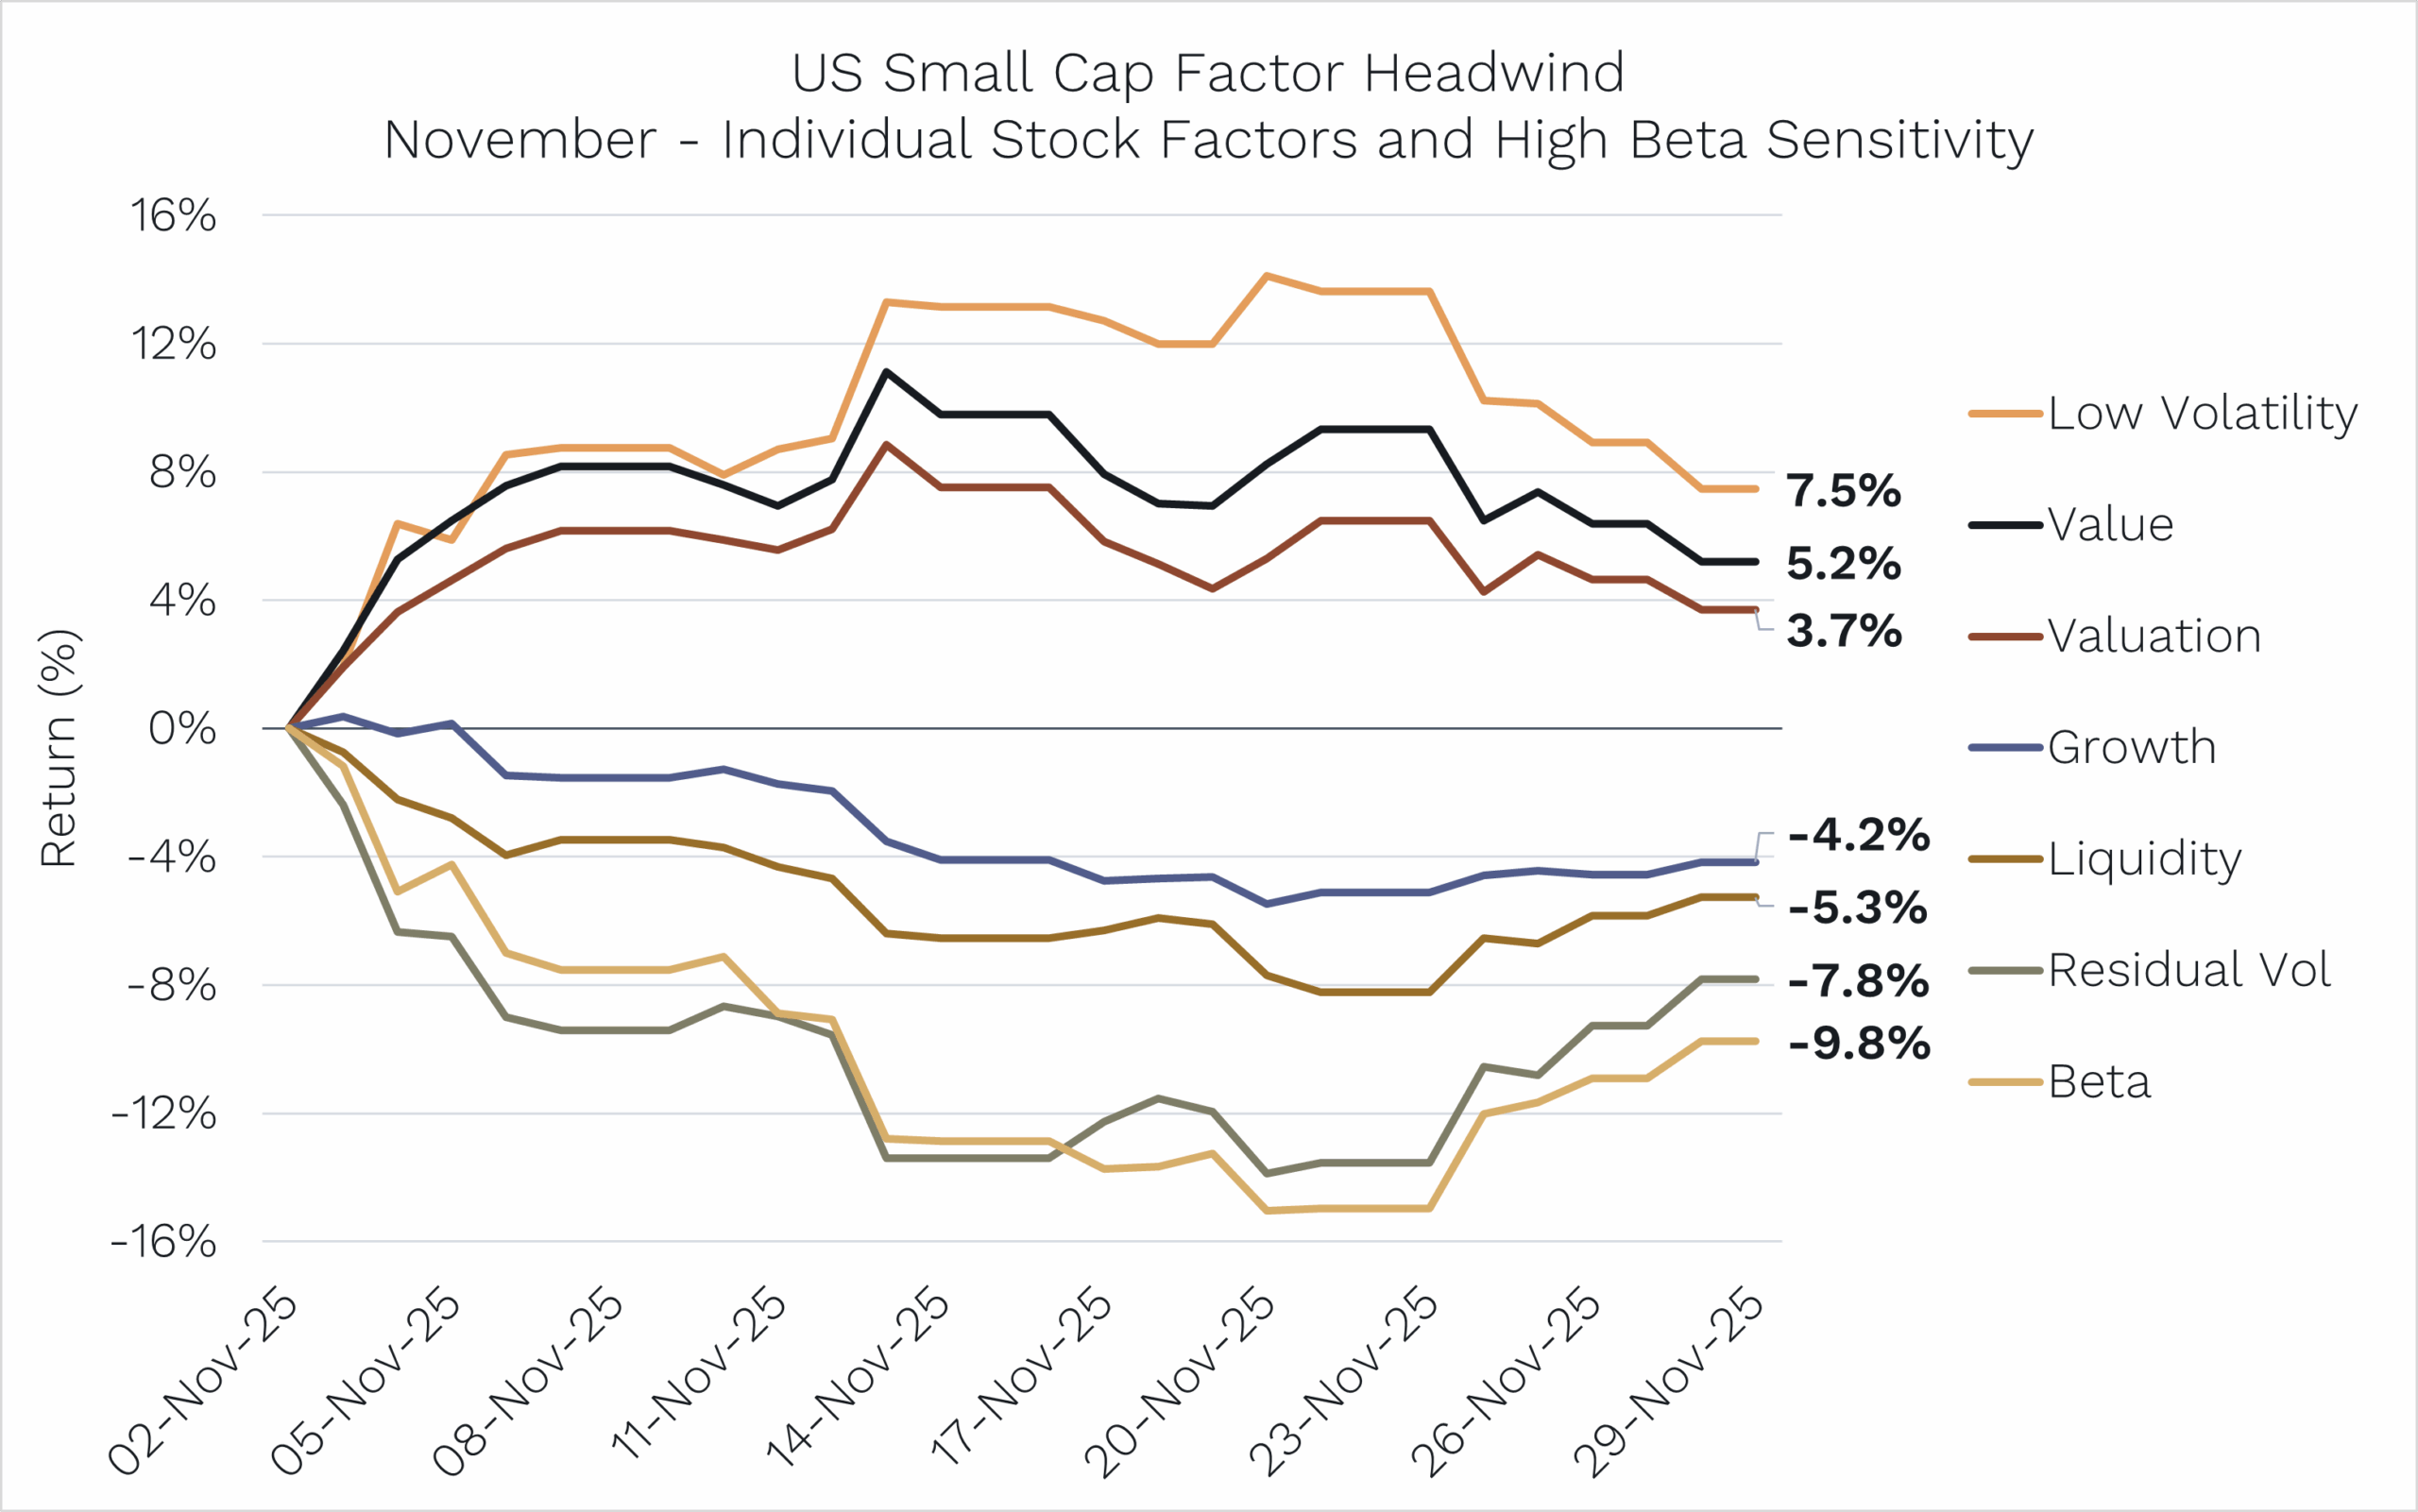
  • Growth, liquidity and beta underperformed.
  • Low volatility and lower valuation stocks outperformed. (The chart below shows factor moves for U.S. small caps in November.)

Higher interest rates, particularly if unexpected, impact the valuations of growth-orientated stocks more as they have more of their lifetime cash flows further out in the future, and when you discount those future cash flows with a higher interest rate to determine their valuation today, that results in a bigger valuation drop.

U.S. factor headwinds in November

Source: Bloomberg for the Russell 2000 index long-short factors. Data as of 30 November 2025.

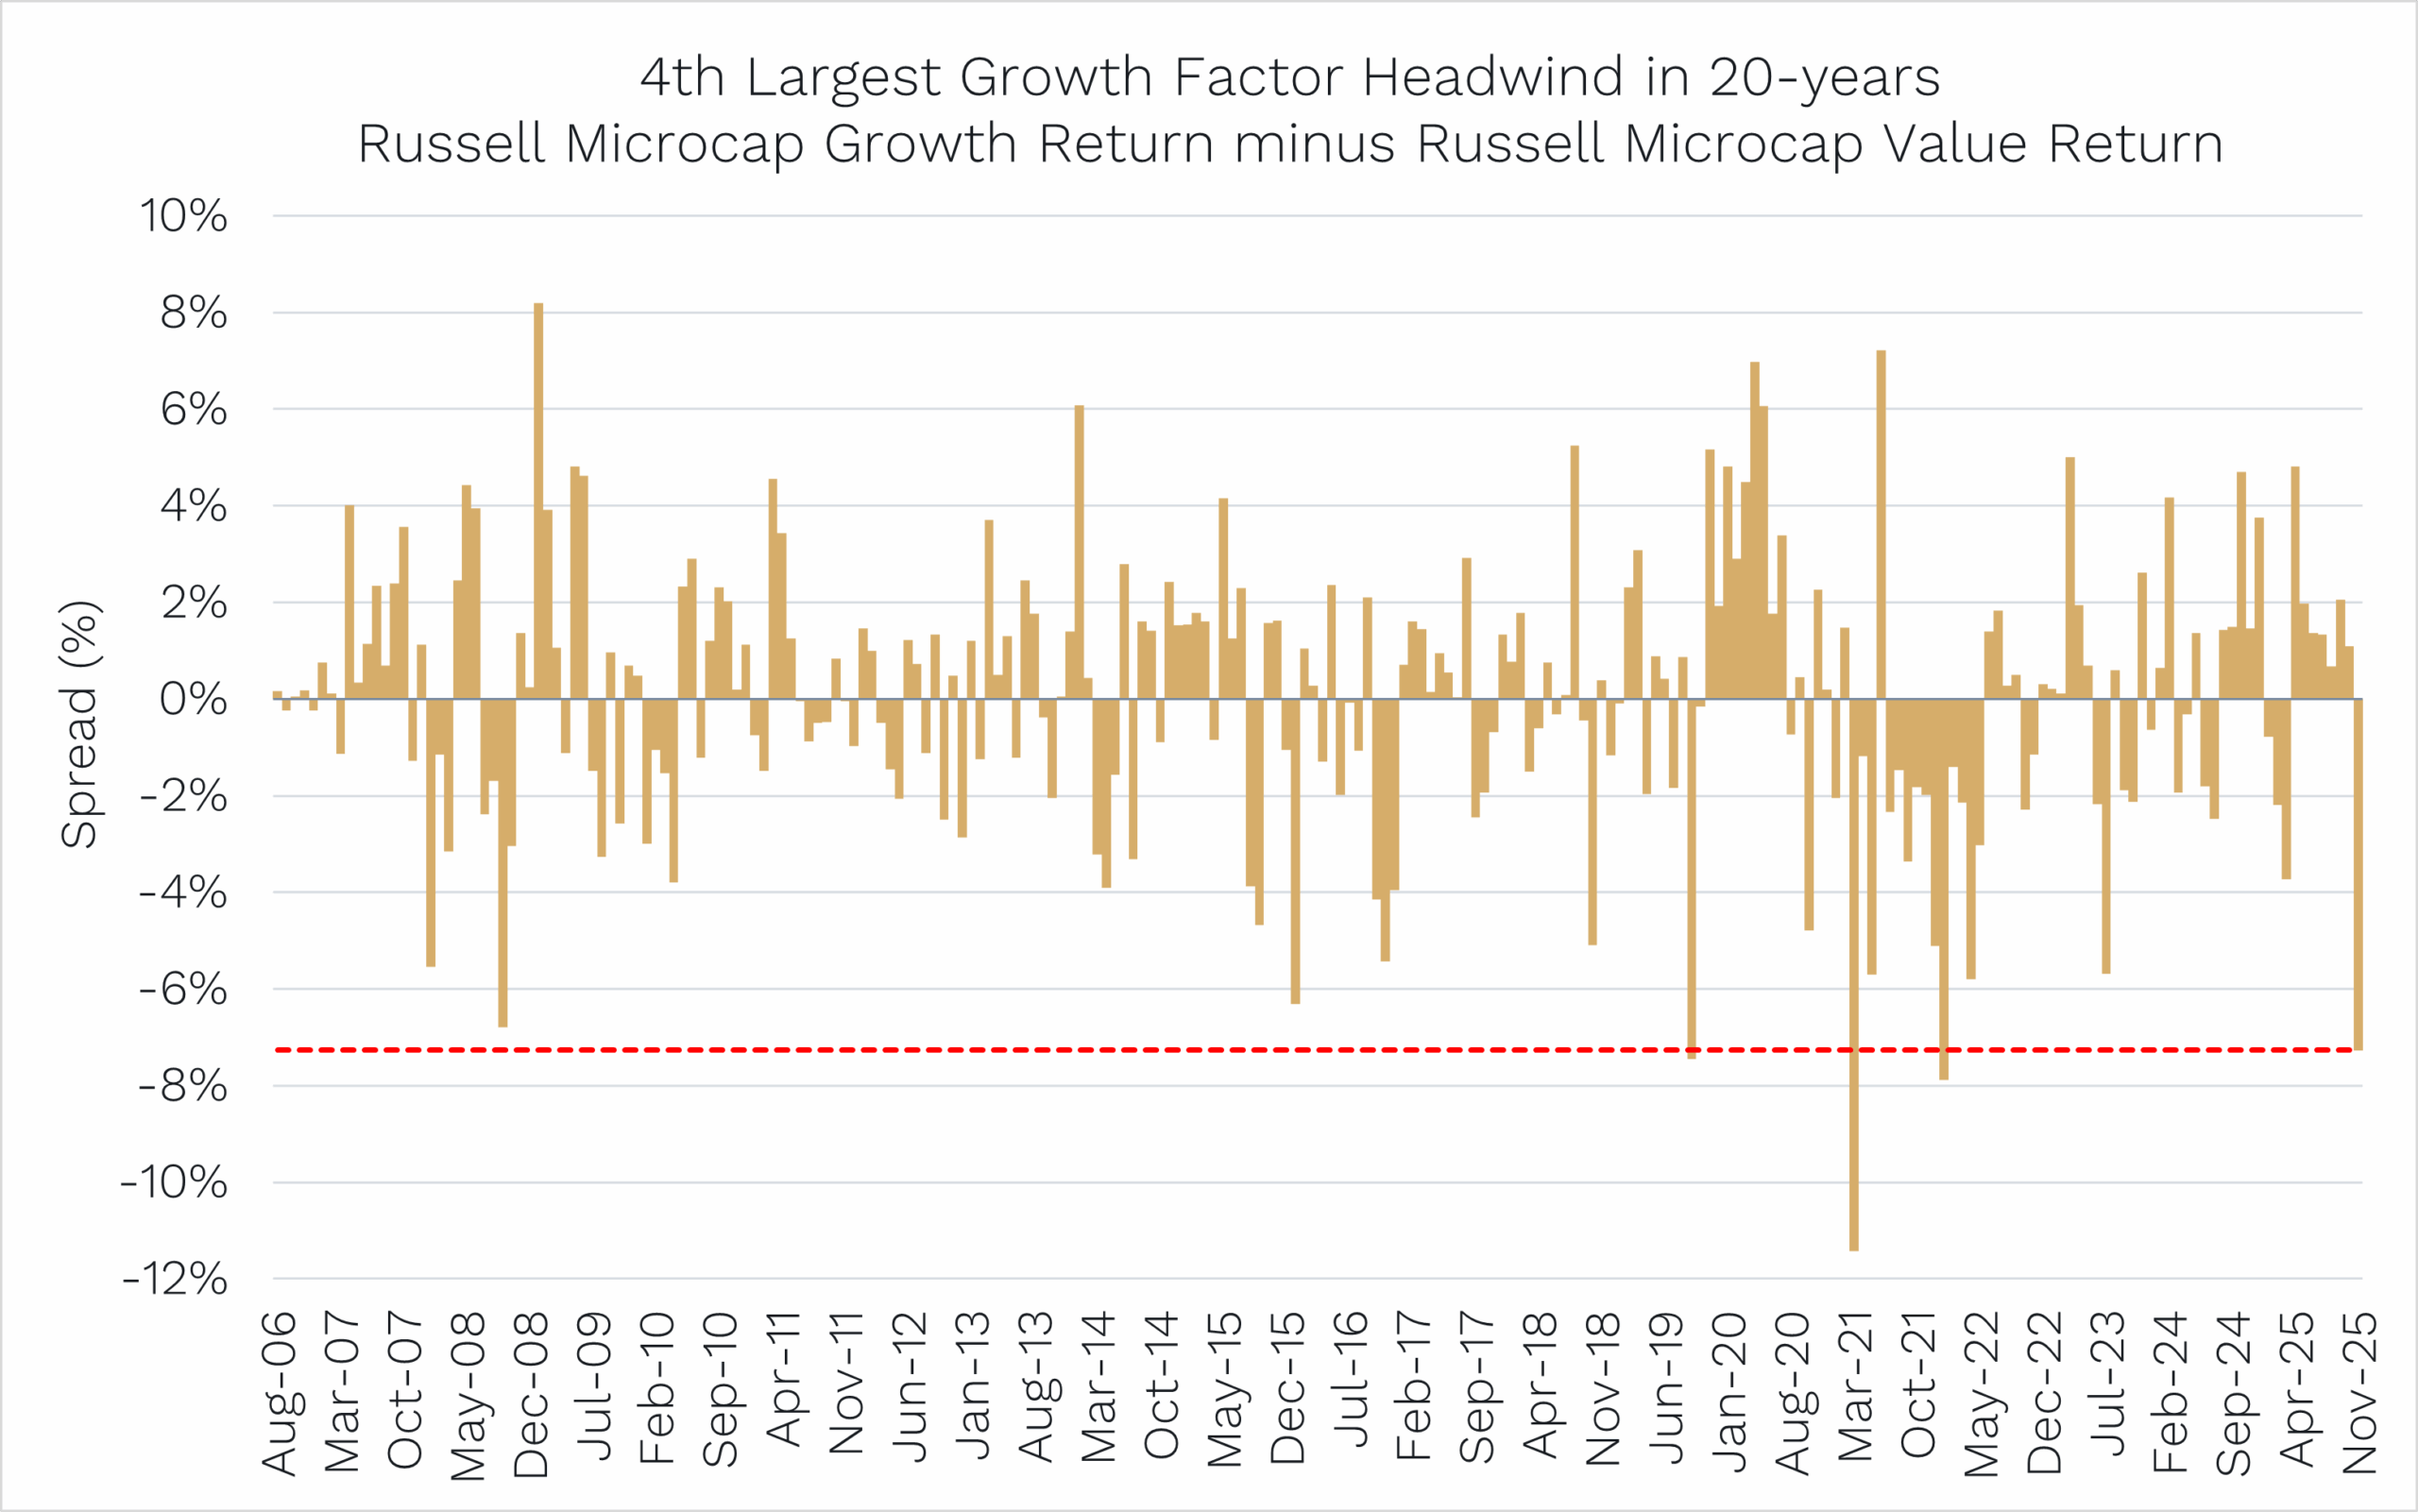
You will get some further idea of the relative factor performance of growth versus value-oriented companies in the U.S. in November in the microcaps chart below.

While we don’t really fish as low down the market capitalisation spectrum as microcaps, it shows that growth-oriented microcaps underperformed their value counterpart in November by the fourth most of any month in the last 20 years!

One of the largest factor headwinds – Growth vs Value

Source: Bloomberg. Data as of 30 November 2025.

Given the importance of the U.S. Federal Reserve in driving the direction of interest rate policy globally, this growth underperformance compared to value was broad based in the U.S. in November and also impacted the Australian share market.

Sticking with our edge

For Ophir, as a manager seeking to invest in higher-growth businesses (and why wouldn’t you in small caps, as that is where the next 10 or 20 bagger is found), this underperformance of growth naturally created a headwind for our performance in November.

In the last week or so of November, as further Fed Governors came out in support of an end-of-year cut, Fed rate cut probabilities for its December meeting headed back towards 100%. However, that led to only a partial recovery in the underperformance of smaller, less liquid growth businesses.

But now, at the time of writing in December, growth style companies in the U.S are continuing their recovery from the November factor underperformance, and as a result, our Ophir Global Funds have outperformed so far in December.

There will be times where having a growth factor bias will be like running into the wind; other times, it’s like running with a wind at your back.

But, ultimately, companies that consistently grow earnings faster than market expectations will be rewarded, and finding them is where we believe our edge is.

Market Entry – dip your toe or jump in all at once?

Back to this month’s key topic!

You’ve got a lump sum of cash, and you want to start investing in the stock market. You might consider ploughing it all in today. But then you worry: what if the share market then slumps?

Fortunately, there is a wealth of data available that can help investors make better-informed decisions.

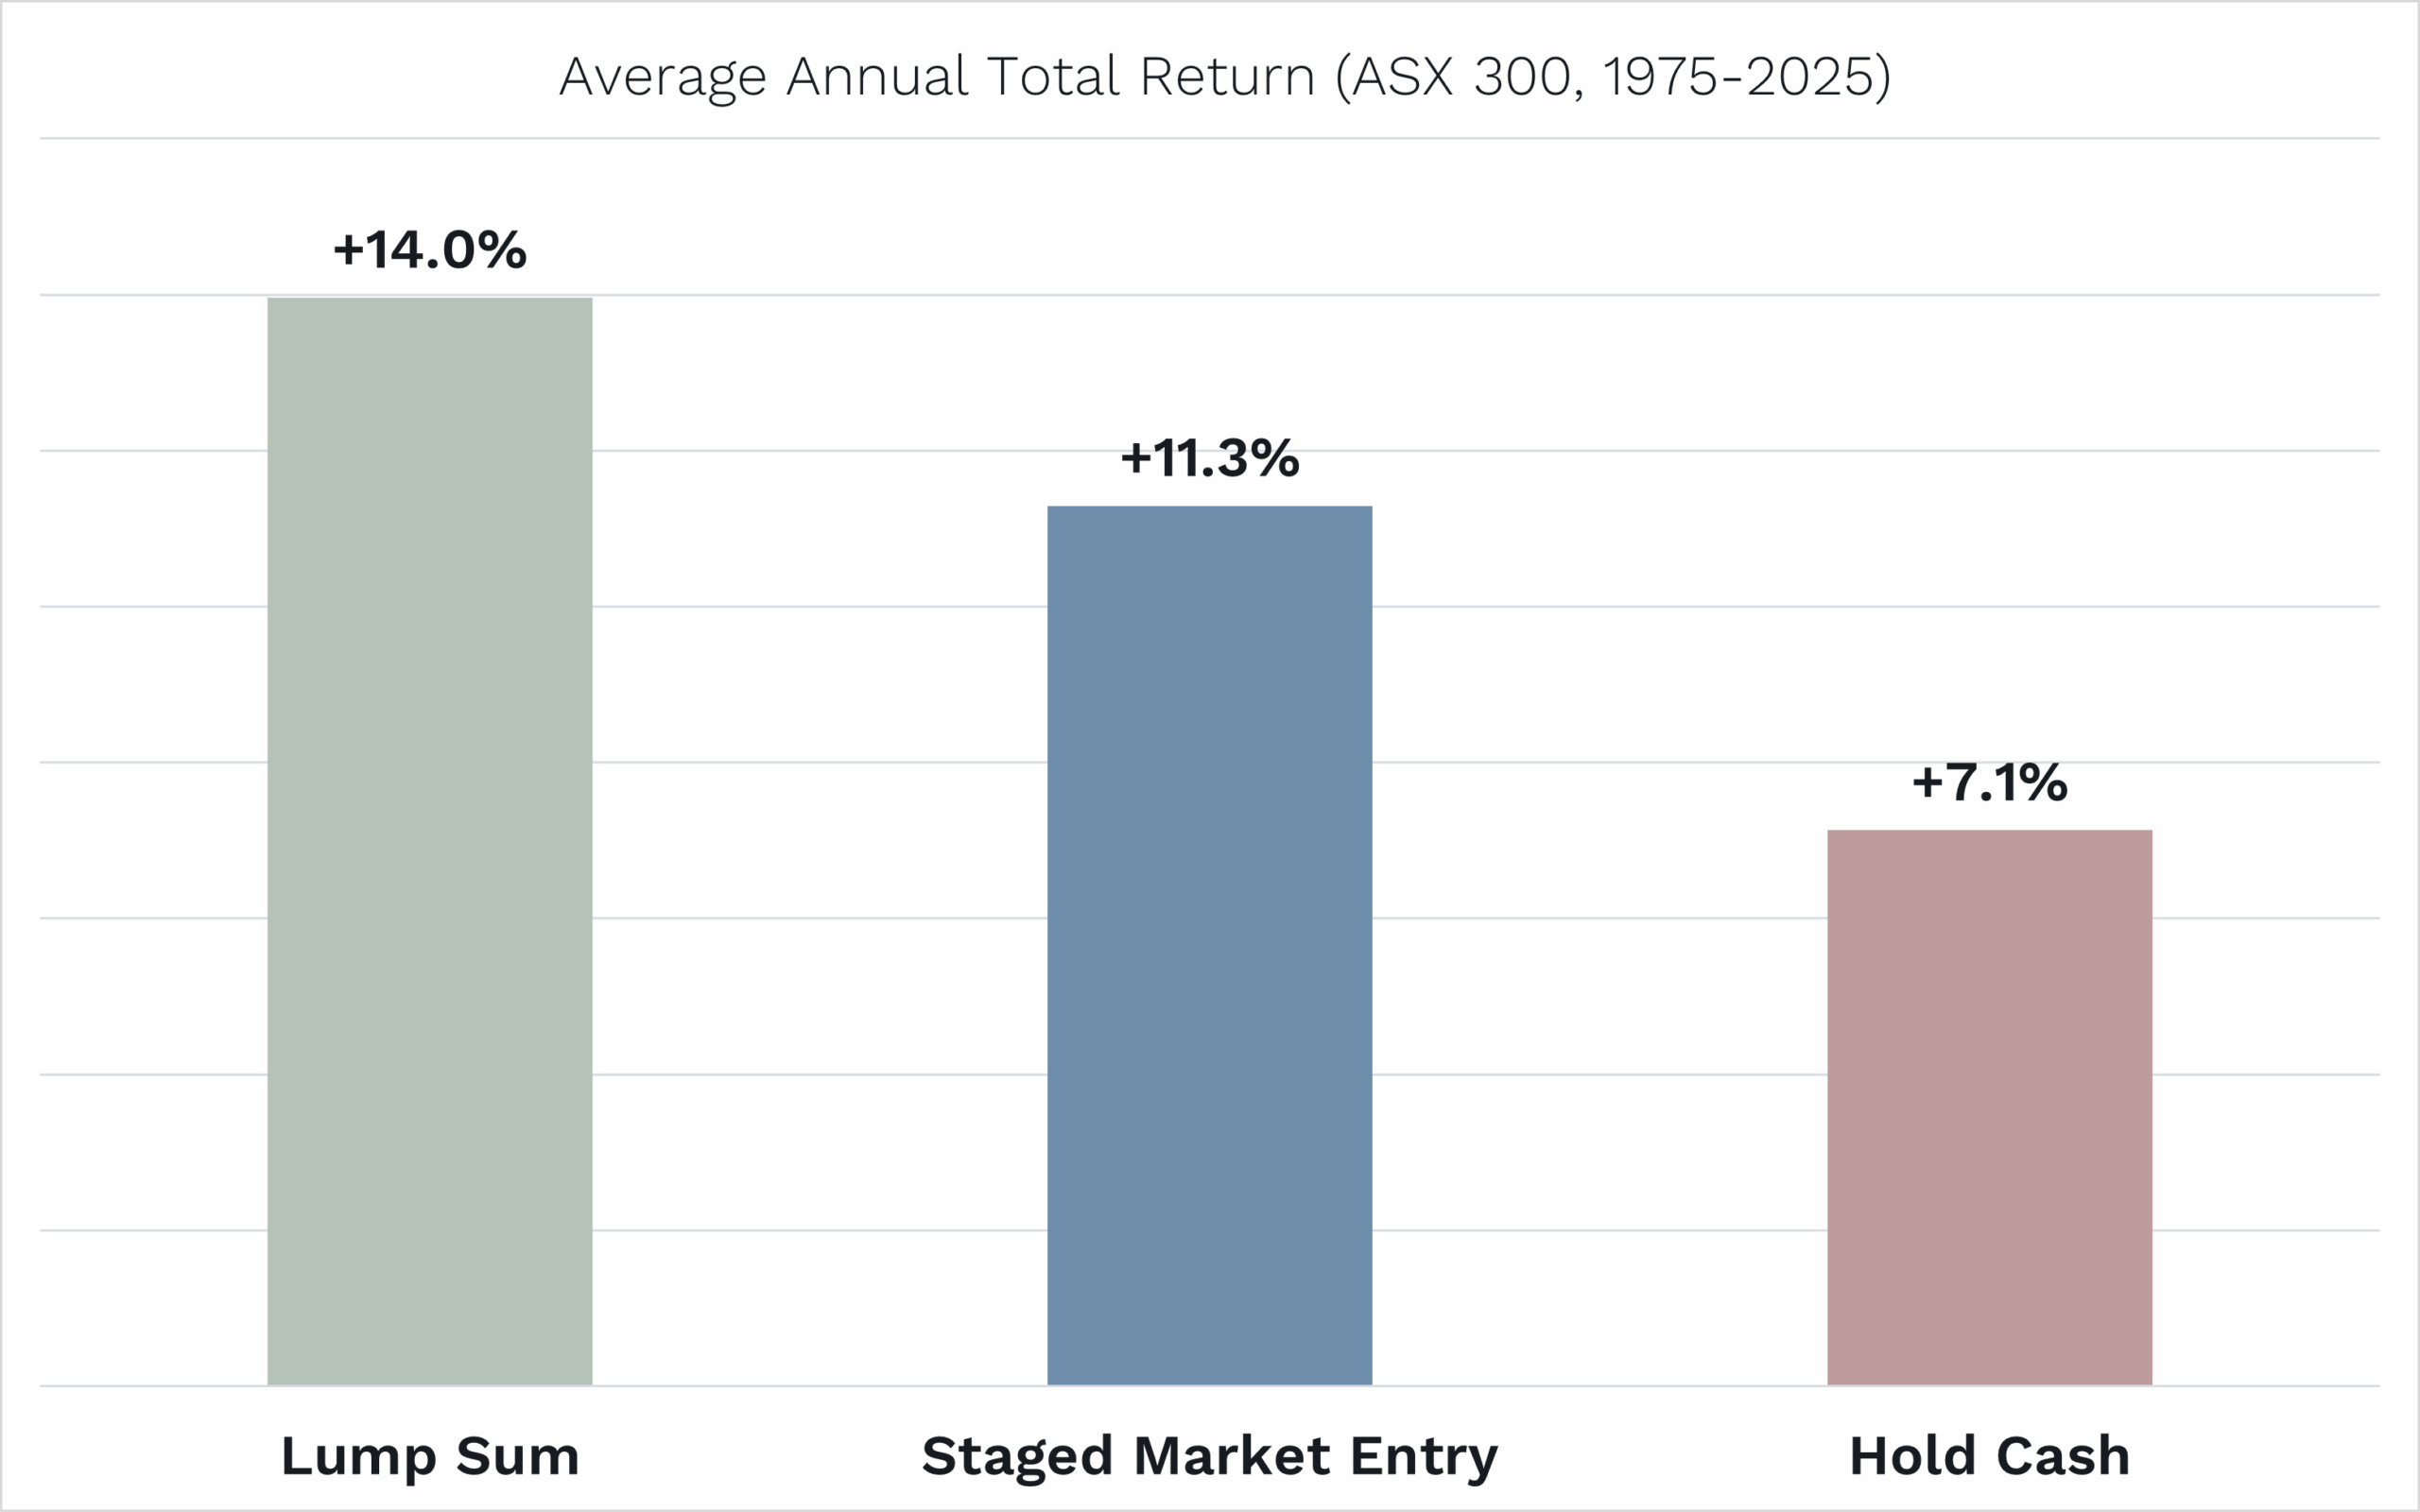
Below, for the last 50 years of Australian share market data (ASX 300 index), you can see the average 12-month results for

  • ‘Lump sum’ investing (investing all at once).
  • ‘Staged market entry’ (four equal investments at the start of each quarter over 12 months).

Source: Bloomberg. ASX 300 total return used for Lump Sum option. ASX 300 total return and Bloomberg Ausbond Bank Bill Index returns used for calculating Staged Market Entry return. Bloomberg Ausbond Bank Bill Index return used for Cash return.

On average, lump sum investing wins.

This makes sense because share markets tend to rise over a year. Delaying your investment through staged entry is, therefore, on average, going to hurt you.

And, of course, just sitting in cash earning interest has provided the worst result – though investors today would love to get a 7.1% return from their cash investment![1]

Lump sum risk

BUT, that is not the end of the story.

The world does not live in averages.

As famed investor Howard Marks said: “Never forget the six-foot-tall man who drowned crossing the river that was five feet deep on average”.

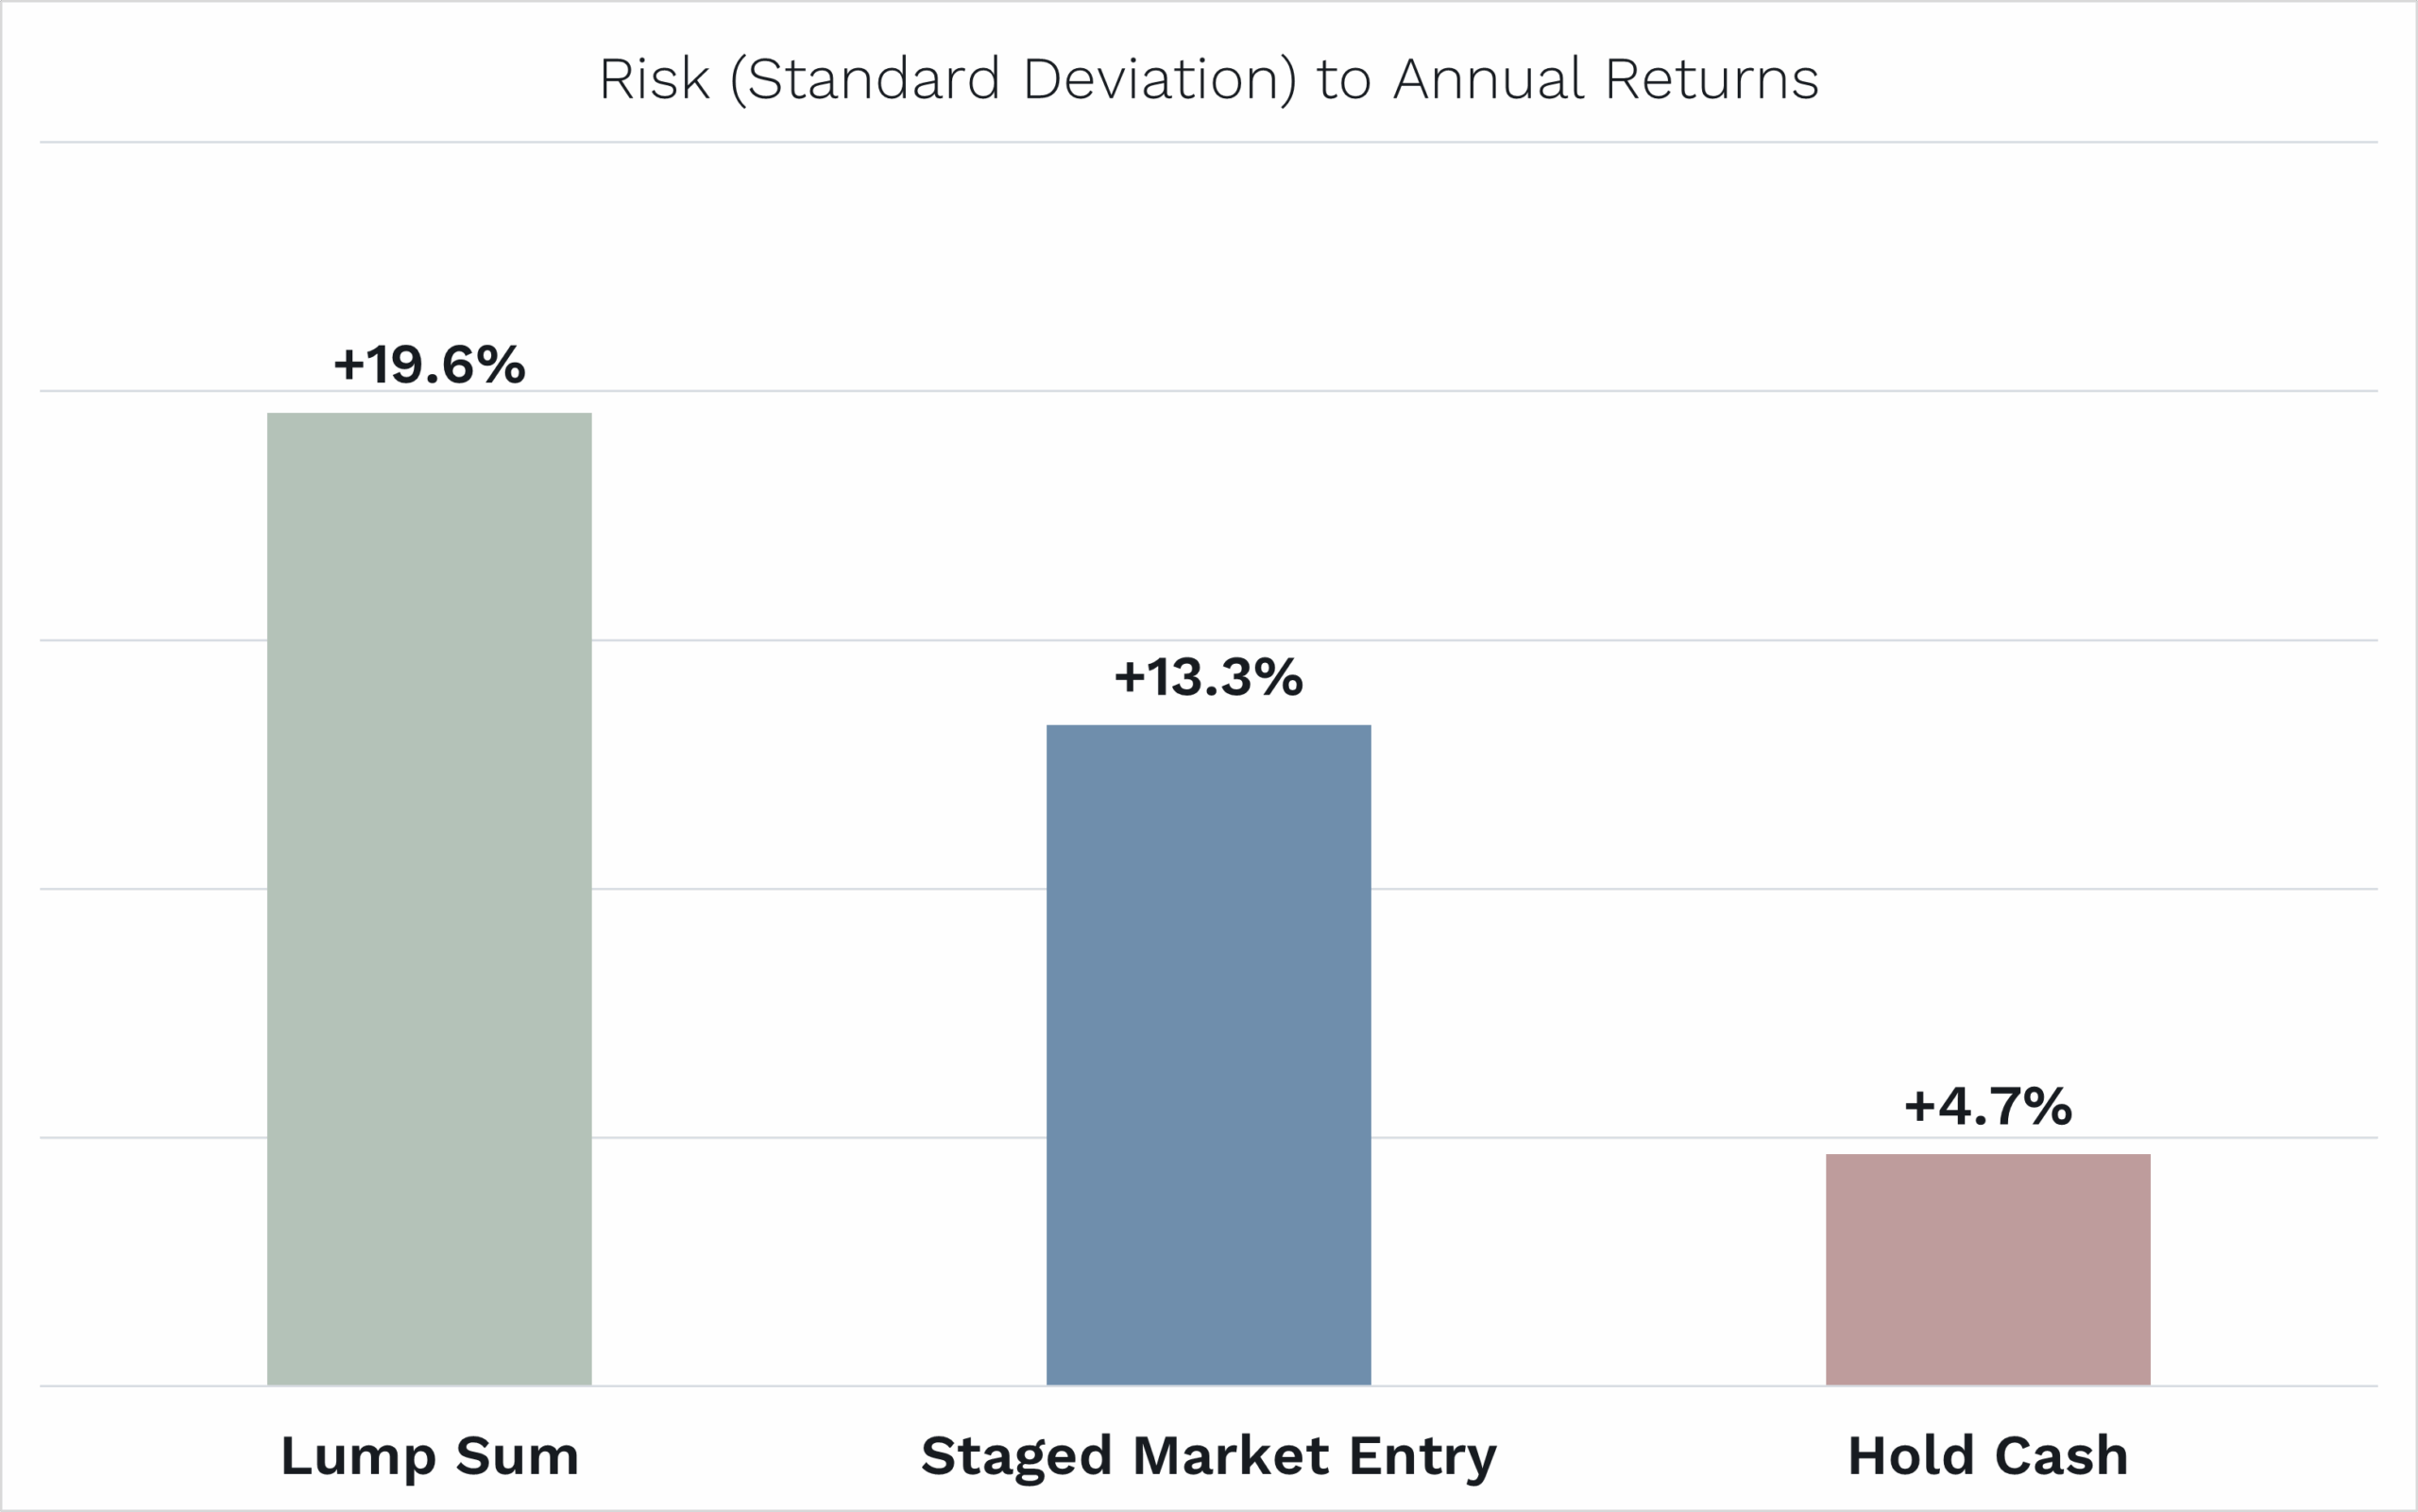
If we look at the ‘risk’ to those average annual returns we saw above – or the spread of outcomes around those averages – we see that lump sum investing was the riskiest.

Source: Bloomberg. Data from 1975 to 2025.

You don’t have to be a brainiac to understand why.

The share market return is more volatile than keeping all, or some, of your money earning interest from a cash investment. So going in all at once means you could do either a lot better than the 14% average … or a lot worse.

Naturally, by potentially staging their investment, it’s the ‘lot worse’ outcome investors are thinking of protecting against.

Like an insurance policy

So next up is the really insightful data to help you make your decision.

We have chopped share market returns over a year up into 10 deciles – or in other words, 10 equal baskets from the worst 10% of annual share market returns to the best 10%.

We have then looked at how much more, on average, you’d be better off from staging market entry compared to lump sum investing.

Source: Bloomberg. Data from 1975 to 2025.

What you can see is that:

  • Staging makes you better off if share market returns are in the lowest return four deciles, or the worst 40% of returns.
  • However, more often, staging makes you worse off because it underperforms in the best six deciles or best 60% of returns.
  • There is also a ‘negative skew’ to staging. That is, staging makes you worse off to a greater extent in the best returning share market environments than it makes you better off in the worst returning share markets (i.e. -16.2% versus +10.2%).

The best way to think of staging market entry is like an insurance policy on your house burning down. Most of the time, you won’t need the policy, and it’s costing you money.

However, if your house burns down, or in this case, if you have unfortunate market timing and the share market falls after you’ve just started investing, then staging will have saved you money.

Why not just be a better market timer and only invest in a lump sum when you know the share market is going to go up over the next 12 months?

Sadly, that’s not possible.

Things like an expensive share market, or one that has gone up a lot over the past year, have virtually zero predictive power of what the share market is going to do over the next year.

And the longer you wait in cash for a ‘perfect’ share market opportunity, the likely longer you will have been sitting on the sidelines watching a rising share market go by.

A better-informed decision

So, as we see it, just like whether to purchase insurance for a house that might burn down, each individual needs to make up their own mind as to whether the insurance from staging your market entry – which will likely cost you money on average – is worth it for the peace of mind that it will have saved you money if share market returns turn out poor over the next year.

In our experience, for big, meaningful investments, many people choose to stage.

Ultimately, the choice is yours.

But hopefully, you are a little more informed now to make your decision.


[1] This seemingly high 7.1% average 12-month cash return is so high in large part due to the high interest rate/inflation years in the 80s and early 90s.


As always, if you’d like to chat to us about any of the Funds, please feel free to call us on (02) 8188 0397 or email us at ophir@ophiram.com.

Thank you for entrusting your capital with us.

Kindest regards,
Andrew Mitchell & Steven Ng

Co-Founders & Senior Portfolio Managers

Ophir Asset Management

This document has been prepared by Ophir Asset Management Pty Ltd (ABN 88 156 146 717, AFSL 420082) (“Ophir”) and contains information about one or more managed investment schemes managed by Ophir (the “Funds”) as at the date of this document. The Trust Company (RE Services) Limited ABN 45 003 278 831, the responsible entity of, and issuer of units in, the Ophir High Conviction Fund (ASX: OPH), the Ophir Global Opportunities Fund and the Ophir Global High Conviction Fund. Ophir is the trustee and issuer of the Ophir Opportunities Fund.

This is general information only and is not intended to provide you with financial advice and does not consider your investment objectives, financial situation or particular needs.  You should consider your own investment objectives, financial situation and particular needs before acting upon any information provided and consider seeking advice from a financial advisor if necessary. Before making an investment decision, you should read the relevant Product Disclosure Statement (“PDS”) and Target Market Determination (“TMD”) available at www.ophiram.com or by emailing Ophir at ophir@ophiram.com. The PDS does not constitute a direct or indirect offer of securities in the US to any US person as defined in Regulation S under the Securities Act of 1993 as amended (US Securities Act).

All Ophir Funds are deemed high risk within their respective Target Market Determination documentation.  Ophir does not guarantee the performance of the Funds or return of capital.  An investment may achieve a lower than expected return and investors risk losing some or all of their principal investment.  Past performance is not a reliable indicator of future performance.  Any opinions, forecasts, estimates or projections reflect our judgment at the date of this was prepared, and are subject to change without notice.  Rates of return cannot be guaranteed and any forecasts, estimates or projections as to future returns should not be relied on, as they are based on assumptions which may or may not ultimately be correct.

Actual returns could differ significantly from any forecasts, estimates or projections provided.

The Trust Company (RE Services) Limited is a part of the Perpetual group of companies. No company in the Perpetual Group (Perpetual Limited ABN 86 000 431 827 and its subsidiaries) guarantees the performance of any fund or the return of an investor’s capital.
 

Previous

13 Nov, 2025 Letter to Investors - October 2025

Next

16 Dec, 2025 Stock in Focus - Zeta Global (NYSE: ZETA)
13 Nov, 2025

Letter to Investors - October 2025

Letter to Investors • 12 mins read

Back to Insights Back to Insights

PDF

In this edition of our Letter to Investors, we look at what it takes to become – and to select – an award-winning fund, including:

  • Our fantastic win at this year’s Australian Fund Manager Foundation Awards
  • The vital importance of long-term consistency in becoming a top-performing fund
  • Why investing in the ‘best-performing’ fund of the year isn’t always a path to riches
  • Three elements that have contributed to the success of our Ophir Opportunities Fund (including a relentless focus on earnings)
  • Why we’re so excited about the outlook for our global small cap fund


Pounding the Rock – the Stonecutter’s credo

When nothing seems to help, I go look at a stonecutter hammering away at his rock, perhaps a hundred times without as much as a crack showing in it. Yet at the hundred and first blow it will split in two, and I know it was not that blow that did it, but all that had gone before. – Jacob Riis

The above quote is from The Making of an American, a 1901 book by the Danish American journalist Jacob Riis. It was about the idea that success often comes after long unseen labour.

NBA basketball team the San Antonio Spurs adopted it as a team motto under Hall of Fame and five-time Championship coach Greg Popovich.

It’s one that we love here at Ophir and one we’ll come back to in this month’s Letter.


Ophir awarded best Australian Small Companies Manager 2025

But first, we’d like to share some exciting news – the Ophir team took home a major win last month at the Australian Fund Manager Foundation Awards, where we were named Best Australian Small Companies Manager for 2025.

This is our favourite industry event for two reasons:

  1. It’s voted by a committee of industry peers. It’s not a ‘pay to play’ awards night like some others, where you have to pay to be considered. Bias-free is the best!
  2. It raises funds for community-based charities. This year the awards supported Odyssey House NSW and the Sydney Children’s Hospital Foundation.

As Andrew mentioned on the night, the award reflects a huge team effort – and it’s only possible thanks to the tremendous support and faith of our investors who trust us with some of their life savings.

This marks the first time our Aussie small-cap fund, the Ophir Opportunities Fund, has picked up the prize.

We’re extremely proud of its long-term performance. Initial investors have now made 18x their investment with the Fund clocking up +24.5% per annum after fees.

By comparison, the benchmark ASX Small Ordinaries Accumulation Index has returned 2.6x its initial investment, or +7.6% per annum.

That outperformance puts it well ahead of every other Australian equity fund launched since 2012 – as the chart below shows – when Ophir and the Opportunities Fund began.


How many years at the top?

You might look at the chart below and think, surely there are many years where you’ve had the top performing Australian Small Cap fund.

The reality? Just one – 2015.

Below is the ranking (according to Morningstar) of the Ophir Opportunities Fund out of all the Aussie small-cap funds each year, followed by the number of funds operating:

Year to date 2025: 5/211

2024: 2/207

2023: 26/192

2022: 58/184

2021: 42/173

2020: 39/160

2019: 10/146

2018: 94/140

2017: 2/123

2016: 109/118

2015: 1/107

2014: 19/103

2013: 3/99

2012 (from Aug): 2/98

What stands out?

First, there are a LOT of Australian Small Cap Funds! In fact, there are only 200 Australian small-cap stocks, so we now have more managers than stocks!

And while we’ve had strong results recently in 2024 and so far in 2025, we haven’t been at the very top every year.

Another way to look at our long-term consistency is through that familiar Year 10 maths favourite — the box and whisker chart.

In it, the ‘box’ shows the middle 50% of small-cap fund results, while the ‘whiskers’ stretch up to the best performers and down to the worst.


Box & Whisker Chart

Below, the Ophir Opportunities Fund’s returns are shown with the green “X’s” compared to all the other Aussie small-cap funds that were in operation each year.


Calendar Year Returns Aus Mid/ Small Peers

Source: Morningstar Australian Mid/Small Caps (Blend, Value, Growth).

Note: CY12 is August 2012 to December 2012. YTD25 is January 2025 to October 2025.


Four Lessons Learnt

So, what are the lessons for us and investors in general:

  1. You don’t need to be the best in any given year or even in many given years, to generate great returns over the long term. Being consistently good or very good is enough. We were near the top in a few years… with even a few positive outlier years.
  2. When we reviewed the names and holdings of some of the top funds in any given year, they often tend to have a ‘factor’ or ‘sector’ bias, and that bias gets over-rewarded that year – shooting the fund to the top and outperforming the true stock pickers. Be wary of those funds. Those biases often reverse. Today’s hero can quickly become tomorrow’s villain if it’s not backed up by a sound and repeatable investment process with an ‘edge’ on the market. Often the top-performing manager in a given year will have a big skew towards (for example) things like lithium, gold, AI, a high-beta levered balance sheet in a risk-on environment, etc, only to see performance suffer when that bias falls out of favour.
  3. Likewise, be wary of thinking reports in your favourite business newspaper about “this year’s best performing fund” offer a path to riches by investing with them. Far too many have poor performance in the years prior due to some factor that is out of favour. Their performance then pops when the factor mean reverts and they make the press – but you won’t read that in the article. “One of this year’s top performing managers has had a ripping year, after falling for each of the previous three years!”. At Ophir, we know our performance comes from stock picking not some big bias. That’s why it has been sustainable.
  4. It sounds trite, but avoiding horrible years is also important to long-term success. If you fall -50% you have to make a +100% return just to break even. 2016 was clearly a poor year of returns for us with the fund. You just can’t have too many of them… and fortunately, we haven’t. Every fund will have them, even the long-term top performing ones. Share prices don’t always follow a company’s business success in the short run.


Three Elements of Success

Reflecting on our award-winning year for our Ophir Opportunities Fund, what would we put our success down to? Three things stand out:

  1. Limited Capacity

If you have good performance, you can’t keep taking in money forever and a day. In funds management, size kills – especially in small caps. Take in too much money and you either have to:

  • Invest in larger companies. But they have more eyeballs on them, so it’s harder to get an edge on the market. We felt for Warren Buffett (but not too much!) for much of the latter part of his career having to manage hundreds of billions of dollars that could only be invested in the largest and most picked-over companies in the world. We are not foolish enough to believe we could find an edge investing in those businesses.
  • Own bigger stakes in the same-size companies. But that sees you incurring market impact costs to enter or exit. It also takes ages to get into or out of the positions, so you lose your ability to be nimble if your view changes quickly.
  • Own many more companies. But that dilutes your edge and outperformance potential as stock numbers blow out.

Of course, it could be a combination of all three. The history of funds management is littered with managers who had great initial performance, got too greedy, then saw performance suffer.

  1. Put all your money in your funds

It’s easier said than done, and maybe it’s not for everyone, but we subscribe to the Charlie Munger view: “You show me the incentive and I’ll show you the outcome”.

Or as former NSW Premier Jack Lang said – a quote repeated by former Australian Prime Minister Paul Keating – “In the race of life, always back self-interest, at least you know it’s trying”.

It’s one of the reasons we insist that investment team members who join us only invest in the Ophir Funds – it’s the best way to ensure their complete focus at work.

  1. And, finally, “Pound the Rock”!

We said we’d come back to it. Investing for us is about finding a process that works and trusting that process. There is a lot of noise in financial markets. Share prices don’t always track a company’s short-term success. You can get your analysis right, but you can’t account for all the thousands of different variables impacting a profit result. Some will go against you. That is life.

Even if you do all the work, get an edge on the market, and the profit result is better than the market expects, there is no guarantee the share price will go up in the short term.

As we’ve seen before from painful experience, you might be invested in a ‘consumer discretionary’ sector stock (take JB HiFi as an example), but investors suddenly don’t care about today’s earnings result. Instead, they’re focused on a possible recession around the corner and potentially poor future results. So they use the strong earnings news to exit the company, pushing its price down.

But as investing legend Peter Lynch says “A company’s earnings and stock price are 100% correlated in the long term”.

You’ve just got to keep pounding the rock and focus on getting the earnings result right. Eventually, the rock will crack and the share price – and ultimately the fund performance – will go the way you want.


An Easier Edge

It was fantastic to win an award recently for our original Ophir Opportunities Fund.

But as investors who have caught up with us lately have heard, it’s actually another Ophir fund that is receiving the most of our personal investments: the Ophir Global Opportunities Fund.

Why?

Simply, we think it will outperform the Ophir Opportunities Fund over the next five-plus years.

Global small caps are a lot cheaper than Aussie small caps at present. With one-fund-manager-per-stock in Aussie small caps, it could be slightly easier to get an edge on global small caps these days. Plus its also got some great runs on the board, returned +19.1% p.a. after fees since inception in 2018.

As always, if you’d like to chat to us about any of the Funds, please feel free to call us on (02) 8188 0397 or email us at ophir@ophiram.com.

As always, thank you for entrusting your capital with us.

Kindest regards,

Andrew Mitchell & Steven Ng

Co-Founders & Senior Portfolio Managers

Ophir Asset Management

This document has been prepared by Ophir Asset Management Pty Ltd (ABN 88 156 146 717, AFSL 420082) (“Ophir”) and contains information about one or more managed investment schemes managed by Ophir (the “Funds”) as at the date of this document. The Trust Company (RE Services) Limited ABN 45 003 278 831, the responsible entity of, and issuer of units in, the Ophir High Conviction Fund (ASX: OPH), the Ophir Global Opportunities Fund and the Ophir Global High Conviction Fund. Ophir is the trustee and issuer of the Ophir Opportunities Fund.

This is general information only and is not intended to provide you with financial advice and does not consider your investment objectives, financial situation or particular needs.  You should consider your own investment objectives, financial situation and particular needs before acting upon any information provided and consider seeking advice from a financial advisor if necessary. Before making an investment decision, you should read the relevant Product Disclosure Statement (“PDS”) and Target Market Determination (“TMD”) available at www.ophiram.com or by emailing Ophir at ophir@ophiram.com. The PDS does not constitute a direct or indirect offer of securities in the US to any US person as defined in Regulation S under the Securities Act of 1993 as amended (US Securities Act).

All Ophir Funds are deemed high risk within their respective Target Market Determination documentation.  Ophir does not guarantee the performance of the Funds or return of capital.  An investment may achieve a lower than expected return and investors risk losing some or all of their principal investment.  Past performance is not a reliable indicator of future performance.  Any opinions, forecasts, estimates or projections reflect our judgment at the date of this was prepared, and are subject to change without notice.  Rates of return cannot be guaranteed and any forecasts, estimates or projections as to future returns should not be relied on, as they are based on assumptions which may or may not ultimately be correct.

Actual returns could differ significantly from any forecasts, estimates or projections provided.

The Trust Company (RE Services) Limited is a part of the Perpetual group of companies. No company in the Perpetual Group (Perpetual Limited ABN 86 000 431 827 and its subsidiaries) guarantees the performance of any fund or the return of an investor’s capital.
 

Previous

13 Nov, 2025 Stock in Focus - Exosens (EXENS: FP)

Next

16 Dec, 2025 Letter to Investors - November 2025
13 Nov, 2025

Stock in Focus - Exosens (EXENS: FP)

Stock in Focus • 6 mins read

Back to Insights Back to Insights

PDF

Seeing in the Dark

At Ophir, we’re always looking for exceptional businesses sitting just outside the spotlight. That’s how we came across Exosens, the European leader in night-vision components.

We first encountered Exosens – which is based in Merignac, France – through our investment in Theon International (THEON), a night-vision device manufacturer that IPO’d in February 2024. During diligence on THEON, it became clear that a key strategic supplier, Exosens, was a company we needed to know better.

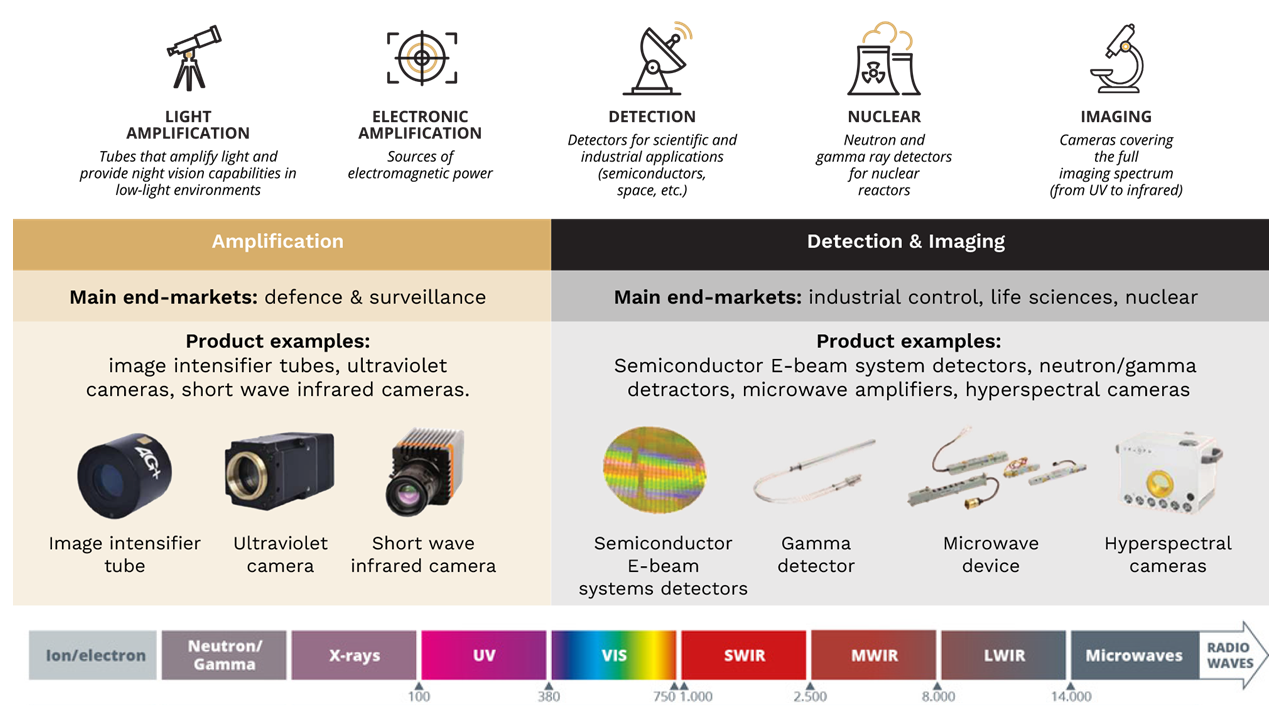
Exosens is the European leader in high-performance electro-optical technologies. It specialises in image intensifier tubes (IITs), the critical components used in night-vision goggles and weapon sights. (The tubes convert low-level light into bright images that humans can see.)

With more than 85 years of experience, Exosens has quietly built a strategic position as a mission-critical supplier to NATO forces, holding 42% global market share in IITs, and 72% market share ex-U.S.

Importantly, Exosens is “ITAR-free”, meaning it is not subject to U.S. arms export restrictions – a major advantage for European buyers seeking sovereign and secure supply chains.

Outside defence, Exosens also supplies radiation detection (24% global share), nuclear control components (38%), and imaging systems for high-end medical, scientific, and industrial use (~7% share overall, focused on niche segments). These non-defence operations provide valuable diversification and help create a steadier, less cyclical earnings base than defence alone.


Company Overview

Source: Exosens Company Report October 2025.

So when Exosens went public in June 2024, we were ready. With a front-row seat for the THEON process, and strong conviction in the electro-optical space, we became a top-five initial holder in Exosens. Since its IPO, Exosens shares have surged around ~130%, supported by growing investor enthusiasm for defence-related stocks.

After a three-day research trip to Europe in September 2025 – where Exosens stood out among 15 company meetings – we increased our position further.

Exosens is one of the most attractive under-the-radar growth stories in the whole defence and industrial imaging landscape. We are confident it will remain a fantastic investment for several key reasons.


1. A Secular Defence Tailwind

The first is that the company is well placed to benefit from surging defence spending in Europe.

The global market for night-vision IITs is highly concentrated. Alongside U.S.-based L3Harris and ElbitUSA, Exosens is the only other player of scale. Importantly, it is the only non-U.S. option with mass production capabilities and NATO credibility.

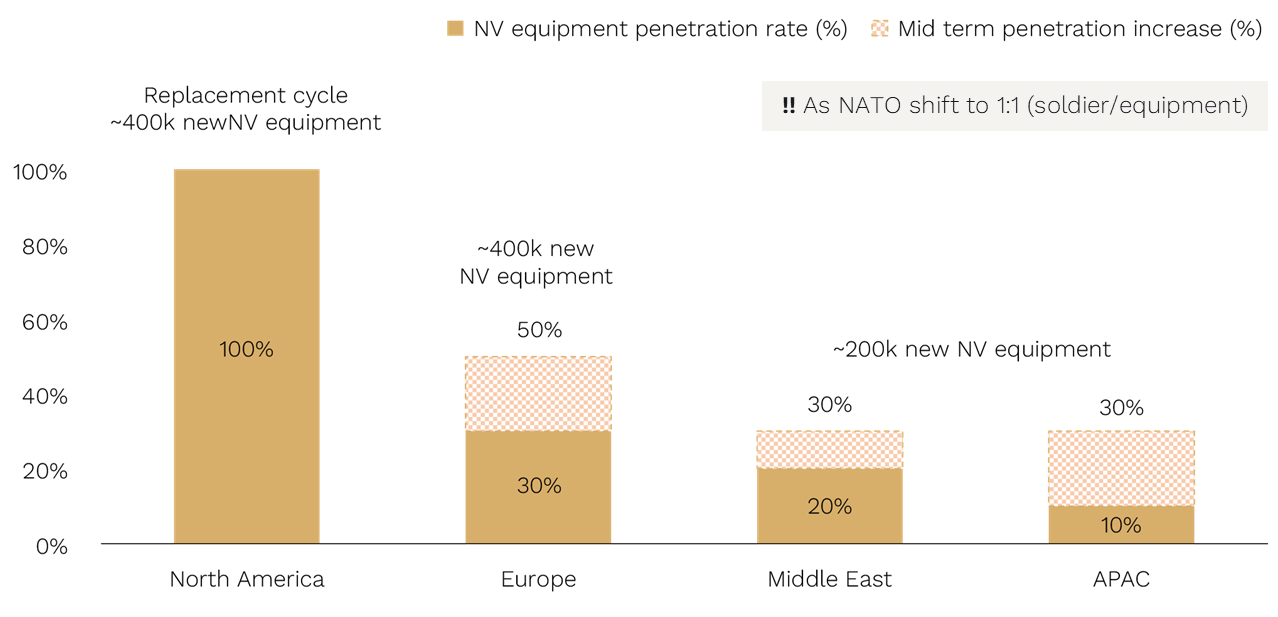
Europe’s penetration rate for night-vision remains low at ~30%, compared to ~100% in the U.S., offering Exosens significant room for growth.

If Europe’s penetration rate were to increase to 50%, it would imply roughly 400,000 additional devices – each requiring one or two IITs, depending on whether they are monocular or binocular.

Further supporting demand, Germany has announced plans to expand its armed forces by 40–45% by 2030, from approximately 180,000 to 260,000 troops.


Procurement ratio and penetration remain low outside of the U.S.

Source: Exosens Company Report October 2025.

As defence budgets across NATO continue to rise, electro-optics are growing even faster, driven by rising electronics use in warfare; night-fighting capability gaps across Europe; and shifting NATO procurement policies that favour ITAR-free, interoperable technologies.

We believe Exosens is uniquely positioned to capture this growth as the only European manufacturer producing mission-critical IITs at scale.


2. A Clear Vote of Confidence from THEON

Further supporting our thesis is that THEON recently entered into an agreement to purchase a 9.8% strategic stake in Exosens at a ~25% premium to the last close prior to the announcement (EUR54.00 per share).

The rationale for THEON’s deal with Exosens is two-fold:

  • It strengthens THEON’s relationship with Exosens as its key supplier for image intensifier tubes, thereby mitigating supply risks in the near term; and
  • It lays the ground for future collaboration on digital technologies which can provide further capabilities to night-vision products and other product segments.

We see this as a strong validation of both Exosens’ strategic importance and the robust demand outlook for THEON’s products.


3. Diversification and M&A

The third reason is Exosens’ track record of successfully diversifying through acquisitions.

Since 2022, Exosens has completed eight acquisitions, expanding its reach into nuclear, detection, and industrial control markets. These deals bring not only incremental revenue but also margin uplift and a more diversified customer base.

Exosens has also attracted suitors of its own. In 2020, U.S. electro-optical conglomerate Teledyne (TDY) made a bid for Exosens at roughly 11x EBITDA – before the surge in valuations following the Ukraine conflict. The bid was blocked by the French government due to the company’s strategic importance, and Teledyne went on to acquire FLIR Systems (FLIR) a year later for 17x EBITDA.

In calls with former Teledyne employees, we confirmed that the bid for Exosens was driven by its superior technology and market access – reinforcing our conviction in the quality and positioning of the business.


4. High Margin Optionality: Drone Imaging

The final reason for our confidence in Exosens’ ongoing success is the massive potential in drones.

Exosens also supplies imaging technology to the drone market, though it is not yet a material contributor to group earnings. Our research with a dozen global drone companies suggests this could evolve into a meaningful revenue stream, with incremental margins exceeding 60%. While it may not appear in near-term results, it provides substantial upside optionality for future years.

In our view, the market continues to underestimate the scale of this drone opportunity.

Just look below at the comparison to some Australian-listed companies – Droneshield and Electro Optic Systems – that saw significant share price appreciation on the global defence thematic.

(These two names have given back a lot of the recent gains, which demonstrates the volatility associated with investing in an undiversified business exposed to a ‘hot’ thematic.)

By the numbers, every US$50m of incremental drone revenue would be ~US$30m of EBITDA, adding ~15% to outer year EBITDA.

If even a portion of Exosens’ drone exposure materialises, its earnings base could expand materially and potentially warrant a significant multiple re-rating in line with other high-growth defence and imaging peers.


Gaining Our Edge Through the Fog of War

Exosens has carved out a rare position: a high-margin, IP-rich business with both defensive resilience and offensive growth.

We expect the company to deliver a top-line compound annual growth rate (CAGR) in the mid-teens over the next three to five years, underpinned by strong structural demand and disciplined execution.

We also anticipate continued EBITDA margin expansion driven by operating leverage, scale benefits, and an improving business mix.

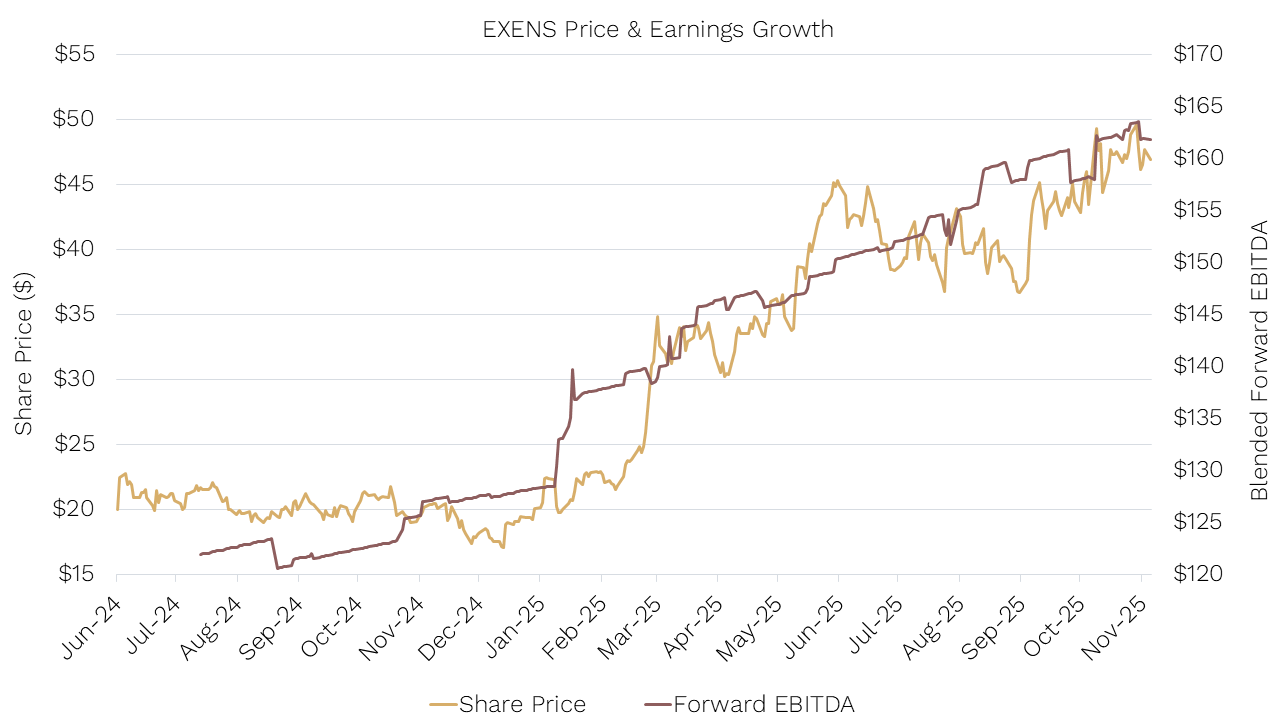
Despite this growth potential – and the advantages outlined above – Exosens still trades on an attractive forward 12-month valuation of around ~15x EBITDA.

Source: Ophir. Bloomberg. Data as of November 2025.

Exosens sits at the crossroads of national security, advanced optics, and industrial innovation.

With a growing customer base, increasing optionality in high-growth verticals such as drones, and strong backing from sovereign governments, we believe Exosens stands out as one of the most compelling under-the-radar compounders in the European small-cap landscape today.

Previous

17 Oct, 2025 It's time to start thinking small.

Next

13 Nov, 2025 Letter to Investors - October 2025
17 Oct, 2025

It's time to start thinking small.

Livewire • 3 mins read

Back to Insights Back to Insights

As the internet fuelled euphoria of the dot-com bubble burst in 2000, falling interest rates and a rotation out of large caps led to a period of significant outperformance for small companies.

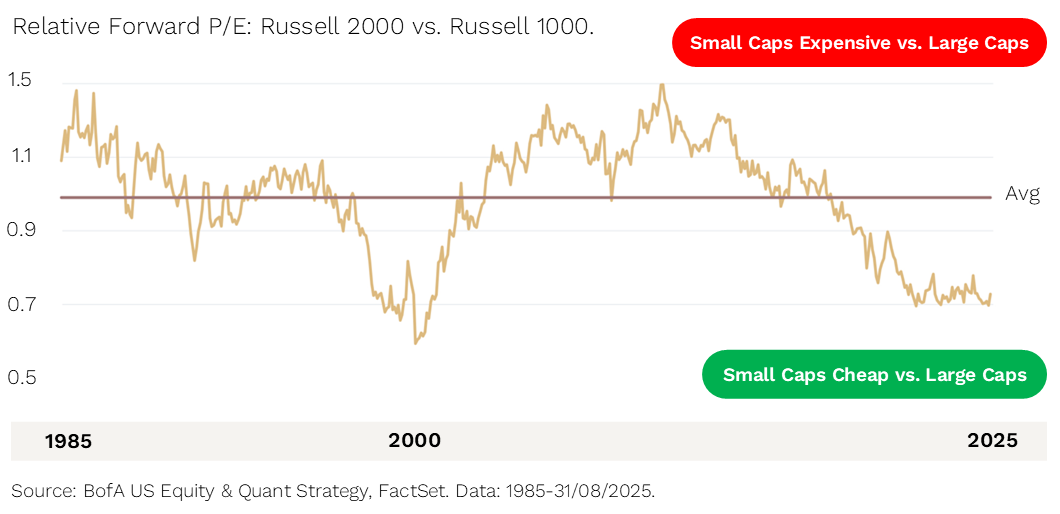
Fast forward 25 years – large caps are trading at the largest premium to small caps (see chart further below) since then and the U.S. Federal Reserve has re-commenced its rate cutting cycle.

For over 13 years, Ophir has focused on discovering those hidden gems outside the large-cap universe – businesses that are doing better than the market expects.

Invest with Ophir: Invest

Join our Newsletter: Subscribe


Our Opportunities Funds

Our flagship small cap strategies, the Ophir Opportunities Fund and the Ophir Global Opportunities Fund, have delivered consistent, long-term outperformance by staying true to this process.

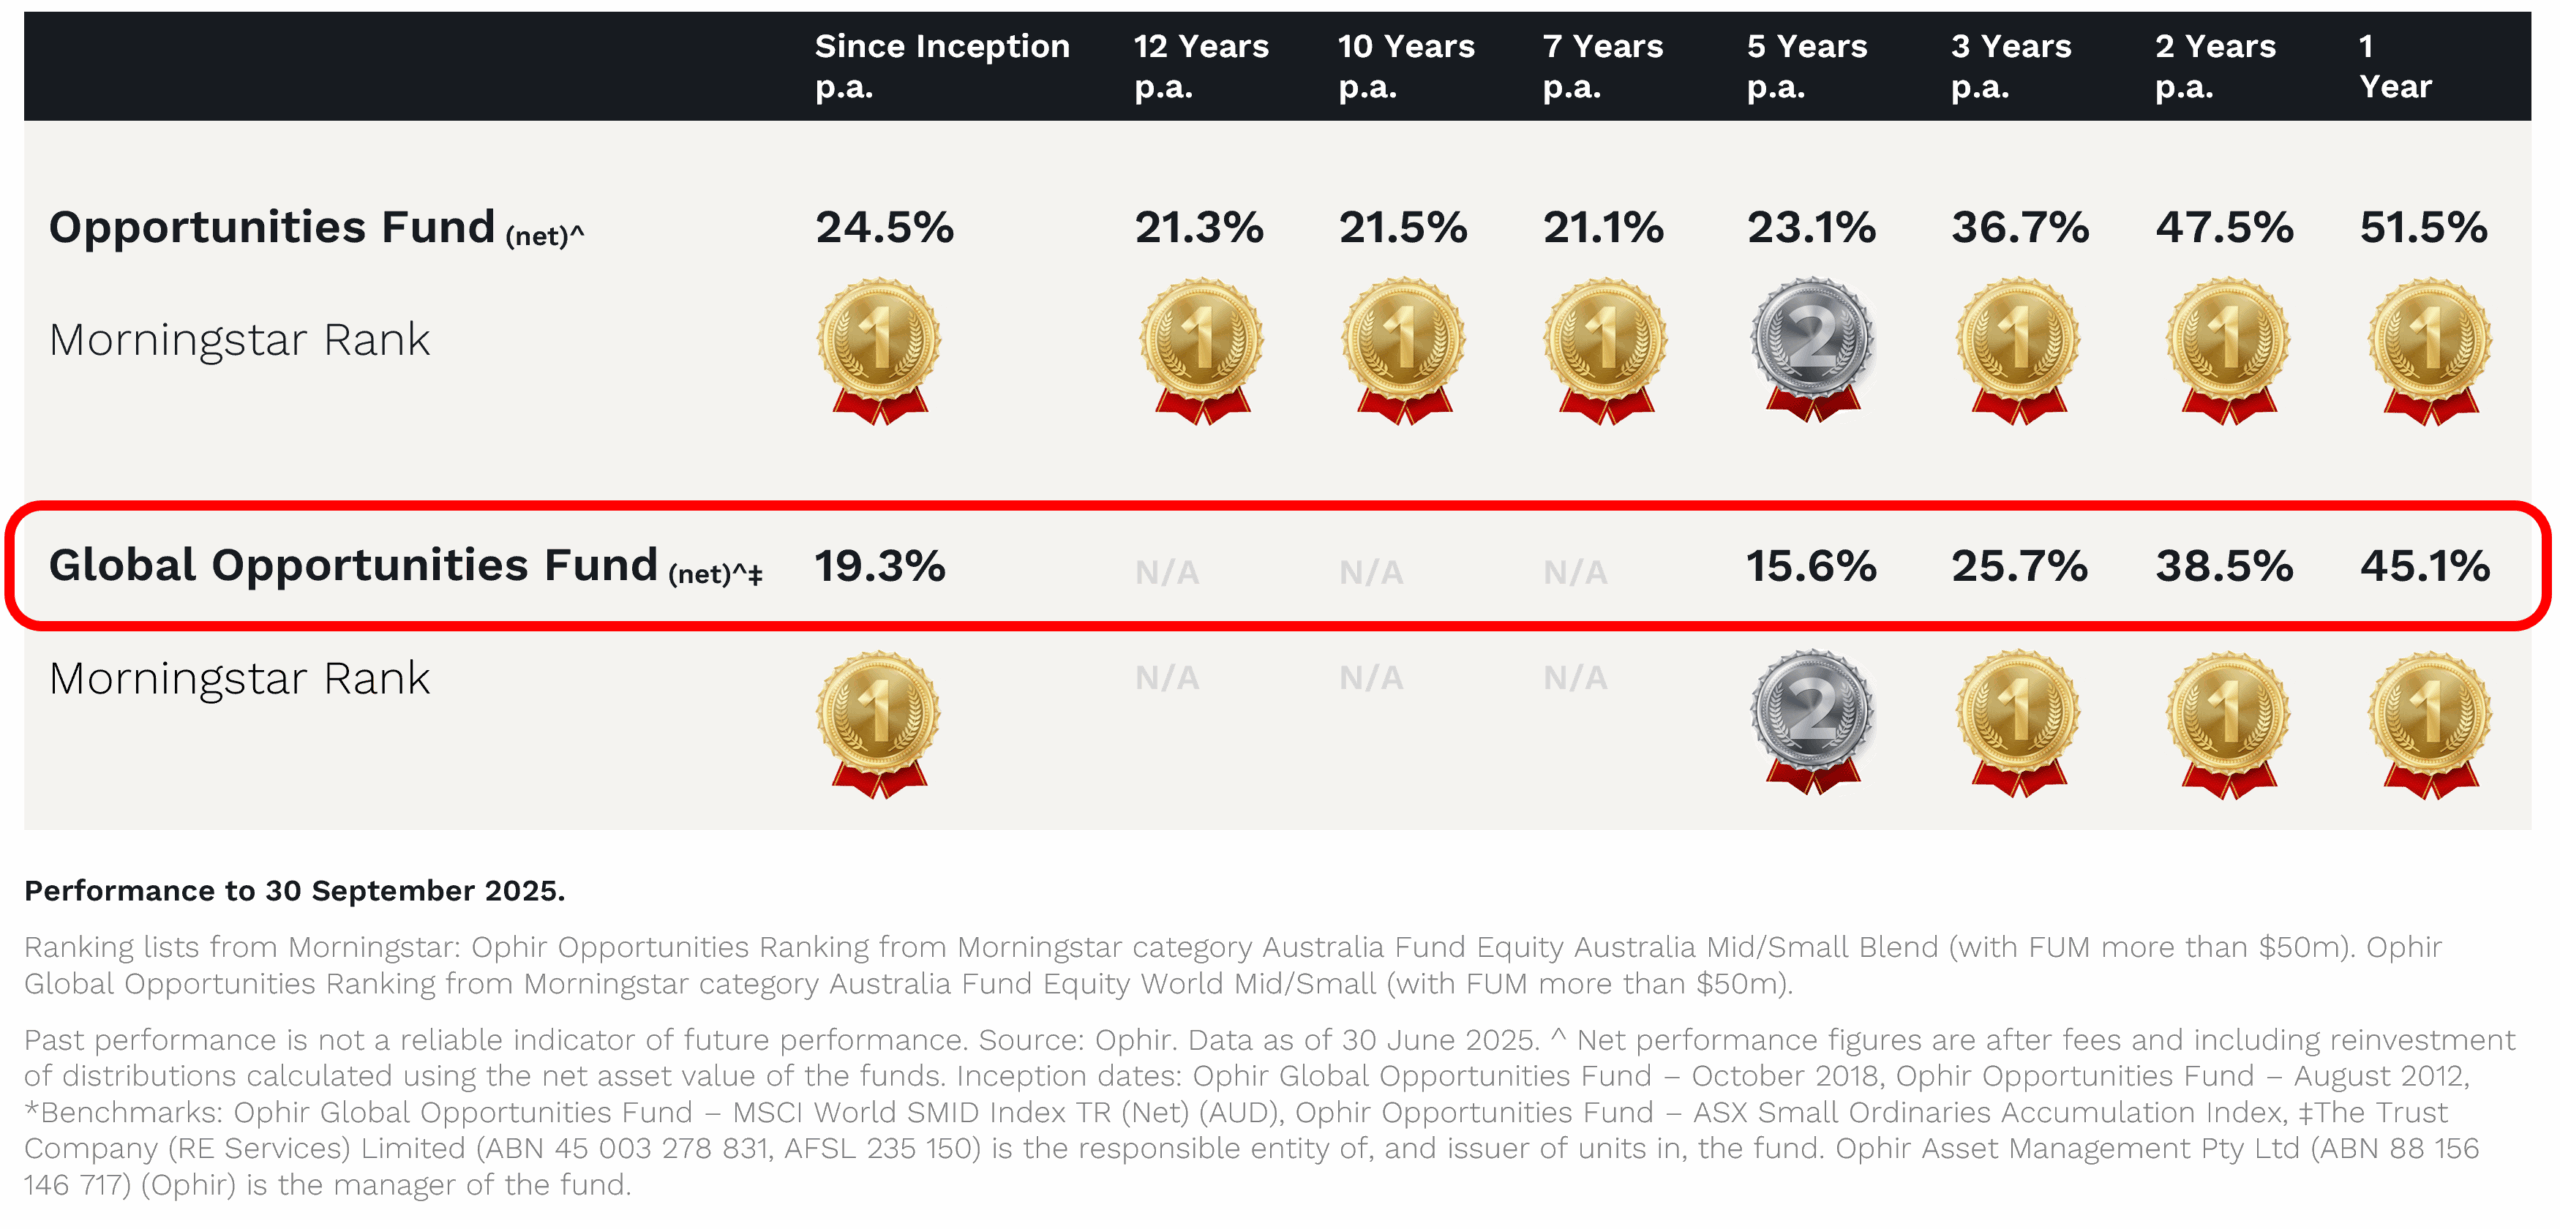
  1. The Ophir Opportunities Fund, our Australian small cap strategy, is the #1 performing Australian small cap fund since inception (1). It returned +51.5% over the last 12 months, and +24.5% p.a. net of fees since 2012, driven by uncovering future market leaders early. A recent example being family safety app, Life360. We backed it early, recognising the platform nature of the business, its future global growth prospects and the true value this presented.
  2. In 2018, we applied our investment process beyond Australia and launched the Ophir Global Opportunities Fund, targeting under-researched small and mid-cap companies across developed international markets. It is now the #1 performing global small cap fund available to Australian investors since inception (1), delivering +45.1% over the past year and +19.3% p.a. net of fees since 2018.

Importantly, the Global Opportunities Fund has recently reopened to new investors, and, like all Ophir strategies, is capacity constrained to protect long-term performance.

This presents an opportunity for those looking to gain exposure to global small caps through a proven manager.

While the two Funds invest across different geographies, they share the same DNA – and it shows.

The Global Opportunities Fund’s peer group rankings closely mirror the trajectory of its longer running Australian sibling, with both strategies delivering consistent top-ranked performance.

Performance & Rankings

Invest with Ophir: Invest

Join our Newsletter: Subscribe


Small Caps Are the Cheapest in a Generation

Today, U.S. small caps continue to trade at their steepest discount to large caps in 25 years.

So what does that mean for investors?

With further rate cuts on the horizon and the very real possibility of a “soft-landing”, the current valuation gap between large caps and small caps provides the backdrop for a period of sustained small cap outperformance.

Many small companies, overlooked during the large-cap rally, may now be poised to lead again. So maybe it’s time to think small… because bigger isn’t always better.

Invest with Ophir: Invest

Join our Newsletter: Subscribe


(1) Morningstar Peer Group Rankings Data as of 30 September 2025.

Prepared by Ophir Asset Management Pty Ltd ABN 88 156 146 717 AFSL 420082. Issued by The Trust Company (RE Services) Limited ABN 45 003 278 831 AFSL 235150 as Responsible Entity for the Ophir Global Opportunities Fund.

The information in this article is general in nature and has been prepared without taking into account your objectives, financial situation or needs. Before making any investment decision, you should consider the relevant Product Disclosure Statement (PDS) and Target Market Determination (TMD) available at www.ophiram.com, and consult a licensed financial adviser.

Past performance is not a reliable indicator of future performance. Investment returns are not guaranteed, and the value of an investment may rise or fall.

© Ophir Asset Management Pty Ltd, 2025. All rights reserved.


Previous

10 Oct, 2025 Stock in Focus - Red Violet (NASDAQ: RDVT)

Next

13 Nov, 2025 Stock in Focus - Exosens (EXENS: FP)
10 Oct, 2025

Stock in Focus - Red Violet (NASDAQ: RDVT)

Stock in Focus • 4 mins read

Back to Insights Back to Insights

PDF

Roses are Red, Violets are… Also Red

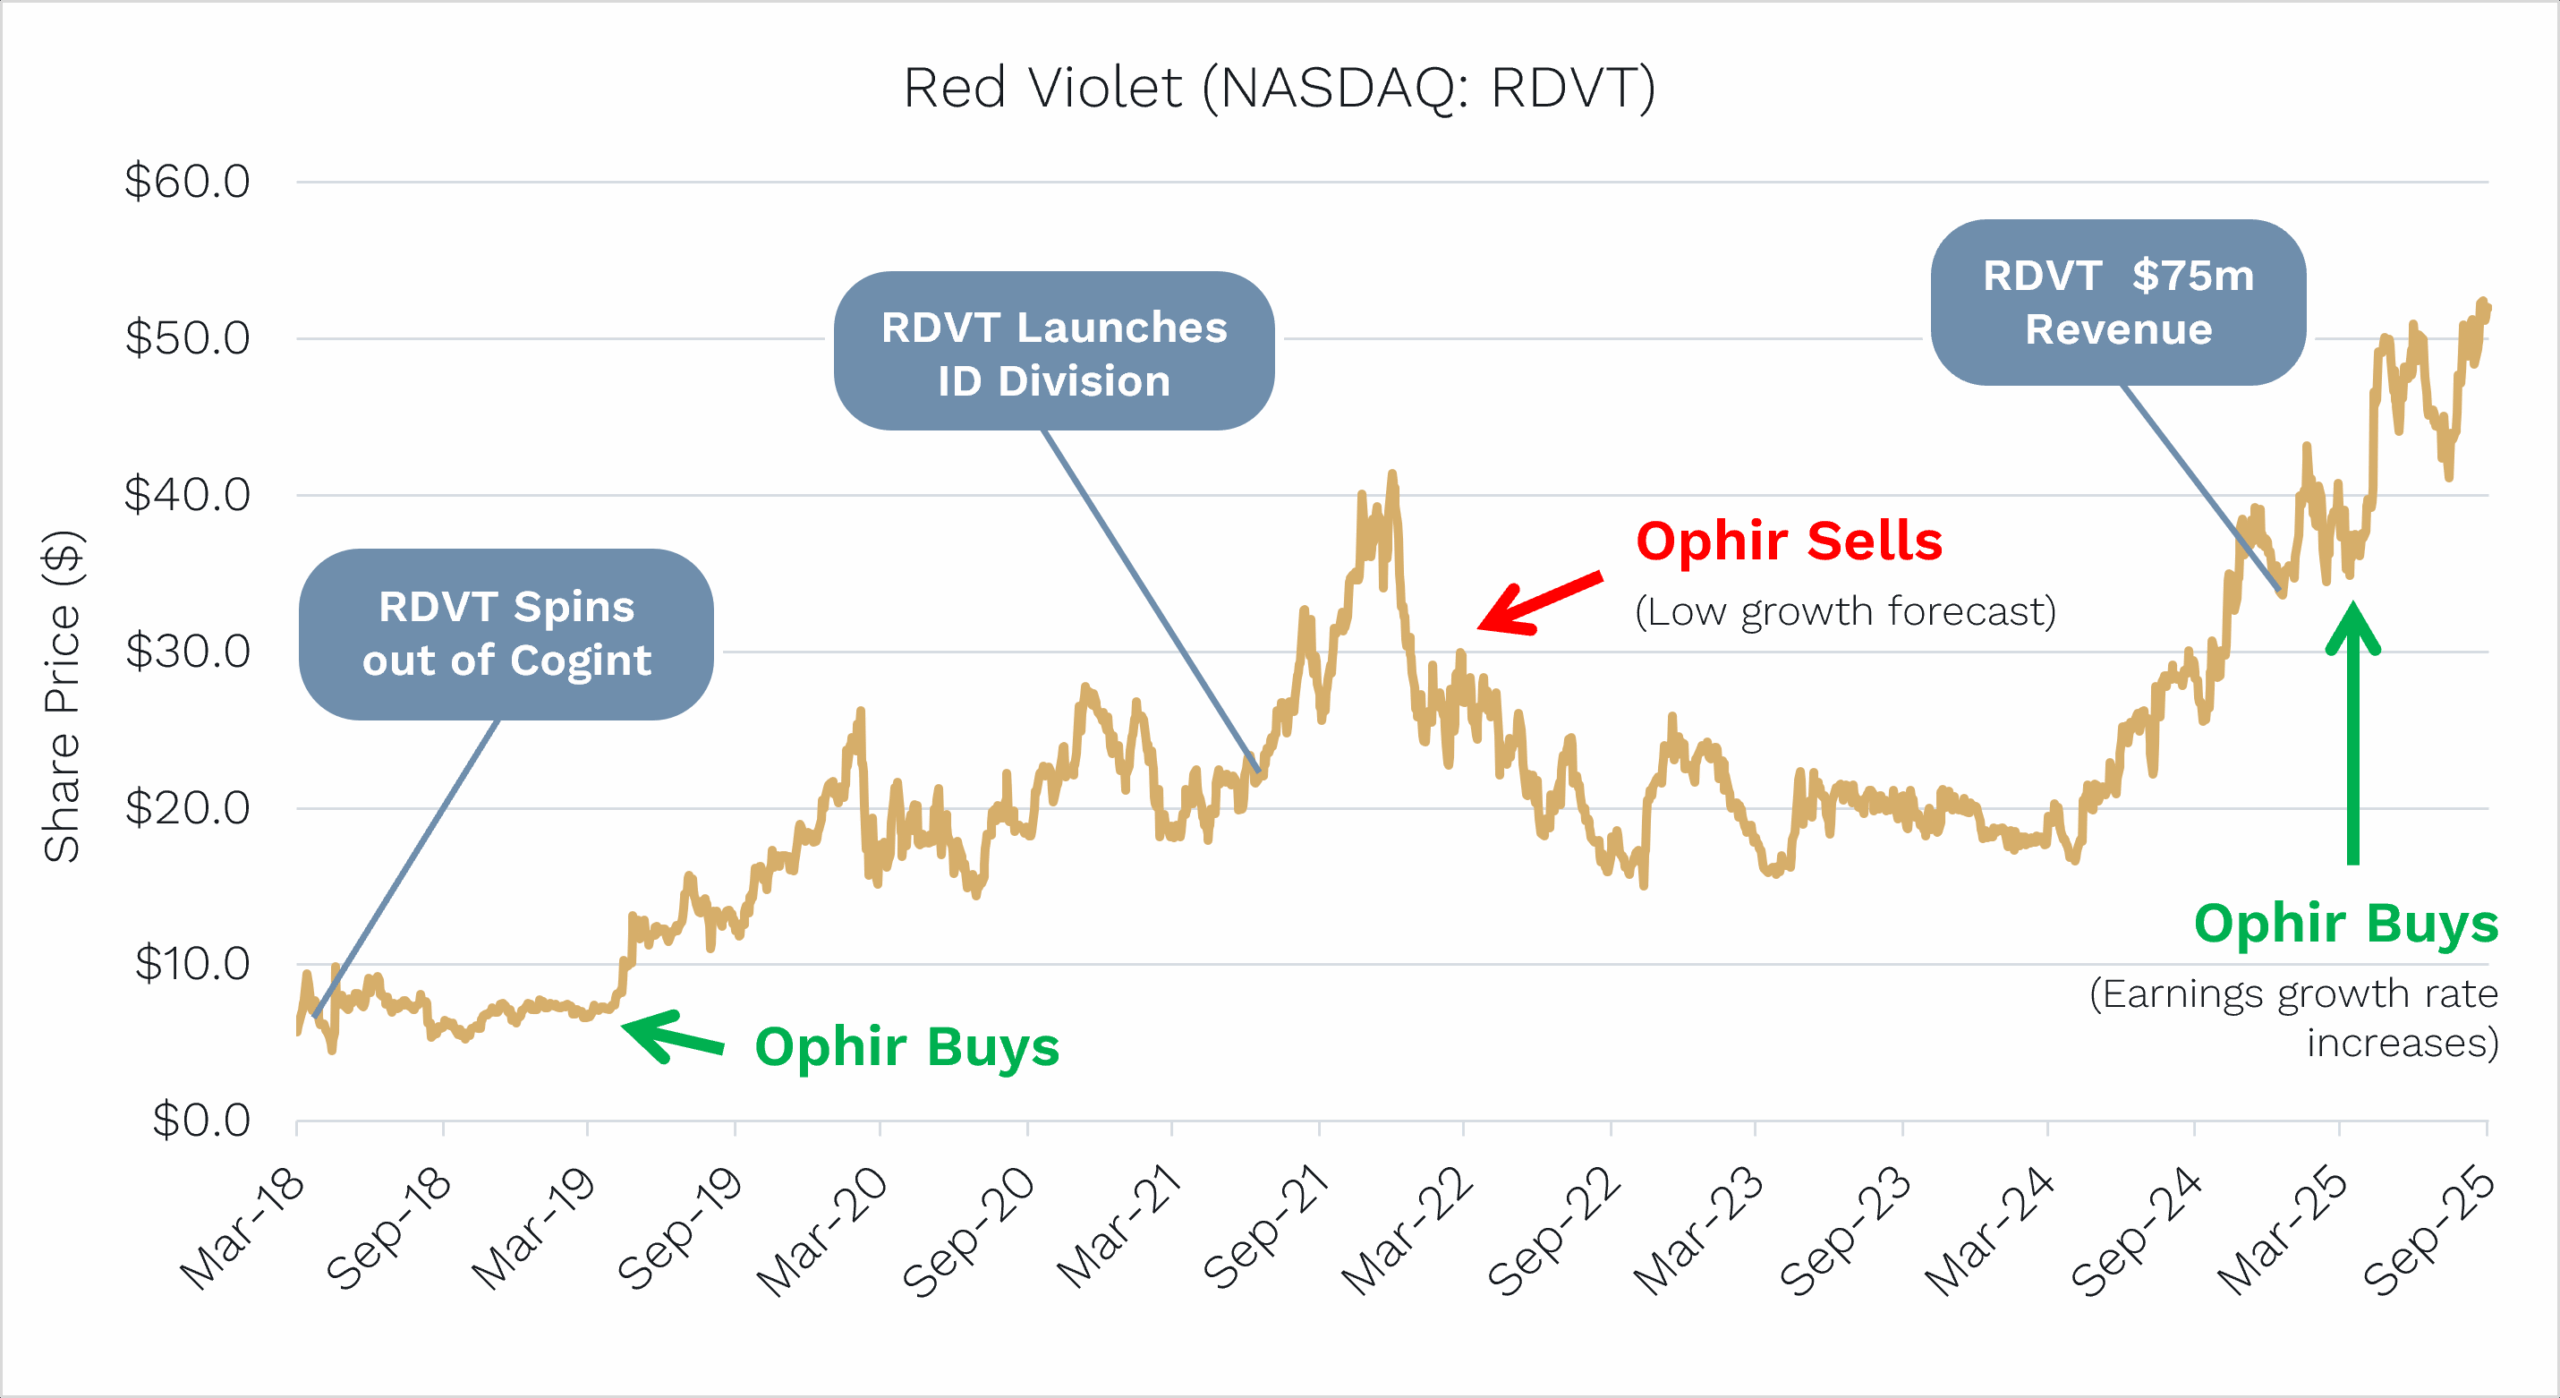
At Ophir, we leave no stone unturned. During our extensive travel and company visitation programs, we hate leaving any meeting slot unfilled. And that’s exactly what led us to Red Violet all the way back in 2018.

While on a fact-finding mission to Florida to see larger listed and core portfolio companies, this obscure, $100m data analytics company accepted our meeting request.

Within a year, after a full deep dive into the industry, we made our first investment and reinvested in the company earlier this year as we gained confidence growth rates could reaccelerate to above 20%.

Source: Ophir, Bloomberg. Data as of 30 September 2025.

Red Violet is a leading provider of identity verification and fraud prevention analytics. It applies proprietary models to massive, multi-source datasets to help clients across financial services, insurance, real estate, legal, and government uncover who they’re really dealing with in real time, with high accuracy.

Its cloud-native, multi-tenant architecture enables clients to integrate easily, ingest data quickly, and access deep insights across use cases such as:

  • Fraud prevention and detection (e.g. digital payments, e-commerce)
  • Regulatory compliance (e.g. KYC/AML for banks)
  • Risk scoring and mitigation (e.g. insurance underwriting, claims history)
  • Public records and background checks (e.g. for real estate, legal, and law enforcement)


Data Done Differently

Red Violet is one of only a handful of U.S.-listed, micro-cap (<$1bn market cap) Software & IT Services companies with positive net income and a 3‑year revenue CAGR above 10%.

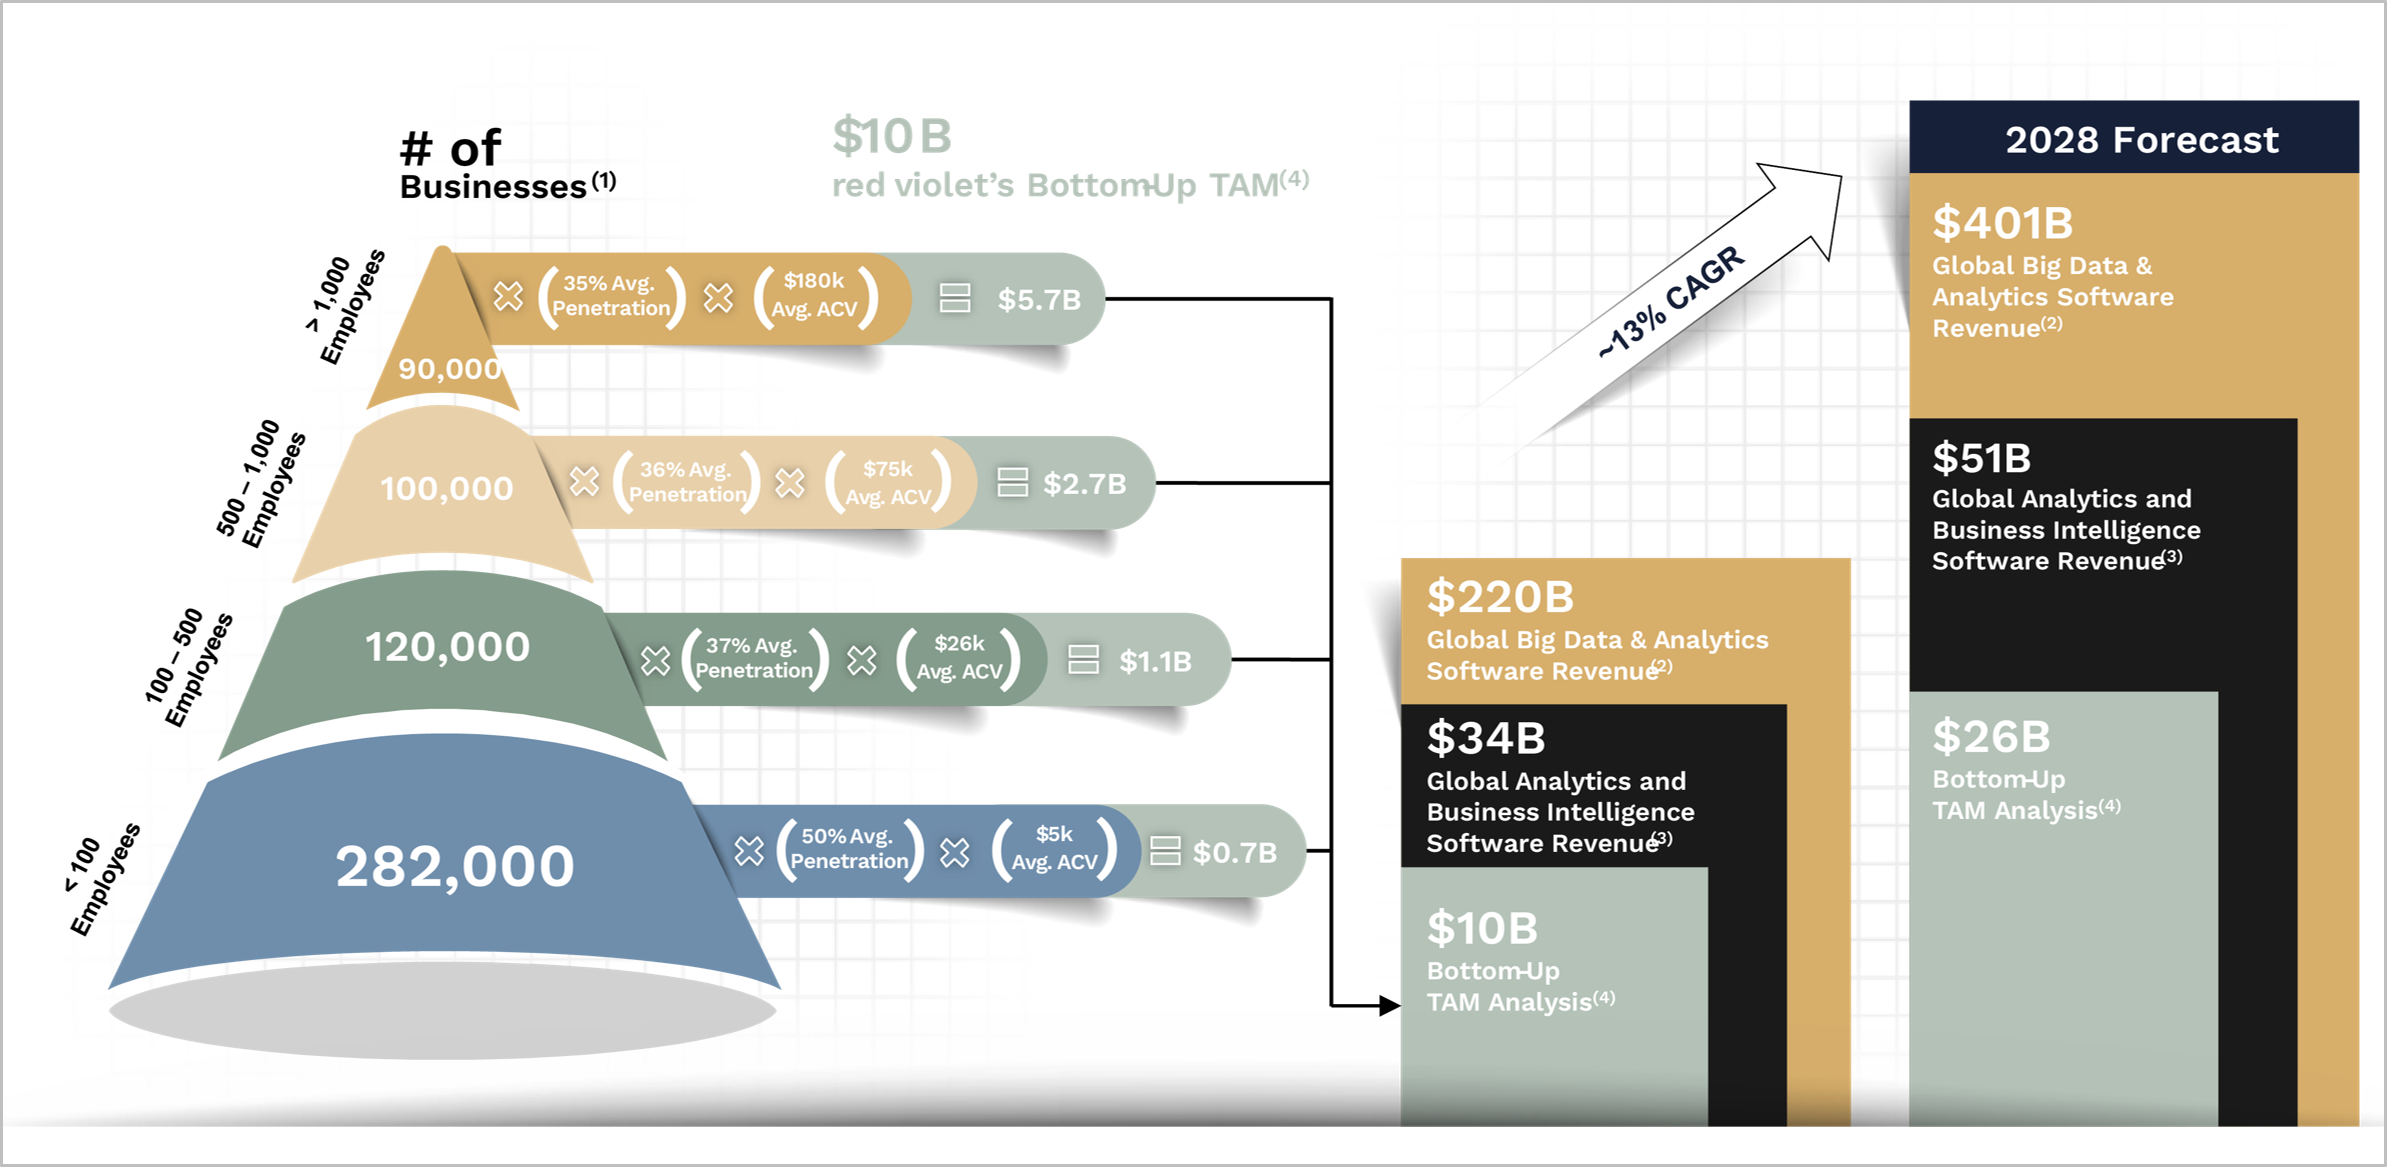
With a Total Addressable Market exceeding $10bn globally, and current market penetration below 1%, we believe Red Violet is in the early stages of a multi-year growth story.

Source: Red Violet Company Presentation – August 2025. Ophir.

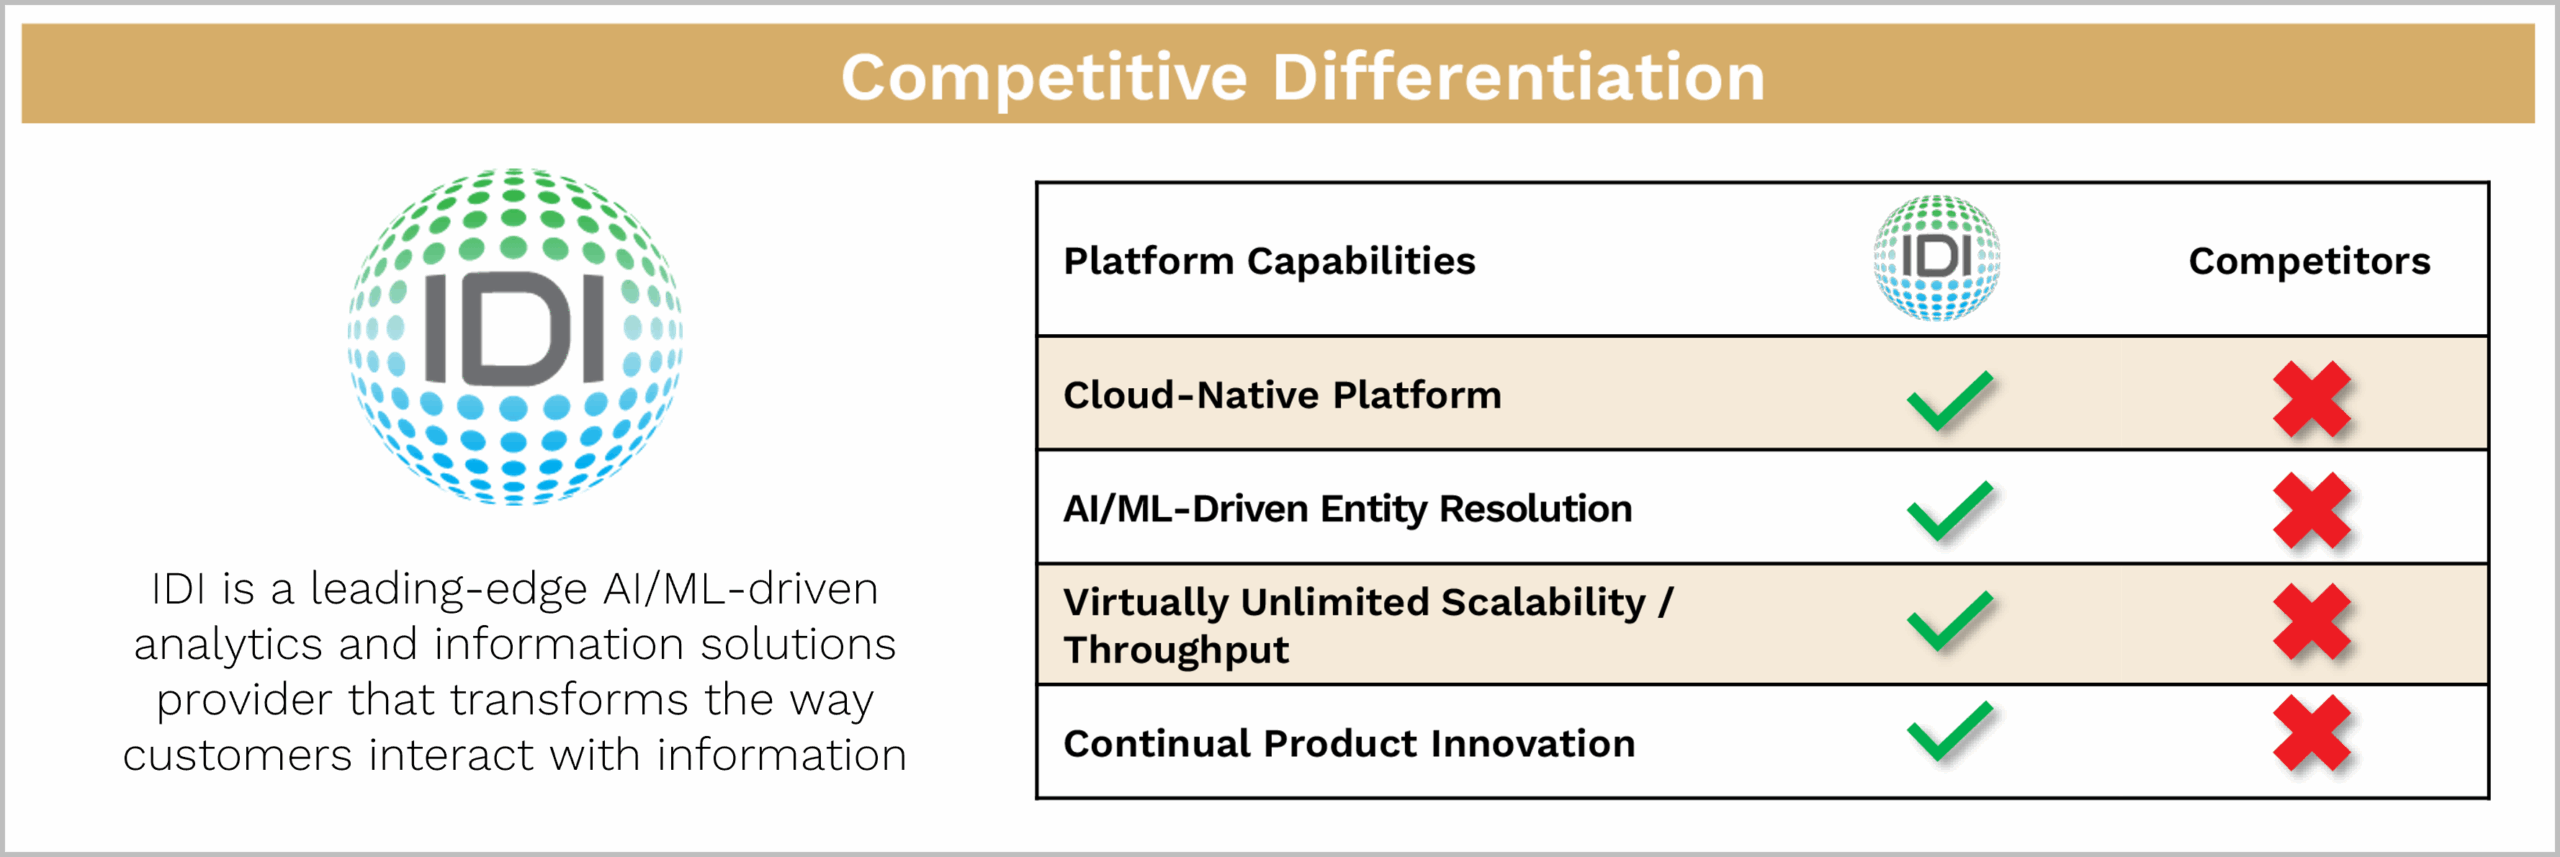
Legacy incumbents such as Equifax, Experian, LexisNexis and TransUnion dominate the traditional credit bureau model, but Red Violet is capitalising on key advantages to gain share.

Red Violet’s proprietary data platform, IDI, was built by the same tech team behind LexisNexis and TransUnion’s platforms. This is effectively their third and most refined iteration, incorporating everything that worked well in prior versions and improving on what didn’t. With the lead developer now retired, it’s likely to remain their final iteration, giving Red Violet a uniquely battle-tested and future-proof platform.

Source: Red Violet Company Presentation – August 2025. Ophir.


Red Violet’s architecture allows for:

  • Faster ingestion and integration of new datasets
  • More accurate and dynamic modelling
  • Customisation across customer-specific verticals

Their technological edge, paired with strong customer validation, is allowing Red Violet to take share from legacy players.

  • Revenue is growing at more than +20–25% annually
  • It has 95%+ incremental gross margins, enabling significant operating leverage
  • Long-term EBITDA margins could exceed 60%, with EBITDA compounding at 30%+
  • Red Violet trades on a high-teens multiple of EBITDA, but we see the potential for rerating given its growth, margin profile, and balance sheet strength

Source: Red Violet Company Presentation – August 2025. Ophir.

Interesting Use Cases

Red Violet’s platform is used in ways that go far beyond traditional identity checks:

  • Banks stop fraud in real time on new account openings
  • Retailers flag “multi-drop” transactions to prevent high-value fraud
  • Insurance firms detect repeat claim filers or link disparate records
  • Real estate firms uncover bankruptcies or aliases during screening
  • Law enforcement uses the platform for investigations

This diversity of applications shows how embedded the platform is becoming — and how non-cyclical much of its revenue base really is.


Building Our Edge

We’ve been tracking Red Violet for over seven years. Since our initial meeting in 2018, we’ve:

  • Met with all major competitors, including the big credit bureaus
  • Held calls with dozens of customers across financial services, insurance, real estate, and government
  • Validated the long runway of growth through first-hand feedback on performance, accuracy, and pricing

This early access and sustained diligence has helped us build a high-conviction position before the market caught on.


Best Is Yet to Come

The stock has been a strong performer since our entry, but we think the best is yet to come:

  • Revenue was up 25% in 2024, hitting $75m
  • The business is profitable, with no debt and $36m in cash
  • With continued share gains and vertical expansion, we expect years of compounding ahead
  • And if margins continue to expand, we see 30–40% total shareholder return (TSR) potential annually for 3–4 years
  • With limited analyst coverage it remains a relative unknown today, but as growth continues it will attract more attention

In a world where high-growth, high-margin companies often trade at 30–40x EBITDA, Red Violet’s current high-teens valuation offers meaningful upside from multiple expansion alone.

With its clean balance sheet, niche leadership, and embedded optionality, we see Red Violet as one of the most compelling compounders in small-cap tech today.


Previous

10 Oct, 2025 Letter to Investors - September 2025

Next

17 Oct, 2025 It's time to start thinking small.
10 Oct, 2025

Letter to Investors - September 2025

Letter to Investors • 11 mins read

Back to Insights Back to Insights

PDF

In this special edition of the Letter to Investors, we’re celebrating birthdays for our Ophir Global Funds by:

  • Showcasing their very good one-year returns and pleasing long-term performance records
  • Breaking down the unique factor driving our Global Opportunities Fund’s market-beating performance
  • Highlighting why ‘quality’ matters too, not just ‘quantity’ when assessing a fund’s returns
  • Taking you “inside baseball” on the quality metrics and explaining what they reveal about the Ophir Global Opportunities Fund


Our original Aussie Ophir Opportunities Fund recently celebrated entering its “teenage” years, after hitting its thirteenth anniversary.

But two of our “other children” – the Ophir Global Funds – also had birthdays this month:

  • The Global Opportunities Fund turned 7 years old, delivering a standout +45.1% over the year to 30 September.
  • The Global High Conviction Fund turned 5 years old, with an impressive +37.3% over the same period.

Both results sit well above our long-term target of +15% per annum across all Funds.

Of course, no investor should expect results like +45% or +37% every year, that would be setting yourself up for disappointment.

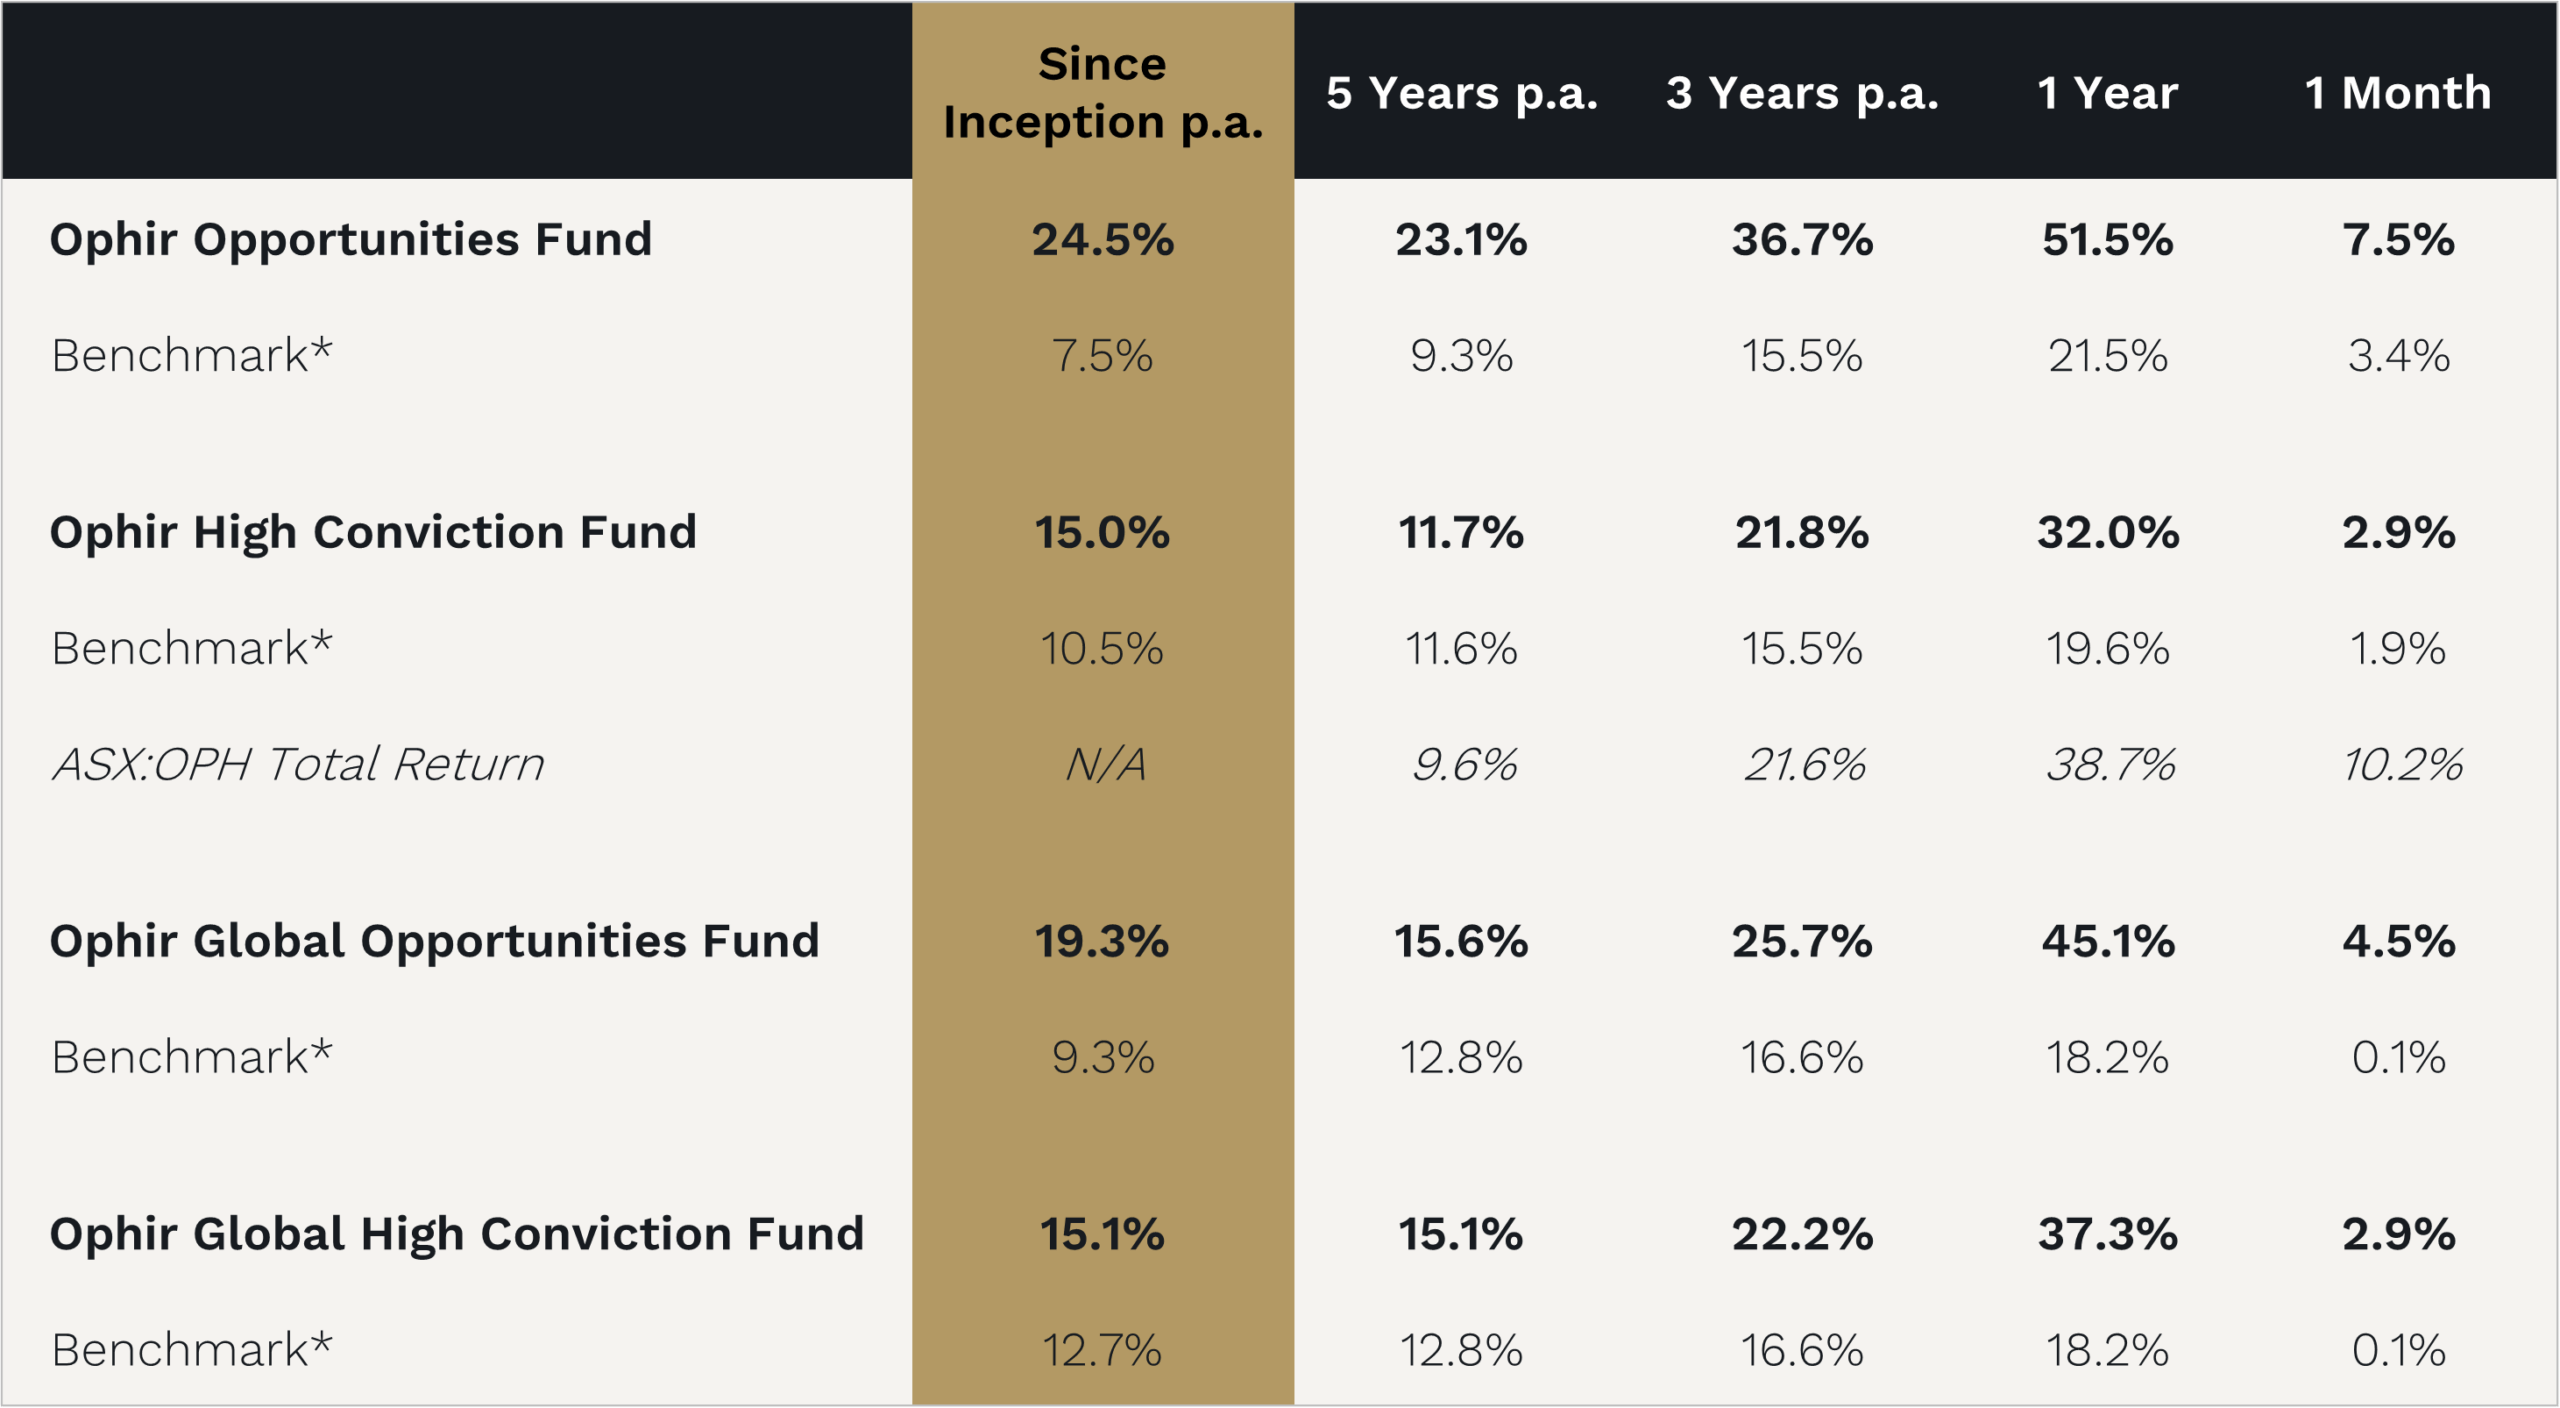
But +15% per annum is what we strive for and we’re proud to have delivered it, not just in our Global Funds but across all four Ophir Funds, over the long-term.

Ophir Fund’s Performance to 30 September 2025:

Source: Ophir, Citi. Benchmarks are: for the Ophir Opportunities Fund – ASX Small Ordinaries Index TR, Ophir High Conviction Fund – 50/50 ASX Small Ordinaries Index/ASX Mid Cap Index TR, Ophir Global Opportunities Fund and Ophir Global High Conviction Fund – MSCI World SMID Cap Index NR (AUD)

However, more pleasing than volatile one-year numbers are the longer-term returns from our Global Funds.

In particular, the older sibling of the two Global Funds, the Ophir Global Opportunities Fund, has now returned +19.3% per annum after fees since its birth seven years ago, beating its benchmark by 10% per annum.

A $100,000 investment in the benchmark would have grown by an additional $86,000, while the same investment in the Global Opportunities Fund has grown by $245,000 – nearly three times as much.

That’s the power of compounding at higher returns.


What’s Driving the Performance?

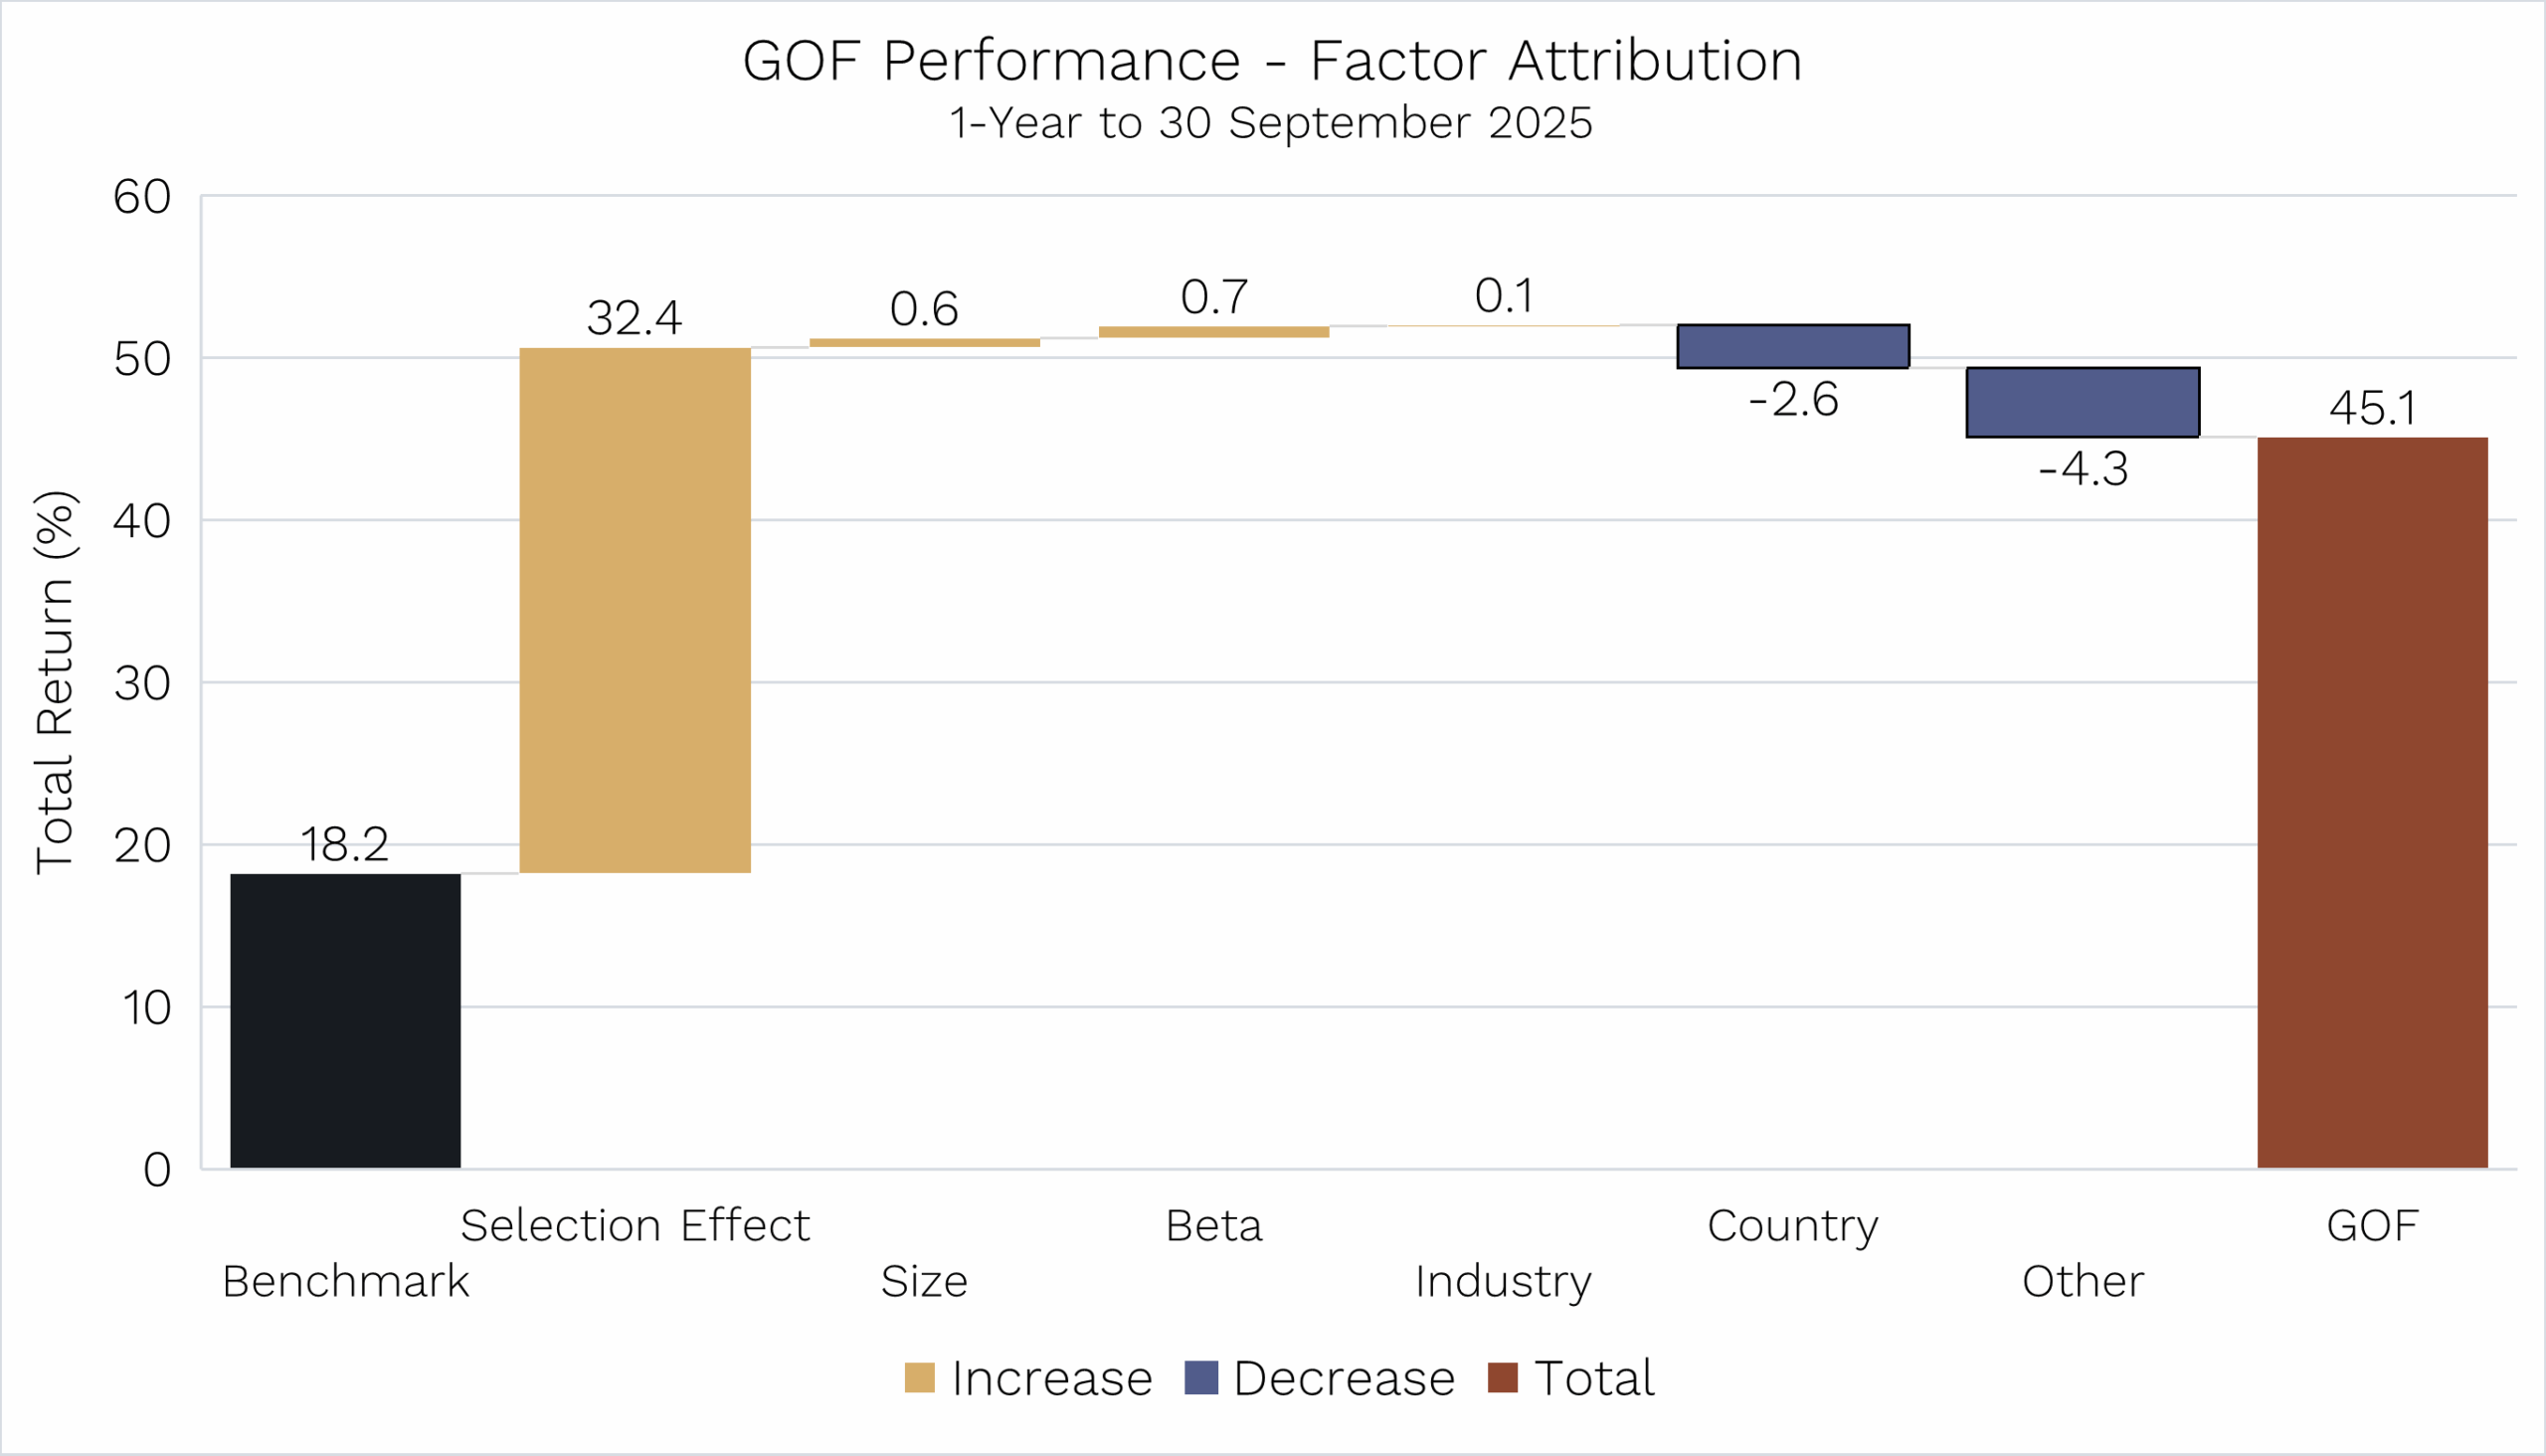
Below we share an updated version of the chart first introduced in our June Letter to Investors.

It highlights the factors behind the Global Opportunities Fund’s outperformance or underperformance compared with its benchmark.

Global Opportunities Fund – multi-factor performance attribution

Source: Bloomberg. Data as of 30 September 2025. Benchmark MSCI World SMID Index NR (AUD).

As in our June Letter, the chart shows that for the Fund’s performance in the year to 30 September, +32.4% of the +26.9% outperformance (45.1% minus 18.2%), in other words more than 100% of it, was driven by Selection Effect.

Put simply, our outperformance didn’t come from factors like company size, market sensitivity (‘beta’), or industry and country allocation.

It came from stock picking.

That’s important, because it means our results aren’t just the by-product of tilting the portfolio toward common traits that anyone with a Bloomberg terminal could replicate.

Sure, it isn’t hard to assemble a 40-stock portfolio of U.S. small-cap consumer discretionary companies with certain characteristics and hope for the best. But history shows there’s little evidence that any one factor consistently outperforms over time. And when it does, market prices adjust quickly, wiping away the edge.

Instead, our outperformance comes from the long hours spent on the road, away from our families, meeting companies and digging into their ecosystems – competitors, customers, suppliers, even ex-employees.

This work helps us understand each company’s unique drivers and whether they’re likely to deliver results better than consensus expects.

We believe this, at least in part, is where our enduring edge over the market is.

Quality, Quality, Quality

When it comes to investment returns, quantity is what most people look at first. How much did you generate? Did you outperform or underperform? After all, you can only spend the returns you make.

But quality matters too.

Why? Because quality determines whether a manager’s returns are repeatable (or just luck) and how reliably they are delivered.

Some managers shine only in certain environments and struggle in others. That’s not the kind of consistency most investors want.

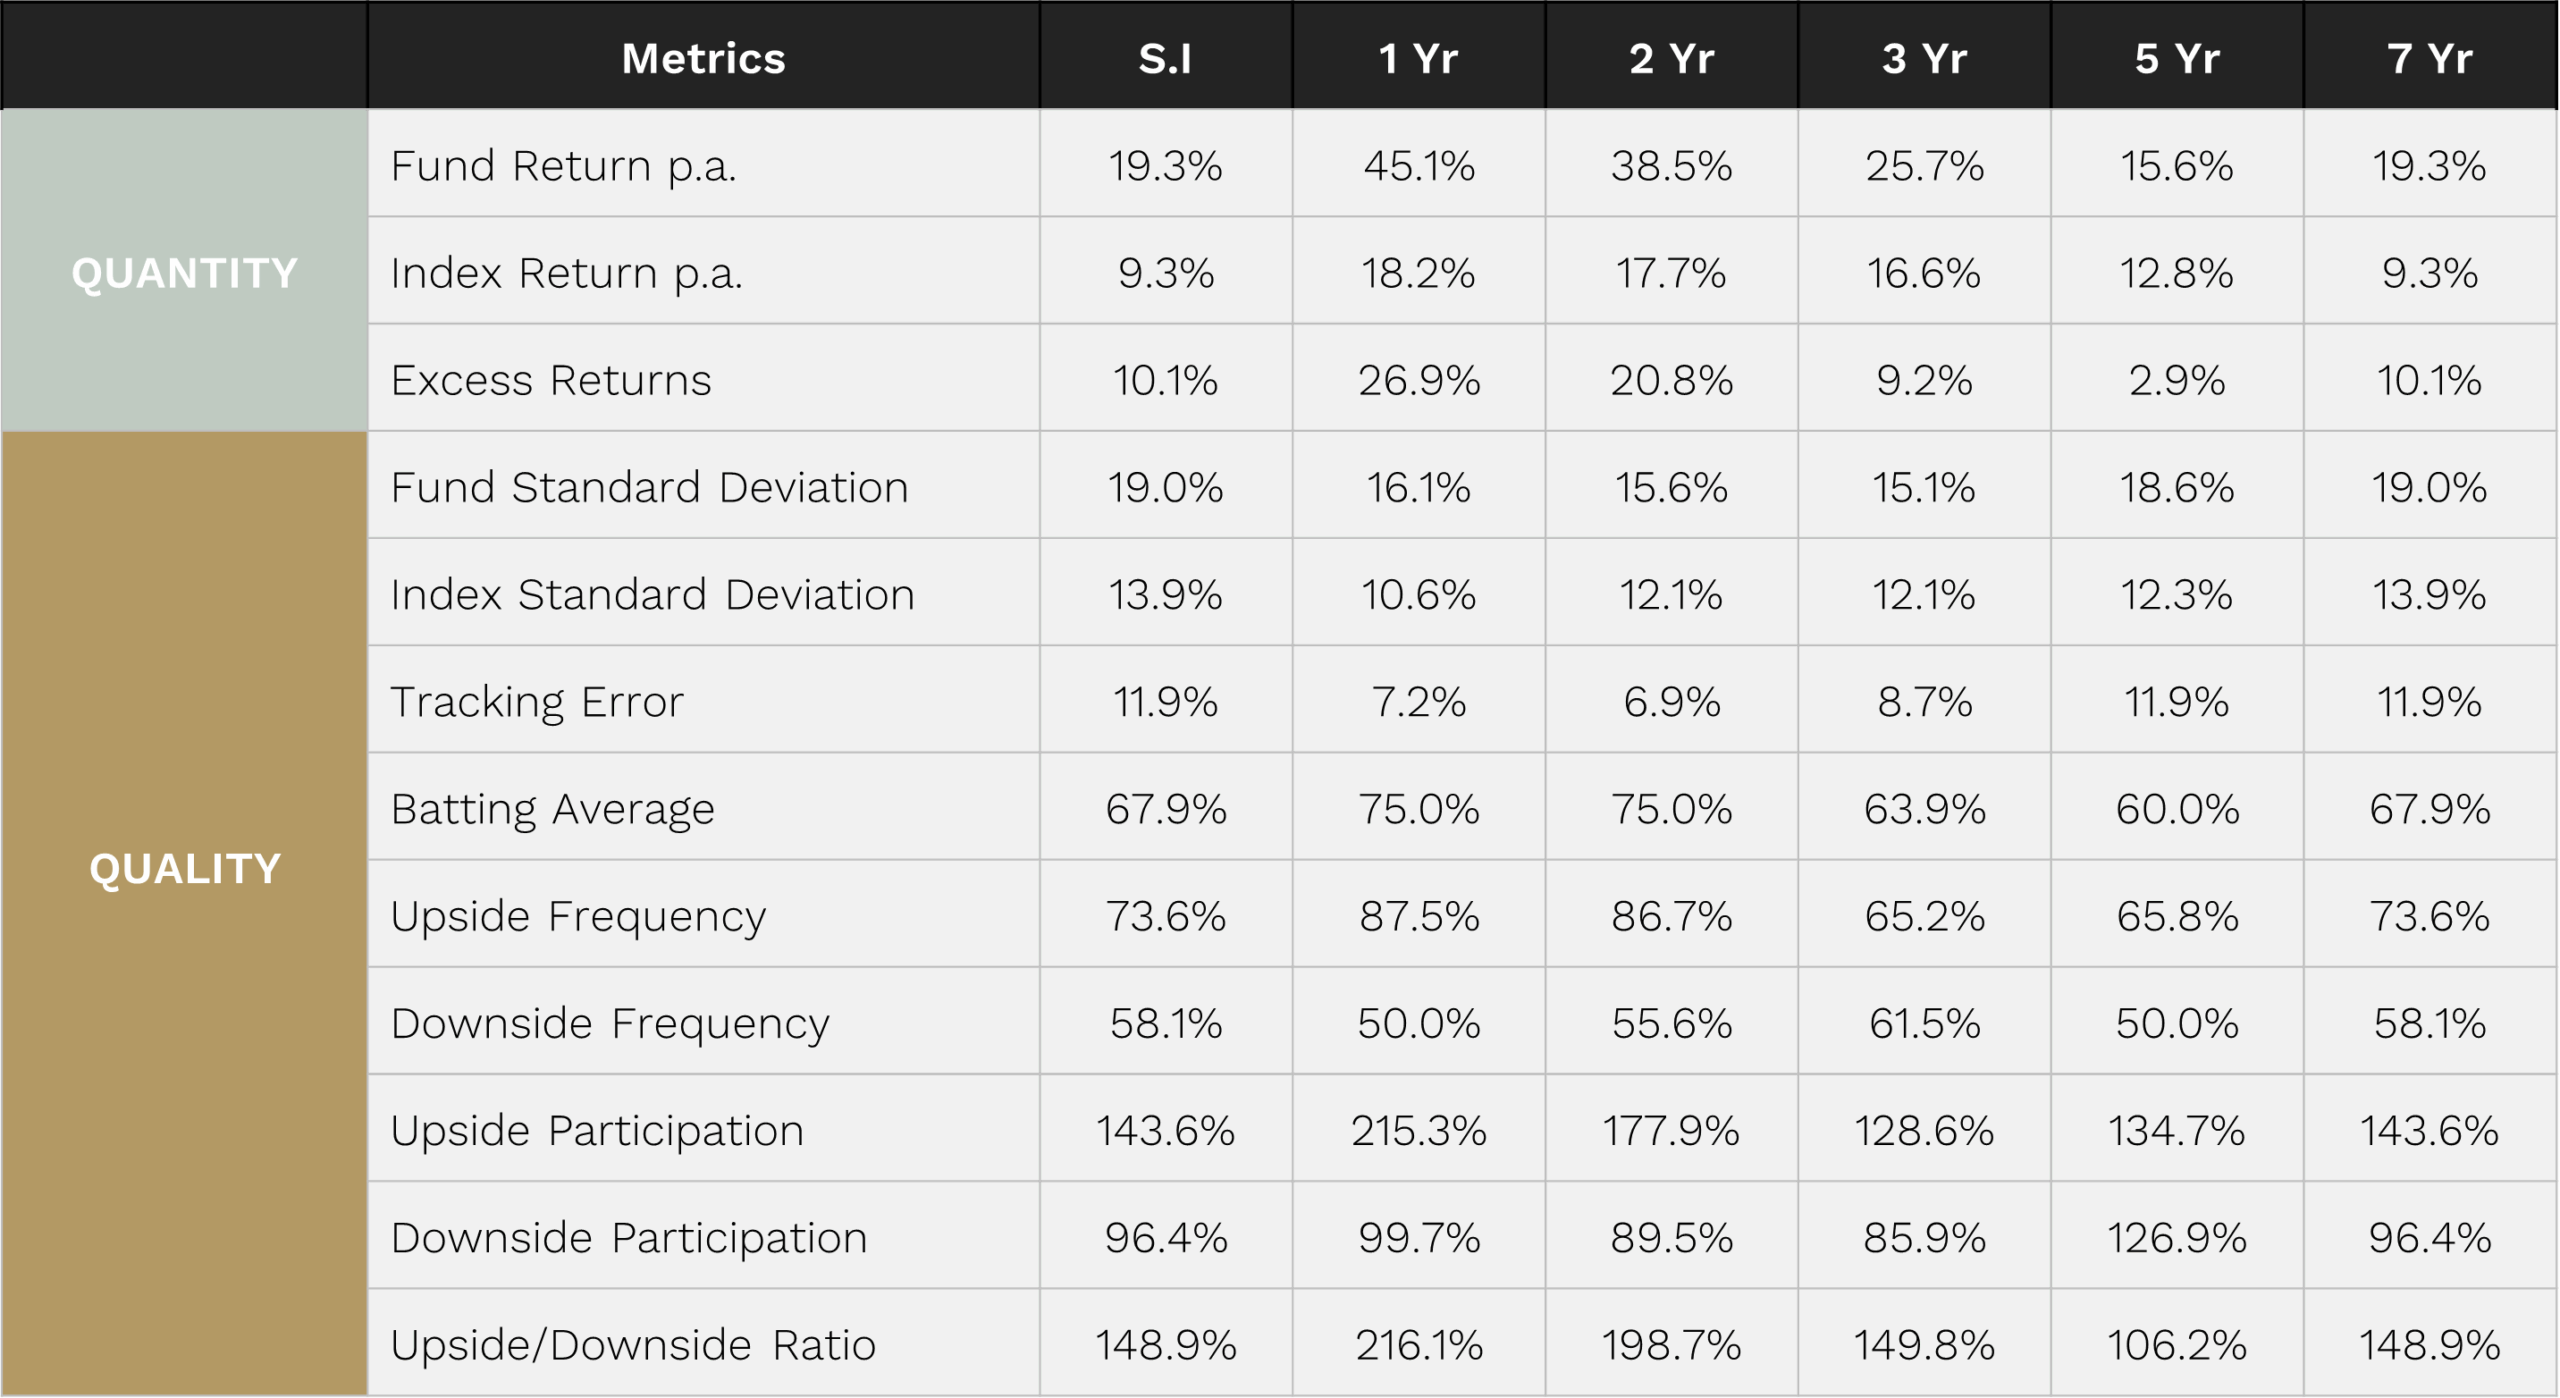
To measure quality in our Funds — here using the Global Opportunities Fund as the example — we track a range of key statistics.

The first three rows of the table below cover quantity: Fund returns, benchmark returns, and the difference between them (excess returns).

Then we move on to the quality measures, which reveal how consistent and sustainable those results really are.

Ophir Global Opportunities Fund Key Metrics:

Benchmark: MSCI World SMID Cap Index NR (AUD). Inception October 2018. “S.I.” stands for Since Inception.


But those measuring quality include:

  1. Standard Deviation

This measures volatility, that math term you might remember from high school, and shows how bumpy the return journey has been for the Global Opportunities Fund compared with its benchmark.

The higher the standard deviation, the bumpier the ride. And with a concentrated portfolio, that’s to be expected. Our benchmark covers nearly 5,000 small and mid-cap stocks globally, while the Global Opportunities Fund holds only 40–50.

That extra volatility is essentially the price of admission for trying to outperform such a broad universe of stocks.

  1. Tracking Error

Now this might sound like a wonky finance term, but it’s simple: instead of measuring the volatility of the Fund’s returns, it measures the volatility of its outperformance or underperformance each month.

Everyone would love a nice, smooth outperformance ride every month. Bernie Madoff was one of the few people to produce that, and he went to jail! (because in reality his numbers were made up).

In reality, if two funds deliver the same headline performance, most investors would prefer the one that spreads it steadily across months, rather than giving it all in a single burst with flat or negative months elsewhere.

That’s what tracking error reveals: how smooth (or wild) the outperformance ride has been. And unless you’re a thrill junkie, the lower the better.

  1. Batting Average

No, Aussie cricket fans, this one didn’t come from us. It’s borrowed from the Americans and their love of baseball.

Batting average measures the percentage of months the Fund has outperformed its benchmark. For example, a 75% batting average means outperformance in nine of twelve months.

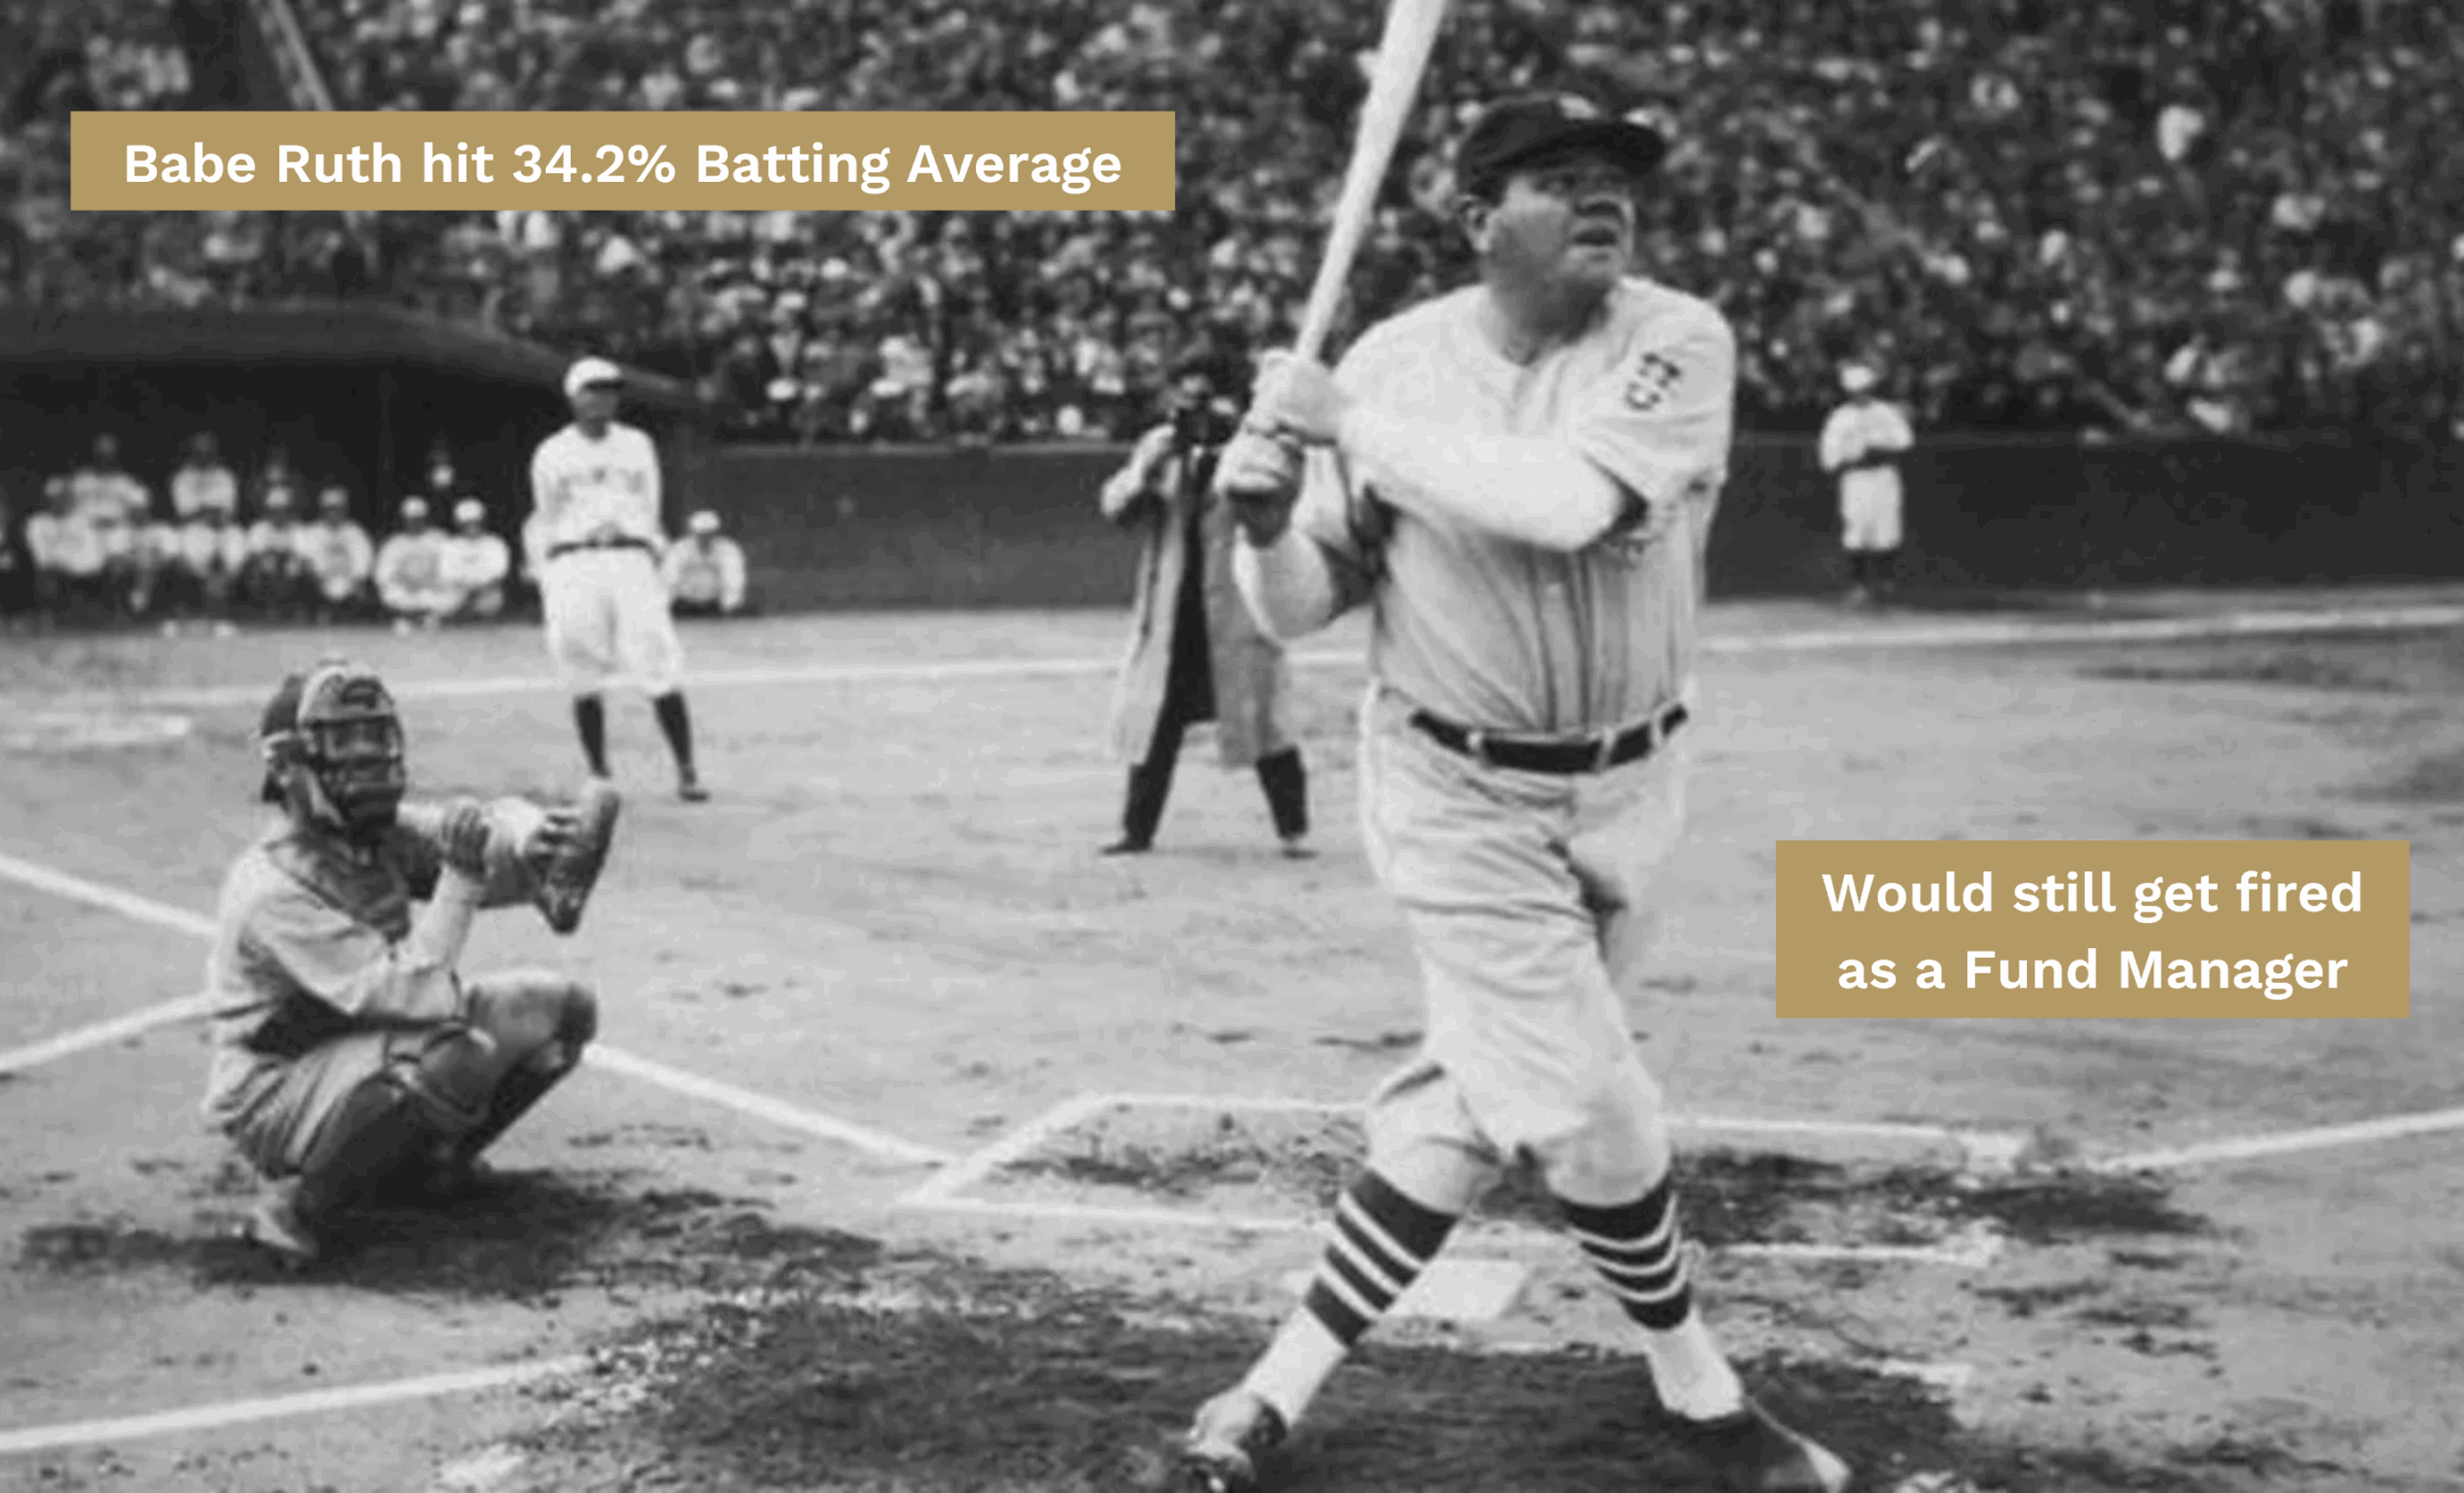
Like tracking error, it’s a measure of consistency. In baseball, a .300 average (30% hits vs at-bats) is considered excellent.

In funds management, the benchmark is higher: a manager typically needs at least a 50% batting average to outperform over time.

Higher is better, and at above 60%, our Global Opportunities Fund is generally excellent.

  1. Upside/Downside Frequency

This metric takes batting average a step further. It shows how often the Fund outperforms when the market is up (upside frequency) and when the market is down (downside frequency).

Think of it like a baseball player: “Sure, you’ve got a 30% batting average overall. But what’s your average when you’re facing a fastball versus a slow ball?”

Some batters struggle against certain pitches, just as some fund managers struggle to outperform in down markets or during selloffs.

For our Global Opportunities Fund, the Upside Frequency is higher than the Downside Frequency. In other words, we outperform more often in rising markets than falling ones, but still tend to outperform in both environments.

  1. Upside/Downside Participation

This metric goes one step further. Instead of showing how often we outperform in up or down markets, it reveals by how much.

To stick with the baseball analogy: “It’s not just whether you hit the fastball or the slow ball — it’s how many bases you get when you connect.”

Since inception, the Ophir Global Opportunities Fund has shown:

  • When the market rises +1% in a month, the Fund has risen +1.43% on average (143% upside participation).

  • When the market falls –1%, the Fund has fallen only –0.96% on average.

In short: we outperform by more in up-market months than we do in down markets.

And that’s a good thing, because over the long term, markets rise more often than they fall. In fact, 63% of the months for our benchmark have been up since our Global Opportunities Fund started in 2018.

Celebrating a Great Birthday

As unfair as it might feel to put one of your “children” under the microscope on their birthday, we hope this has given you a clearer view of the quality behind the Global Opportunities Fund’s returns.

Since its launch in 2018, the Fund has delivered +19.3% per annum after fees, beating its benchmark by +10.0% per annum. It ranks No.1 in Australia for performance in the Global Small/Mid Cap asset class since inception (Morningstar data).

Yes, the ride has been a little more volatile than the market, but that comes with running a concentrated portfolio. And while we’ve outperformed the market more than half the time on a monthly basis, the real story is that we’ve done so more often and by a greater margin in up-market months than down ones.

And with that, we want to sincerely thank the whole Ophir team for making this a great birthday to celebrate.

There will, no doubt, be tougher birthdays ahead, and we must remember that. As a retired CEO once told us, the times you remember most in your working life are the tough times, and how you came through them together.

2022 was one of those times. And looking back on our 13-year journey, it’s the year we’re most proud of, because we came together, we got better, and we pulled through.

Finally, a heartfelt thank you to you, our investors. Without your support, there would be no birthdays for our Funds.


As always, thank you for entrusting your capital with us.

Kindest regards,

Andrew Mitchell & Steven Ng

Co-Founders & Senior Portfolio Managers

Ophir Asset Management

This document has been prepared by Ophir Asset Management Pty Ltd (ABN 88 156 146 717, AFSL 420082) (“Ophir”) and contains information about one or more managed investment schemes managed by Ophir (the “Funds”) as at the date of this document. The Trust Company (RE Services) Limited ABN 45 003 278 831, the responsible entity of, and issuer of units in, the Ophir High Conviction Fund (ASX: OPH), the Ophir Global Opportunities Fund and the Ophir Global High Conviction Fund. Ophir is the trustee and issuer of the Ophir Opportunities Fund.

This is general information only and is not intended to provide you with financial advice and does not consider your investment objectives, financial situation or particular needs.  You should consider your own investment objectives, financial situation and particular needs before acting upon any information provided and consider seeking advice from a financial advisor if necessary. Before making an investment decision, you should read the relevant Product Disclosure Statement (“PDS”) and Target Market Determination (“TMD”) available at www.ophiram.com or by emailing Ophir at ophir@ophiram.com. The PDS does not constitute a direct or indirect offer of securities in the US to any US person as defined in Regulation S under the Securities Act of 1993 as amended (US Securities Act).

All Ophir Funds are deemed high risk within their respective Target Market Determination documentation.  Ophir does not guarantee the performance of the Funds or return of capital.  An investment may achieve a lower than expected return and investors risk losing some or all of their principal investment.  Past performance is not a reliable indicator of future performance.  Any opinions, forecasts, estimates or projections reflect our judgment at the date of this was prepared, and are subject to change without notice.  Rates of return cannot be guaranteed and any forecasts, estimates or projections as to future returns should not be relied on, as they are based on assumptions which may or may not ultimately be correct.

Actual returns could differ significantly from any forecasts, estimates or projections provided.

The Trust Company (RE Services) Limited is a part of the Perpetual group of companies. No company in the Perpetual Group (Perpetual Limited ABN 86 000 431 827 and its subsidiaries) guarantees the performance of any fund or the return of an investor’s capital.
 

Previous

8 Sep, 2025 U.S. Reporting Season - Winners, Losers & 6 Key Themes

Next

10 Oct, 2025 Stock in Focus - Red Violet (NASDAQ: RDVT)
8 Sep, 2025

U.S. Reporting Season - Winners, Losers & 6 Key Themes

Stock in Focus • 6 mins read

Back to Insights Back to Insights

PDF

Most of the portfolio companies in our global funds reported their Q2 results in late July and early August.

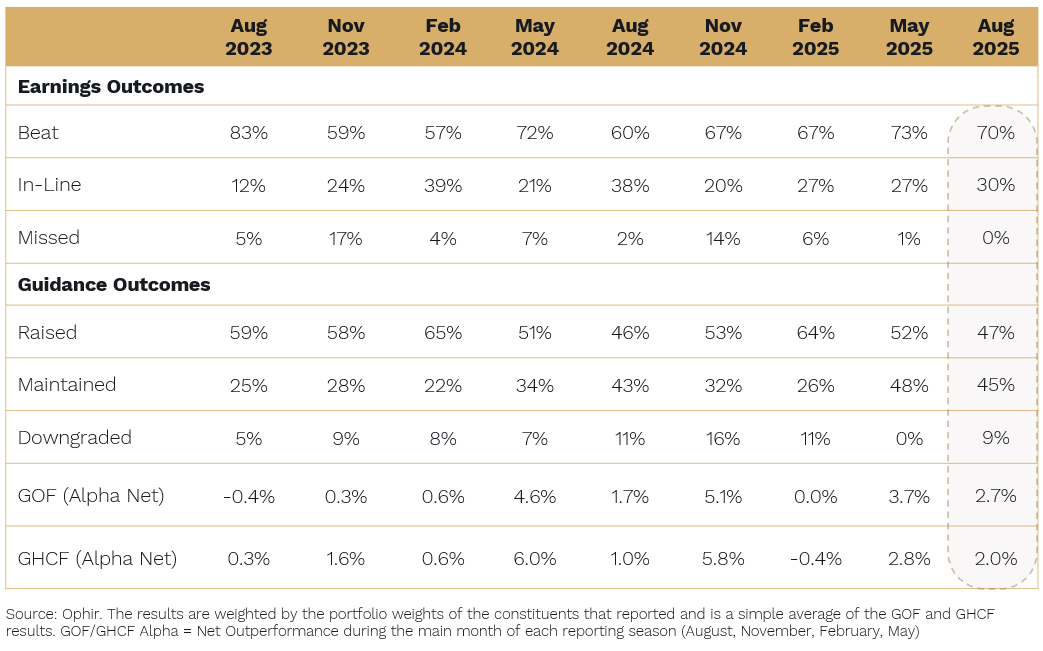
Our performance during this period was solid with both of our global funds up 4-5%, compared with the benchmark return of 2.1%:

  • We maintained our history of owning more ‘beats’ (companies reporting better-than-expected results) than ‘meets’ and ‘misses’;
  • A similar number of our portfolio companies either upgraded or maintained guidance; and
  • Pleasingly, very few of our holdings downgraded guidance.

At Ophir, we are always looking for companies doing better than the market expects because earnings beats typically translate to share price appreciation.

With no clear business cycle, we entered Q2 with a portfolio designed to work in either a strong or weak macro environment.

That positioning certainly helped our performance.

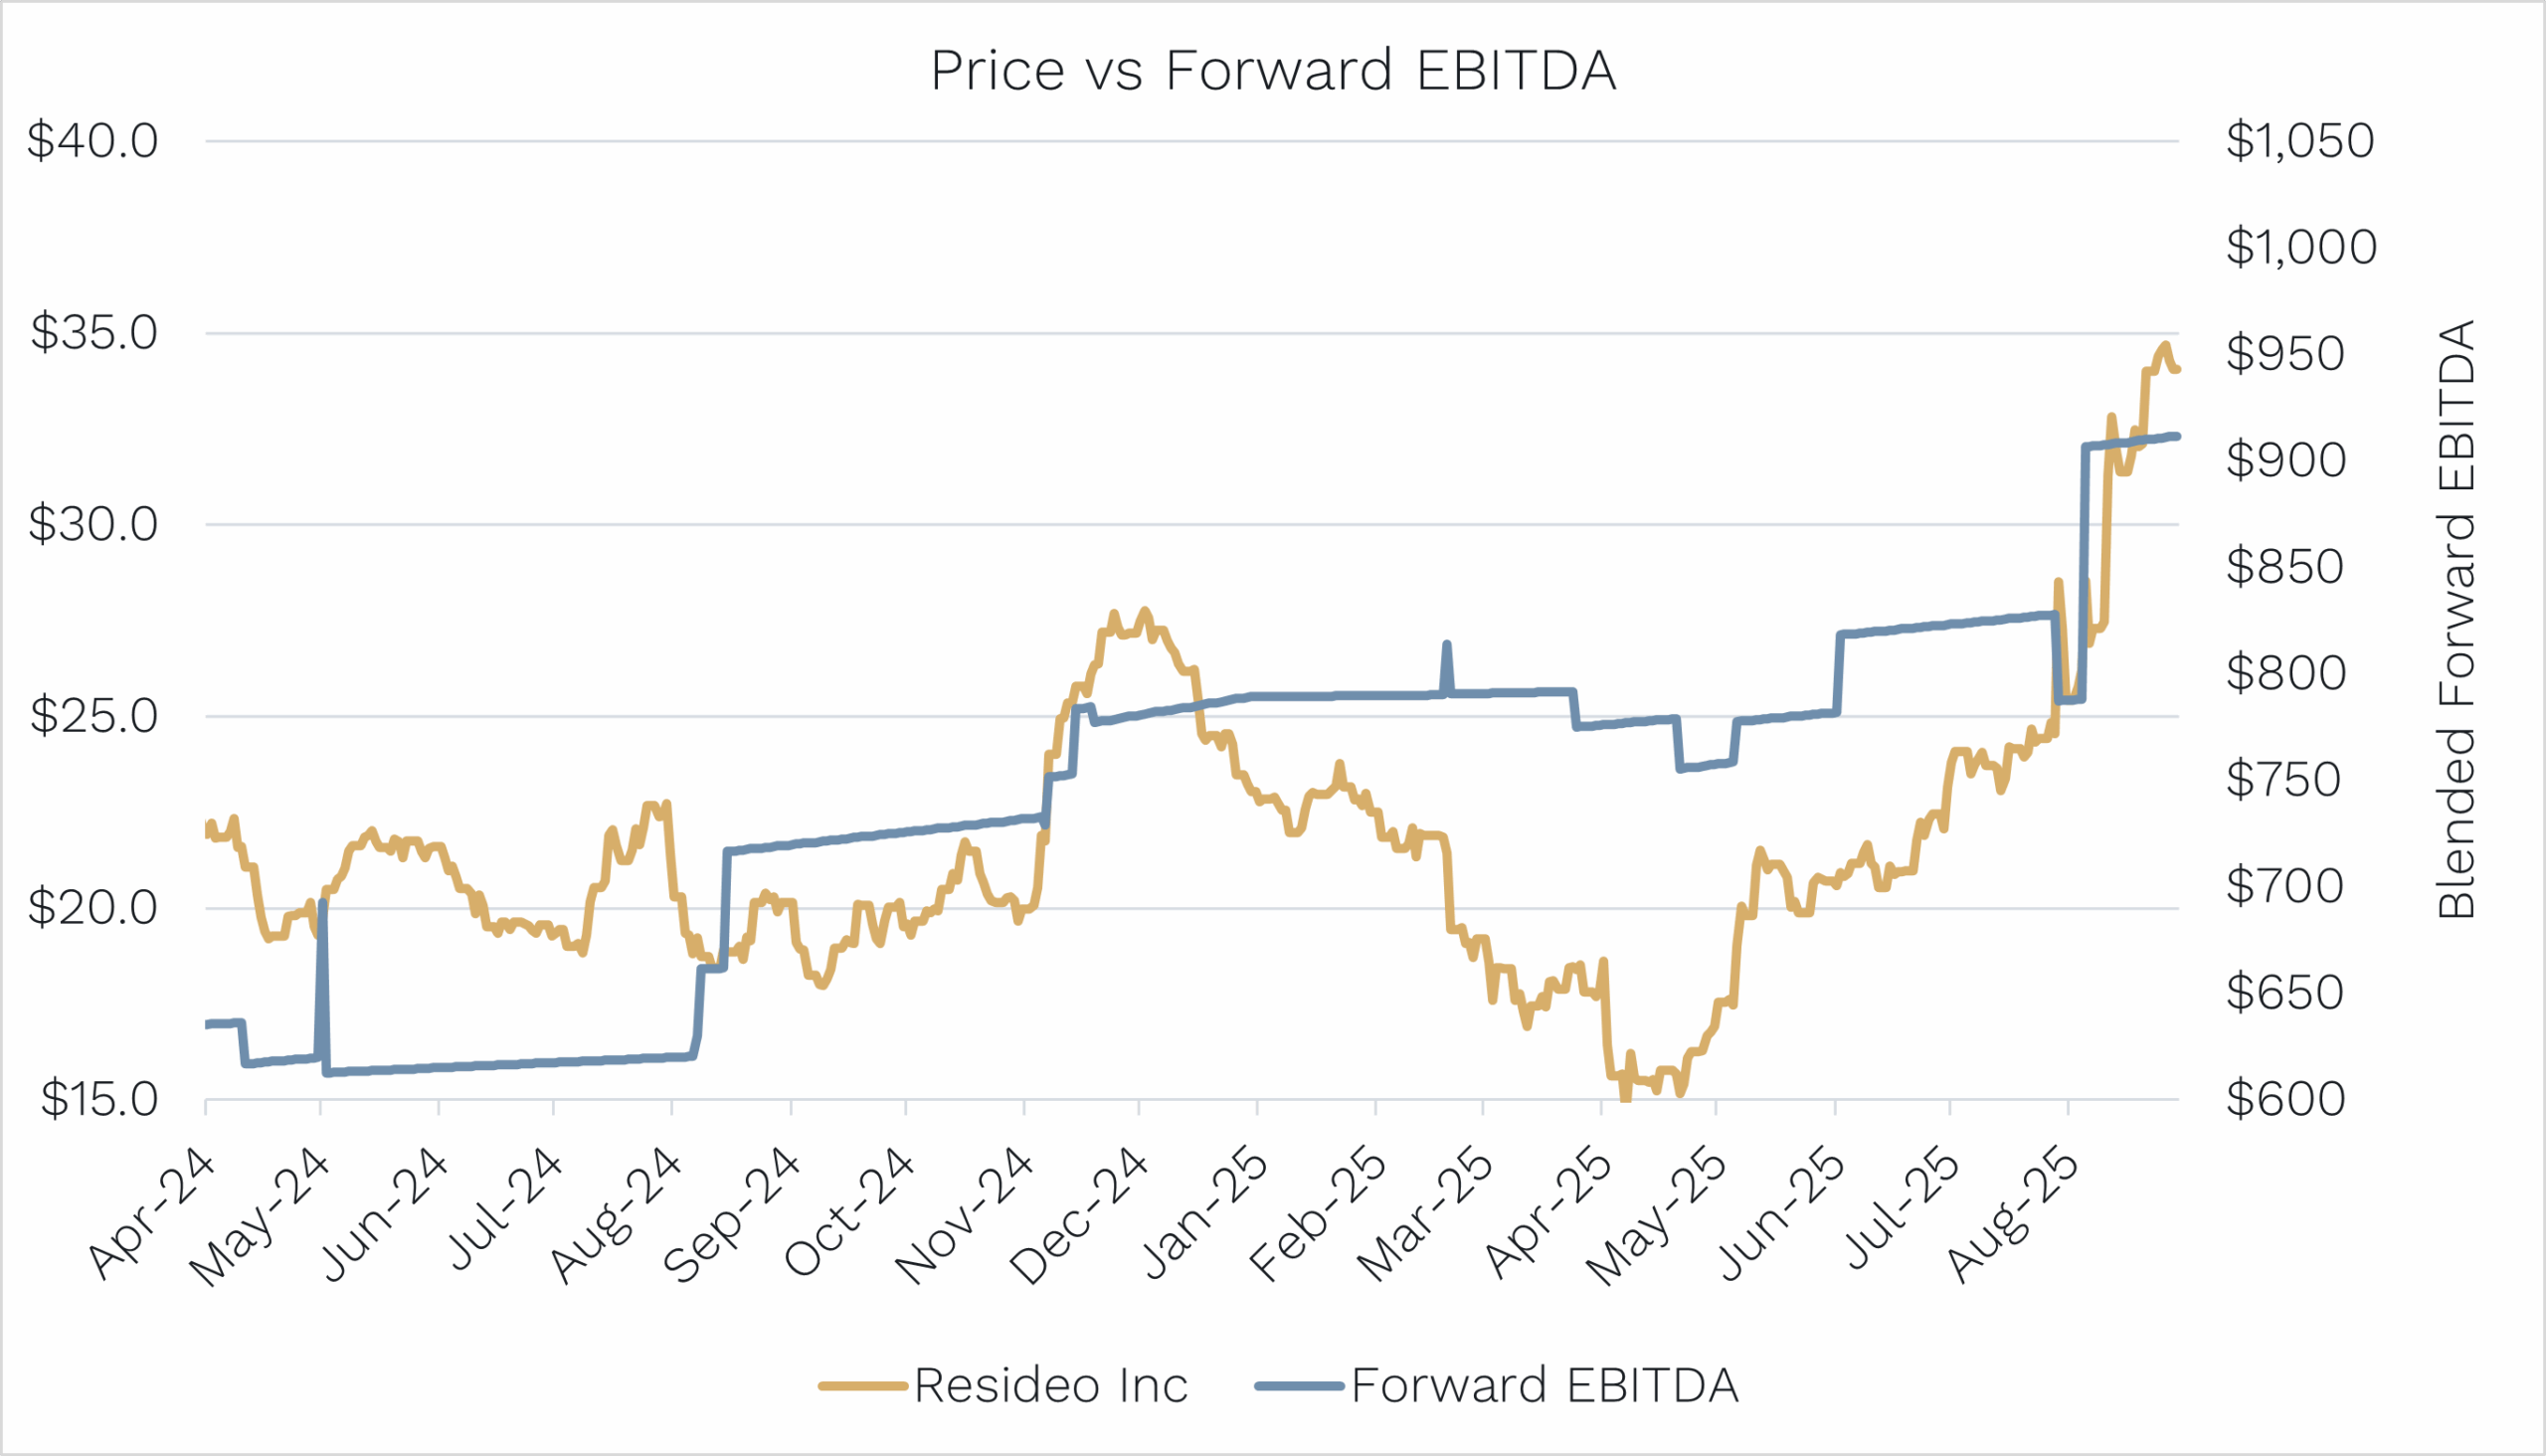
Two companies that we have recently added to our portfolios, which thrive in strong or weak macro, include Resideo (REZI) (see below for a deeper dive) and Descartes Systems (DSGX).

These sit alongside existing names like IES Holdings (IESC) and AAR Corp (AIR), a group that lets us participate in a recovery while providing downside protection.

We looked at both businesses in more detail previously (here and here).

Below, we look at a winner and loser from results season.

But first, stepping back, there were six key issues and themes that emerged during the period that particularly gained our attention:

  1. Investors take profits

On balance, we saw profit-taking throughout reporting season, particularly for companies whose share prices had run strongly into their results.

Companies that delivered strong quarters, often saw their share prices fade a few days after earnings.

This was particularly the case for companies with a more cyclically dependent second half.

  1. Market breadth widens

The share price fades were a sign that investors were rotating into less well-held names.

This apparent rotation is reflected in the continued widening of market breadth.

Within the Russell 2000 index, the micro-cap subset has been outperforming over the last few months.

Source: Ophir. Bloomberg.

  1. Rate cut prospects boost small caps

As the chance of a Fed rate cut in September increased, we saw this flow into small caps more broadly in August, with the Russell 2000 up 7% compared to the S&P 500’s 2% gain.

Source: Ophir. Bloomberg.

Direct beneficiaries of these lower rate expectations were home builders, building product suppliers and select REITs as the market anticipates housing transaction volumes to recover from their current historically low levels.

  1. Tariff uncertainty continues

Investors questioned companies with tariff exposure that had strong quarterly results. They were concerned that pre-buying ahead of tariffs had pulled forward demand, giving the results a one-off boost.

  1. Tech and healthcare struggle

The reporting season showed little patience for ‘good but not great’.

This was especially true in tech and software, where AI-fuelled names are facing growing fears of commoditisation.

Some examples (that we don’t hold) include The Trade Desk (TTD), HubSpot (HUBS) and Twilio (TWLO), which saw significant drawdowns in their share prices despite relatively solid results.

Healthcare was another tough spot. Investors were concerned about cost-cutting mandates (including RFK Jr. policy noise) and looming cuts to Medicare/Medicaid, and as a result, aggressively rotated out of the sector.

  1. Positive outlooks tempered by caveats

However, when providing forward-looking statements, most companies sounded more constructive than last quarter. Though almost all added a caveat around tariffs and the consumer outlook.

Several also referenced concerns about “a left-field tweet” or regulatory surprise.

This is something investors must get used to under a Trump Administration.


Two results case studies (a winner and loser)

Below, we take a closer look at one winner and one loser from the recent results season.

The Winner – Resideo Technologies (NYSE: REZI)

Spun out of Honeywell in 2018, Resideo operates two distinct business units:

  • Products & Solutions (P&S): Smart thermostats, air quality monitors, fire/security systems, and
  • ADI Distribution: Access control, fire protection, AV, and connected home product wholesaling

We’ve known Resideo for several years and re-initiated a large position ahead of the quarter. Our thesis was simple: The P&S division was quietly outperforming peers; gross margins were improving, and the company’s valuation was highly attractive at <10x earnings.

Source: Ophir. Bloomberg.

What Drove the Result

REZI’s Q2 result delivered on all fronts:

  • Earnings guidance was upgraded due to stronger volumes and better margins
  • A legacy environmental liability from the Honeywell spin was bought out
  • Management announced plans to split the business into two standalone entities, unlocking appropriate multiples for each

Do We Still Own It?

Yes … and we’re still bullish.

The stock has rallied ~40% since our entry, but is still only trading on ~12x earnings.

With operational momentum accelerating, and a likely Investor Day in early 2026 to highlight the long-term earnings potential of each segment, we believe there is still meaningful upside ahead — especially if Fed rate cuts begin to support housing activity.


The Loser – Tandem Diabetes Care (NASDAQ: TNDM)

Tandem is the world’s #2 provider of insulin pumps, with its flagship t:slim X2 product integrating with CGMs (Continuous Glucose Monitors) to automate insulin delivery and improve glycaemic outcomes.

Why We Owned It

Heading into results, we believed the market was overly pessimistic and missing upside from three key drivers:

  1. The launch of the Mobi, which is a smaller, next-gen device;
  2. ASP (average selling price) uplift through pharmacy reimbursement; and
  3. Early traction in Type 2 diabetes, expanding the patient pool.

With the stock heavily sold off prior to the result, we believed downside was limited and that consumables and renewals would provide valuation support.

We did extensive work, including site visits, peer calls, distributor checks, and endocrinologist interviews.

What Went Wrong

The bear case on lower U.S. patient adds played out, and Tandem took a more cautious tone on second-half growth due to a competitor launch.

While Tandem maintained its full-year revenue guidance, the mix shifted toward Europe, and the company trimmed EBITDA guidance (driven by non-cash adjustments).

Source: Ophir. Bloomberg.

Do We Still Own It?

No.

We were frustrated by the magnitude of the sell-off, particularly given revenue was unchanged. But in the U.S. market, perceived share loss is lethal. We are also aware that cheap isn’t a catalyst.

With our channel checks and industry research not as accurate as needed, we decided to exit.

While our thesis may still play out in time, it’s more valuable to reallocate capital to higher-conviction names than try to chase lost ground on Tandem.


Continuing to deliver despite macro conditions

This reporting season reaffirmed our conviction that valuation alone isn’t enough. You need the setup, the positioning, and the execution to all line up.

But we’re encouraged that even in a tough tape, our balanced, fundamentals-driven approach continues to deliver.

Our focus remains on companies with multi-year growth drivers, improving business quality, and compelling valuations… with or without macro support.


Previous

8 Sep, 2025 Letter to Investors - August 2025

Next

10 Oct, 2025 Letter to Investors - September 2025
8 Sep, 2025

Letter to Investors - August 2025

Letter to Investors • 13 mins read

Back to Insights Back to Insights

Optimism Dies Hard

PDF

In this Letter to Investors, we look at:

  • How share market breadth is back, with small caps posting a stellar August
  • The extreme valuation differential between small and large caps that suggests smalls are strongly placed to outperform in the next 5-10 years
  • The outlook for small caps for the next 12-18 months based on four scenarios (which scenario is most likely, and which is best for small caps)
  • How small caps are one of the most attractively valued asset classes anywhere in the world today, and
  • Why all this makes us confident that our Funds are poised to deliver 15%+ average returns in the coming years

Ophir Fund Performance – August 2025

Before we dive into the Letter, you’ll find a detailed monthly update on each of the Ophir Funds below.

The Ophir Opportunities Fund returned +10.3% net of fees in August, outperforming its benchmark which returned +8.4%, and has delivered investors +24.0% p.a. after fees since inception (August 2012).

Factsheet

The Ophir High Conviction Fund (ASX:OPH) investment portfolio returned +6.3% after fees in August, underperforming its benchmark which returned +7.0%, and has delivered investors +14.8% p.a. after fees since inception (August 2015). The ASX listing returned -1.9% for the month.

Factsheet

The Ophir Global Opportunities Fund* returned +4.9% net of fees in August, outperforming its benchmark which returned +2.1%, and has delivered investors +18.8% p.a. after fees since inception (October 2018).

Factsheet

The Ophir Global High Conviction Fund* returned +4.1% net of fees in August, outperforming its benchmark which returned +2.1%, and has delivered investors +14.7% p.a. after fees since inception (September 2020).

Factsheet

*Refers to Class A units.

Welcome to the party, pal!” – John McClane

It’s Christmas Eve 1988 in Los Angeles.

Terrorist Hans Gruber and his band of German thugs have just crashed Nakatomi Plaza’s Christmas party and are looking to rob the joint.

What Hans didn’t count on, though, is that NYPD cop John McClane is making a surprise visit to the Plaza to reconcile with his estranged wife Holly who is attending the party.

After tossing a terrorist out of a window onto an unsuspecting LAPD cop car below, McClane yells his classic line to the startled driver: “Welcome to the party, pal”.

Source: Die Hard (1988).

It was, of course, action hero Bruce Willis as McClane who delivered the line in the cult classic and holiday favourite, Die Hard. Suddenly, Arnie’s Terminator quip of “I’ll be back” had some competition for best 80s action movie one-liner

August reminded us that, despite the laundry list of macro risks, investors’ optimism too “dies hard”.

During the month, investors couldn’t be held back, and even small-cap investors got a “welcome to the party” this month.

August saw the market add more gains to the rally from April’s post Liberation Day share market low.

The S&P 500 in August was up +2.0%. U.S. small caps put on a whopping +7.0%, boosted by Fed Chair Powell opening the door to a September rate cut.

Following in the footsteps of its U.S. big brother, ASX large and small caps put on a very similar +2.7% and +8.5% respectively (ASX100 and ASX Small Ords).


Small caps to trounce large?

Share market “breadth is back baby” I can hear John McClane say.

Regular readers will know we’ve been highlighting how the epic small-cap-market underperformance over the last 4-5 years has made small-cap valuations globally versus large the cheapest in a generation (25+ years).

The mega-cap tech companies have body slammed the rest of the market for much of the last decade.

The chart below shows the different size (large/mid/small) and style (value/core/growth) segments of the U.S. share market since 2017.

The mega-cap tech poster childs, the Magnificent 7, are all large-cap growth businesses.

(Source: Piper Sandler & Co.)

But based on history, the extreme valuation differential we see now means that it’s highly likely small caps will trounce large caps over the next 5-10 years.

So what will the next 12-18 months look like?


Four Scenarios

You thought breaking Holly out of Nakatomi Plaza was tough, well short-term forecasting is the investment equivalent!

So, for this month’s Letter to Investors, we thought we’d lay out the four most likely near-term economic scenarios for U.S. small caps, which given their 65% odd share, is also likely to drive small caps globally.

The four scenarios we see immediately ahead are outlined below from most to least likely, with our best estimate for their likelihood in brackets:


1. Fed normalises rates, low growth continues (40%)

This is the most likely scenario. We’re in good company because it’s the consensus of market participants and economists.

As you can see below, the market is pricing that after being on hold so far this year, the Fed will get off the fence and recommence its rate-cutting cycle at its next meeting on 17th September (blue line).

Source: Ophir. Bloomberg.

For us as stock pickers, this is typically a good environment.

Market returns might be more modest. But when economic (1-2% forecast above) and corporate earnings growth are low, higher-growth companies that we focus on (and are experienced in finding before the market) suddenly become rare diamonds and get bid up by the market.

Scenario 1 bottom line: Moderate market returns (including small caps); best outperformance opportunity


2. Fed normalises rates, growth booms (30%)

The next most likely outcome is rates normalising lower and helping kick off an economic boom later this year and next.

For most businesses in the U.S., rates have been uncomfortably high for many years. It shows as sluggish aggregate earnings growth outside the Magnificent 7.

Combine that with Trump’s One Big Beautiful Bill – including its immediate expensing of Capex and R&D and deregulatory agenda – and some economists see U.S. real GDP boosted to near 3% next year.

This would ignite rocket fuel under the risk-on and cyclical parts of the share market, including the housing, energy, financial, materials sectors … and small caps.

For investors, these are the exciting types of environments where you make 20-50% in a year from the small-cap market.

But while great market returns in small caps could be expected, it would be a more challenging environment for us to outperform.

Why?

Because we tend to be underweight the most cyclical sectors of the share market, particularly energy, financials and materials.

Cyclicals tend to have fewer of the structural-growth businesses that we like to focus on (low-growth regional banks dominate the financial sector in the U.S.).

We also don’t have expertise in forecasting the underlying commodity prices that dominate short-term moves in energy or materials businesses.

Source: Piper Sandler

Still, in this scenario, our investors are likely to be happy because small caps will probably have ripped big time; and we’ll be happy to just keep up with that boom.

Scenario 2 bottom line: Best small-cap market returns, will be tougher for us to outperform


3. Fed cuts quickly as recession arrives (25%)

The consensus of economic forecasters puts the probability of a U.S. recession in the next 12 months in the 25-30% range (Bloomberg).

That may sound high until you realise the forecasts never get below 15%, because recessions occur, on average, about one in every seven years.

So, while recession risk is a little elevated – mostly due to risks from U.S. tariffs and a still-restrictive Fed policy rate – a recession is not the most likely outcome expected from most in the “dismal science”.

But if one did occur, then undoubtedly share markets would fall as they always have in U.S. recessions. This is the worst-case outcome for market returns in both large and small caps.

Just because the recession probability is elevated, though, there is no point getting too defensive by doing things like going to cash for two main reasons:

  1. It’s not the most likely scenario and the cost of foregone returns could be huge if the likelier scenarios above play out; and
  2. Even if a recession is on the cards, it’s virtually impossible to predict the exact timing of the market downturn (and subsequent recovery) that historically has always accompanied it, like you’d need to in order to be better off than just staying invested.

Nine out of 10 times in a recession small caps fall more than large caps. But there is a good case to be made that may not happen if a recession occurred today.

The last recession where large caps fell more than small caps was the Dot.com-related recession in the early 2000s.

Large caps fell more because they were so much more expensive than small caps.

Ring a bell, anyone?

Today, small caps are the cheapest versus large since just before that Dot.com recession.  So it’s a real possibility that, if a recession were to rear its head today, large caps would fall more than smalls in a sell-off.

The sectors that do well in a recession are “stability” sectors like health care, consumer staples, utilities and real estate (see table below).

Source: Piper Sandler

The other group of companies that outperform in a recession are businesses whose earnings are beating market expectations. These are our forte.

And while we tend to invest less in utilities and real estate, the health care and consumer staples sectors are firmly in our wheelhouse and provide us with plenty of opportunity to outperform.

Scenario 3 bottom line: Worst market returns (though small caps may outperform); moderate outperformance opportunity


4. Inflation ramps and Fed raises rates (5%)

What happened to all that inflation we were promised by the market pundits from Trump’s tariffs?

If it turns out that material inflation is still on the way – even though the Fed playbook is to look through tariff-induced inflation – we could see higher interest rates if it feeds into higher inflation expectations.

We think this is the least likely scenario, though it’s not completely off the table.

But the Fed will have a high bar for it to decide to reverse its forecasts for rate cuts, even putting aside Trump’s pressure to stack the Federal Open Market Committee (FOMC) with sycophants to get them lower.

Investors could see this as a mini replay of what happened in 2021/2022 when rates rose, markets sold off, and small-cap growth-oriented businesses felt the worst of the valuation squeeze.

This time, though, instead of rates lifting from zero, they are already at 4.5% today in the U.S.

We are not sure the U.S. economy could handle much higher rates without causing a more serious slowing in demand and inflation.

Also, today, U.S. small caps trade on a below-average 16x price-to-earnings ratio (PE). That’s a far cry from the two standard deviations expensive 22x they traded on prior to the 2021/2022 sell-off, so they likely have less downside risk.

Source: Ophir. Bloomberg

Regardless, this scenario would likely see markets fall, though not likely as much as in the recession scenario.

It would be hard for us to outperform, though, as the faster-growing small caps we invest in would have their valuations impacted more.

Lucky it’s the least likely scenario, with probably a 5% or lower likelihood.

Scenario 4 bottom line: markets likely fall, worst outperformance opportunity


An exciting time to be a small-cap investor

Now that’s a lot of different scenarios and only one, or perhaps even a variant of one, will play out. But it’s good to understand the risks, though not be frozen by them. That’s investing.

The first two scenarios are the most likely in our view and great for Ophir investors.

The third is bad for investors, but we think there are quite good prospects that we will perform better than large caps.

The fourth is the worst but least likely.

But this is the short term: the next 12-18 months.

Investors in our Funds should have a minimum time horizon of at least five years.

And on that score global small caps are cheap. They are one of the very few asset classes you can say that about today and that’s great news.

So, as we look out over the next five years we remain confident we can achieve our internal target of 15% per annum on average – a level we have met or exceeded in all our Funds.

Valuations in our part of the market are attractive.

The team is experienced, stable and locked in.

And we remain as hungry as ever to deliver great returns for ourselves and our investors.

As John McClane might say “Yippee-ki-yay”!


As always, thank you for entrusting your capital with us.

Kindest regards,

Andrew Mitchell & Steven Ng

Co-Founders & Senior Portfolio Managers

Ophir Asset Management

This document has been prepared by Ophir Asset Management Pty Ltd (ABN 88 156 146 717, AFSL 420082) (“Ophir”) and contains information about one or more managed investment schemes managed by Ophir (the “Funds”) as at the date of this document. The Trust Company (RE Services) Limited ABN 45 003 278 831, the responsible entity of, and issuer of units in, the Ophir High Conviction Fund (ASX: OPH), the Ophir Global Opportunities Fund and the Ophir Global High Conviction Fund. Ophir is the trustee and issuer of the Ophir Opportunities Fund.

This is general information only and is not intended to provide you with financial advice and does not consider your investment objectives, financial situation or particular needs.  You should consider your own investment objectives, financial situation and particular needs before acting upon any information provided and consider seeking advice from a financial advisor if necessary. Before making an investment decision, you should read the relevant Product Disclosure Statement (“PDS”) and Target Market Determination (“TMD”) available at www.ophiram.com or by emailing Ophir at ophir@ophiram.com. The PDS does not constitute a direct or indirect offer of securities in the US to any US person as defined in Regulation S under the Securities Act of 1993 as amended (US Securities Act).

All Ophir Funds are deemed high risk within their respective Target Market Determination documentation.  Ophir does not guarantee the performance of the Funds or return of capital.  An investment may achieve a lower than expected return and investors risk losing some or all of their principal investment.  Past performance is not a reliable indicator of future performance.  Any opinions, forecasts, estimates or projections reflect our judgment at the date of this was prepared, and are subject to change without notice.  Rates of return cannot be guaranteed and any forecasts, estimates or projections as to future returns should not be relied on, as they are based on assumptions which may or may not ultimately be correct.

Actual returns could differ significantly from any forecasts, estimates or projections provided.

The Trust Company (RE Services) Limited is a part of the Perpetual group of companies. No company in the Perpetual Group (Perpetual Limited ABN 86 000 431 827 and its subsidiaries) guarantees the performance of any fund or the return of an investor’s capital.
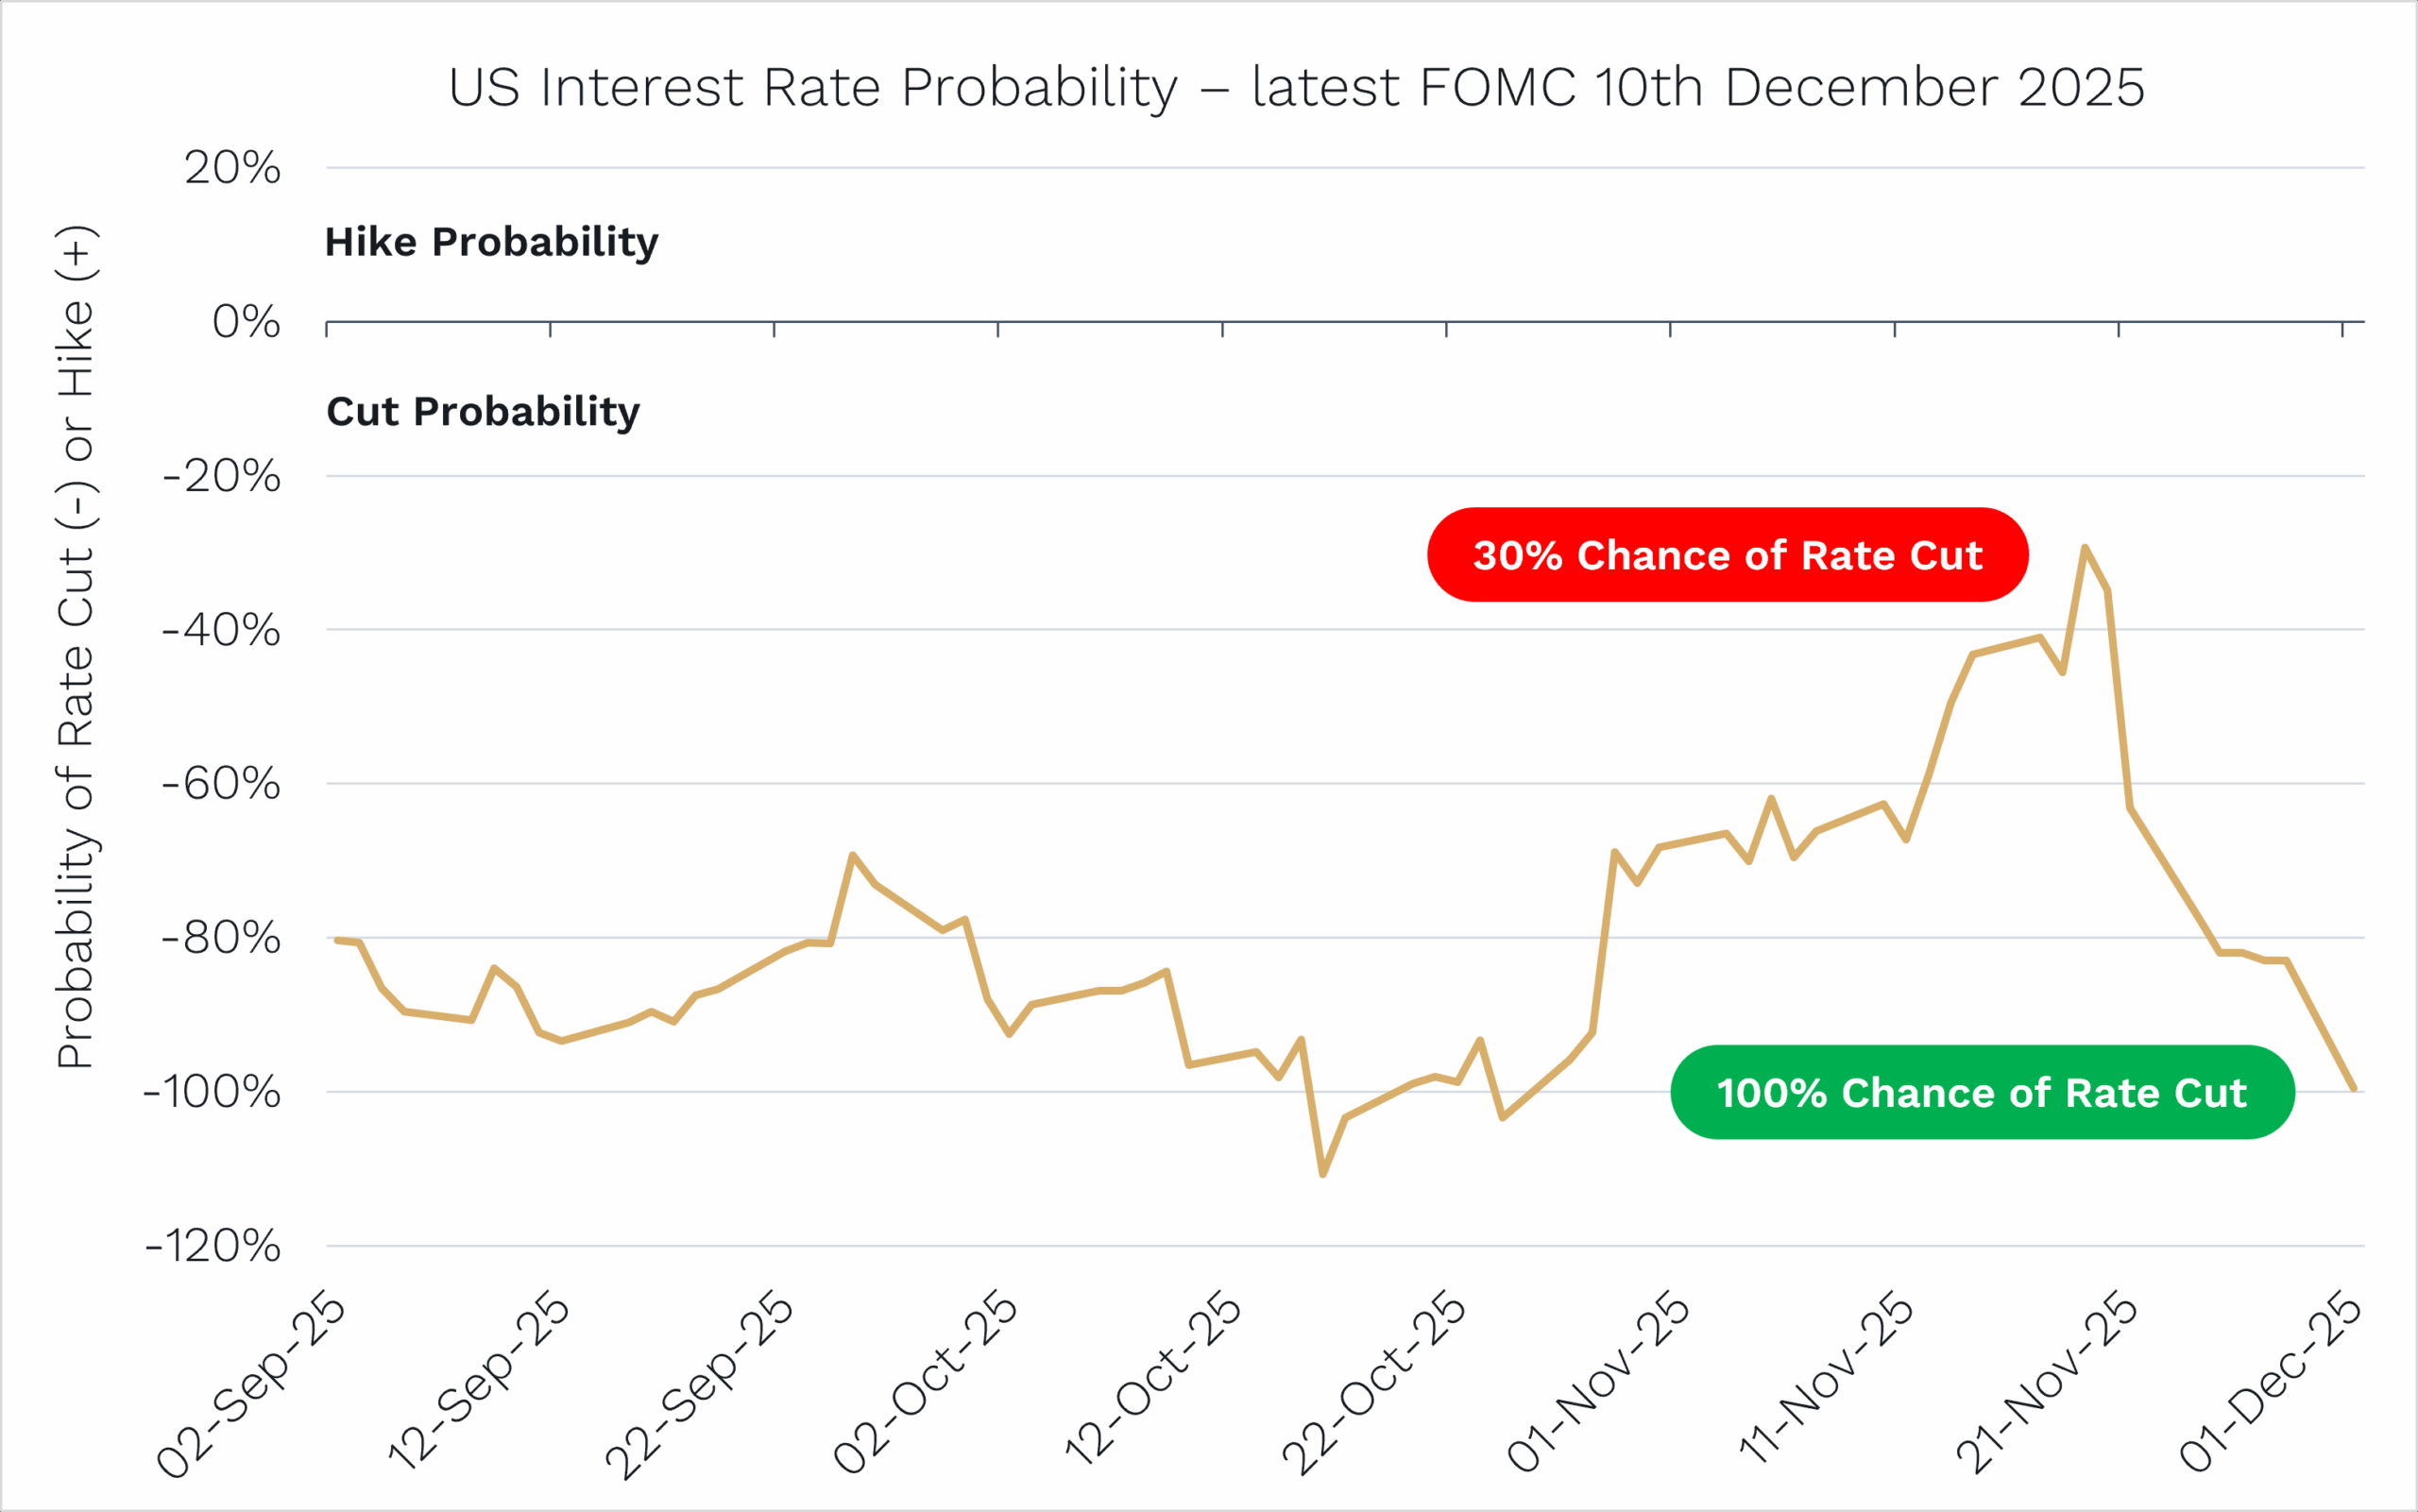
 

Previous

11 Aug, 2025 Letter to Investors - July 2025

Next

8 Sep, 2025 U.S. Reporting Season - Winners, Losers & 6 Key Themes