In this month’s Investment Strategy Note we highlight the 7 enduring truths that can help investors ride the share market’s gyrations to harvest the amazing returns on offer.
Volatility is back
After a good 18 months or so of share market gains, 2022 has been characterised by higher-than-usual volatility and market pull backs. Interest rates are heading higher in key economies, a war in Eastern Europe is creating fear and uncertainty, and there are louder and louder calls that the United States is moving towards recession.
The volatility and sell offs, though, have been unevenly spread across indices. The S&P500 in the US, the ASX All Ords in Australia and the UK’s FTSE100 are only showing modest falls. But the NASDAQ (US tech), Russell 2000 (US small caps) and Russell 2000 Growth (US small cap growth companies) indices are all in or near bear market territory (>20%+ falls, see gold bars below).
Volatility and market fall return
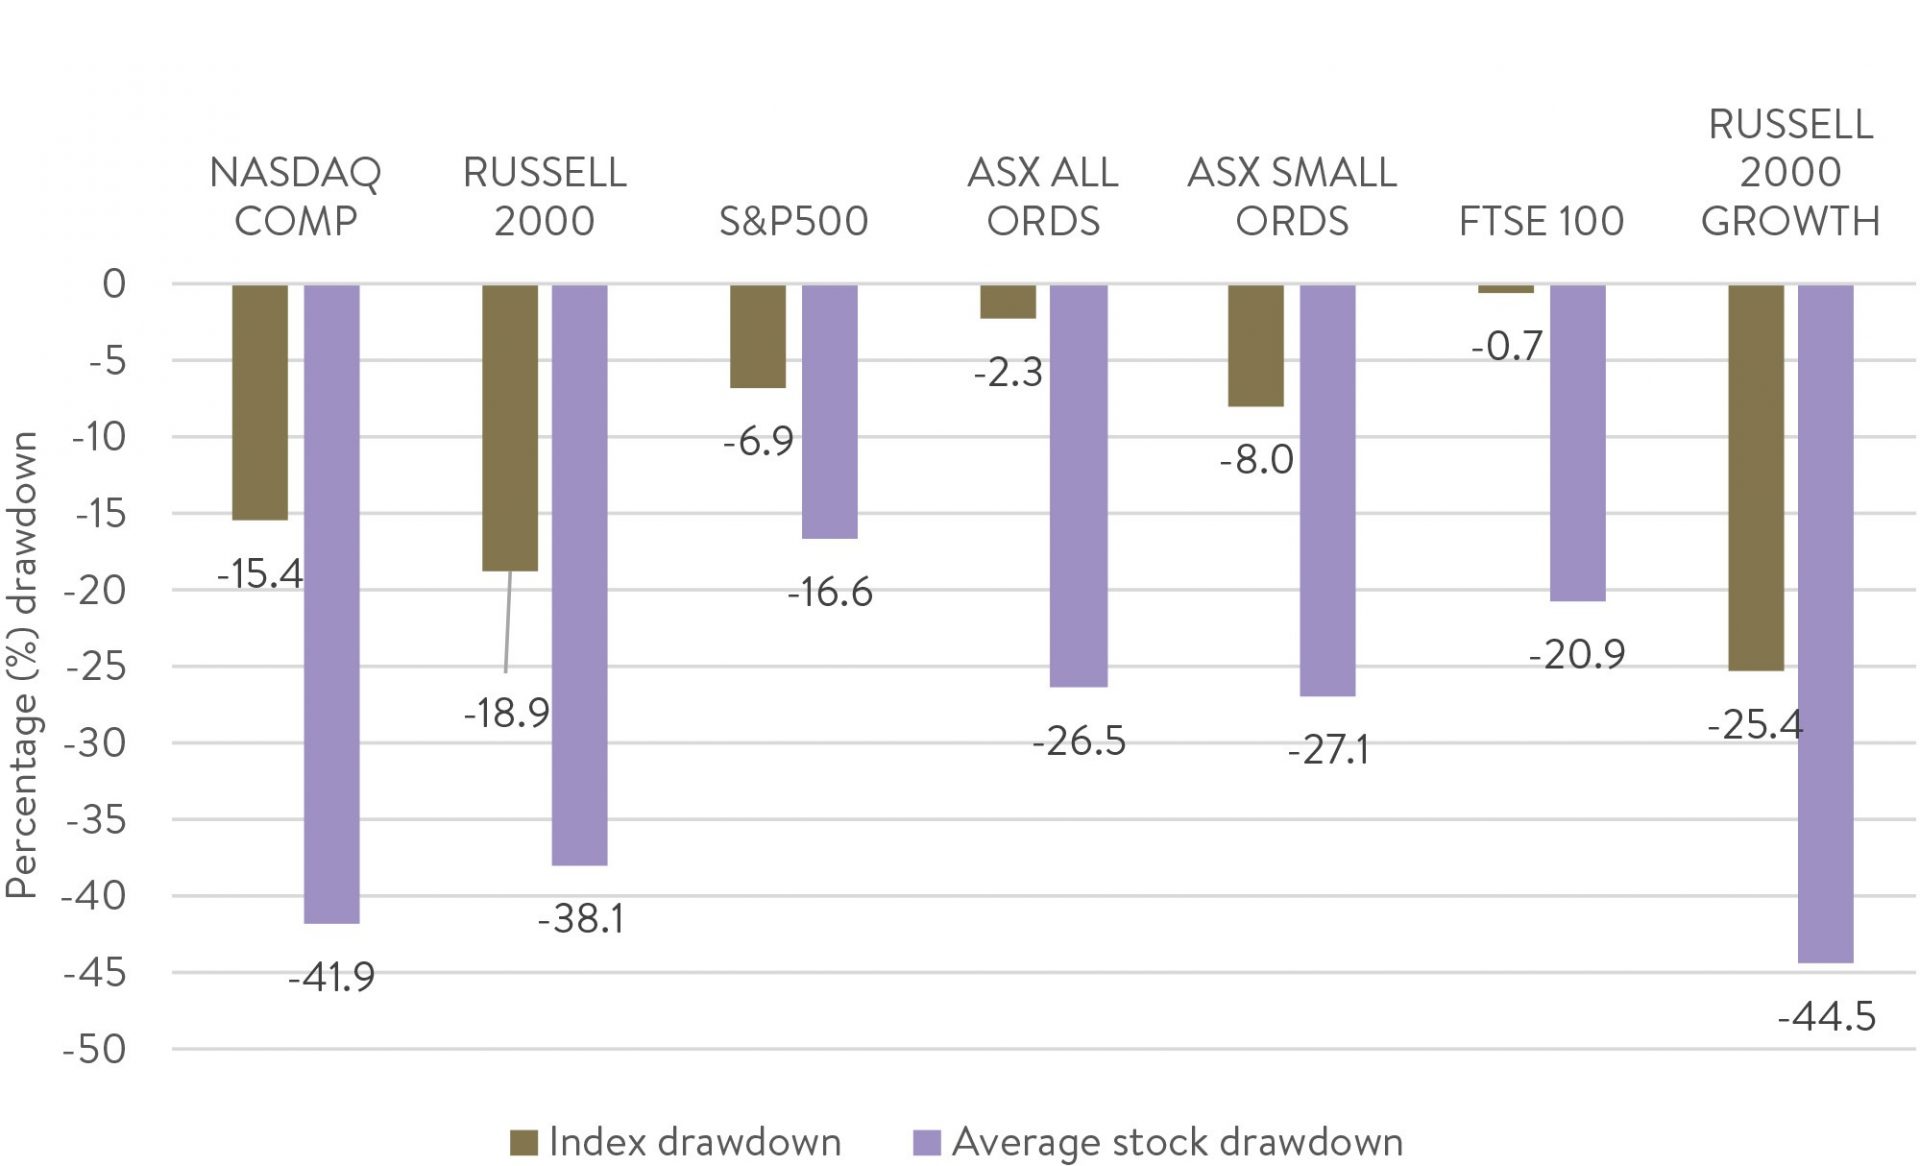
Source: Factset. Data to 10 April 2022. Drawdown equals % off 52 week high.
That, however, understates the full extent of share price action. The average index/market stock on many exchanges is down much more than the headline indices suggest (see purple bars above).
The headline indices are market-cap weighted, so the largest companies have an outsized impact on the index return. But smaller companies in each index are generally falling much more than the larger caps.
Virtually every share market investor knows that markets are risky. But how risky are they, and what exactly is ‘risk’ in share markets?
Reasonable people disagree and have differing opinions on what risk is. We prefer Elroy Dimon’s (a Professor of Finance at London Business School) definition: “Risk means more things can happen than will happen”.
We are all unique individuals with our own risk preferences. Sadly, we are not going to be able to tease out all of your risk preferences here. But we can show you a little about what you should expect on the journey so you can know if the risk is worth the return.
Below are 7 truths of the volatility of shares that we have discovered from history.
1. Even Buffett can’t avoid volatility
Many of us would love to achieve 20% per annum returns in perpetuity with no downside or falls in investment value. The only people that can do that are the Bernie Madoffs of the world and they at some point get exposed for the fraud they are and hopefully end up in jail.
Even the inimitable Warren Buffett – whose Berkshire Hathaway has provided an incredible 20.1% per annum return versus the S&P500 at 10.5% per annum from 1965 to 2021 – has had 10 negative return years (the S&P500 logged 12 over the same period).
Berkshire has also seen four years where it has falls greater than -20% and six years where it underperformed the S&P500 by more than -20% (this included years of -40.9%, -34.7%, -23.8%, -22.3%, -20.5% and -20.0% underperformance of the S&P500).
The lesson for investors here is nobody is immune from market falls, even the best in the biz!
2. Big losses are a given (but not over the long-term)
For those long-time readers, you will know we love going back in time to form our views of the future. In the charts below, we show the rolling one, five, 10 and 20 year returns for the US equity market from 1900 onwards.
What you can immediately see is that one-year returns for equity markets (gold line, top chart) can be incredibly volatile. Regular calendar year falls of -10% to -30% are relatively frequent.
However, as we go out to holding periods of 5 years (purple lines), falls become MUCH less frequent. At 10 year periods (dark grey lines) they have become practically non-existent and there are no periods of negative 20-year returns (light grey lines). This is a trend that has held fairly consistently across other developed economy share markets over time – albeit the US and Australian stock markets have been two of the better very long-term performers.
The takeaway here for investors is that the longer your holding period for shares the more likely you are to see a positive return on your investment.
USA: Holding period returns – equities
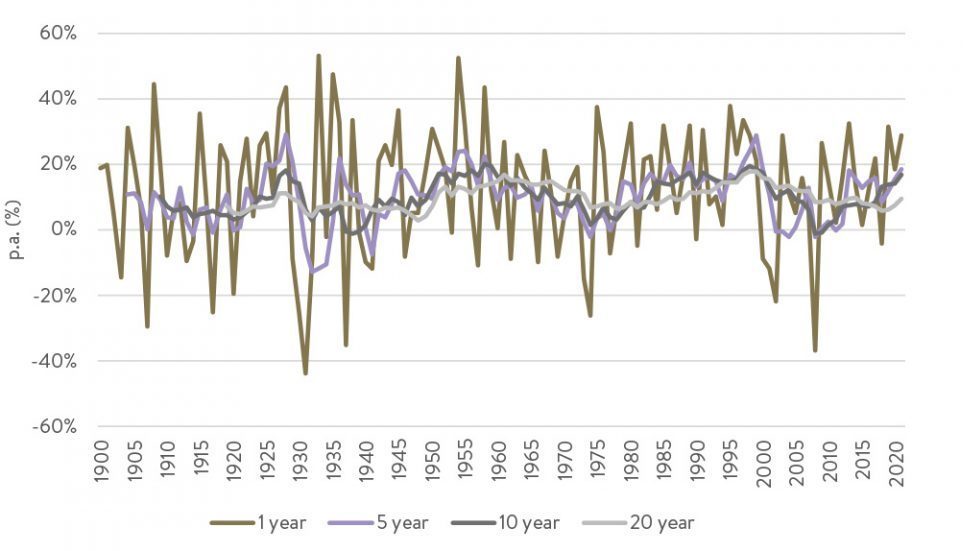
Source: Factset, Cambridge Associates
3. You are likely to see shares cut in half during your life
One of our favourite Charlie Munger (Warren Buffett’s Berkshire Hathaway business partner) quotes is: “if you can’t stomach 50% declines in your investment you will get the mediocre returns you deserve”. Charlie never was one to mince words.
Now 50% falls sound a lot. No one likes losing half of their investment, at least on paper. What Charlie was referring to here was the fact that share markets have historically gone through periods of circa -50% falls more than you may think. Below we show the drawdown (top to bottom fall) of the US share market for the last 70 years.
US Equities and Bonds Drawdown
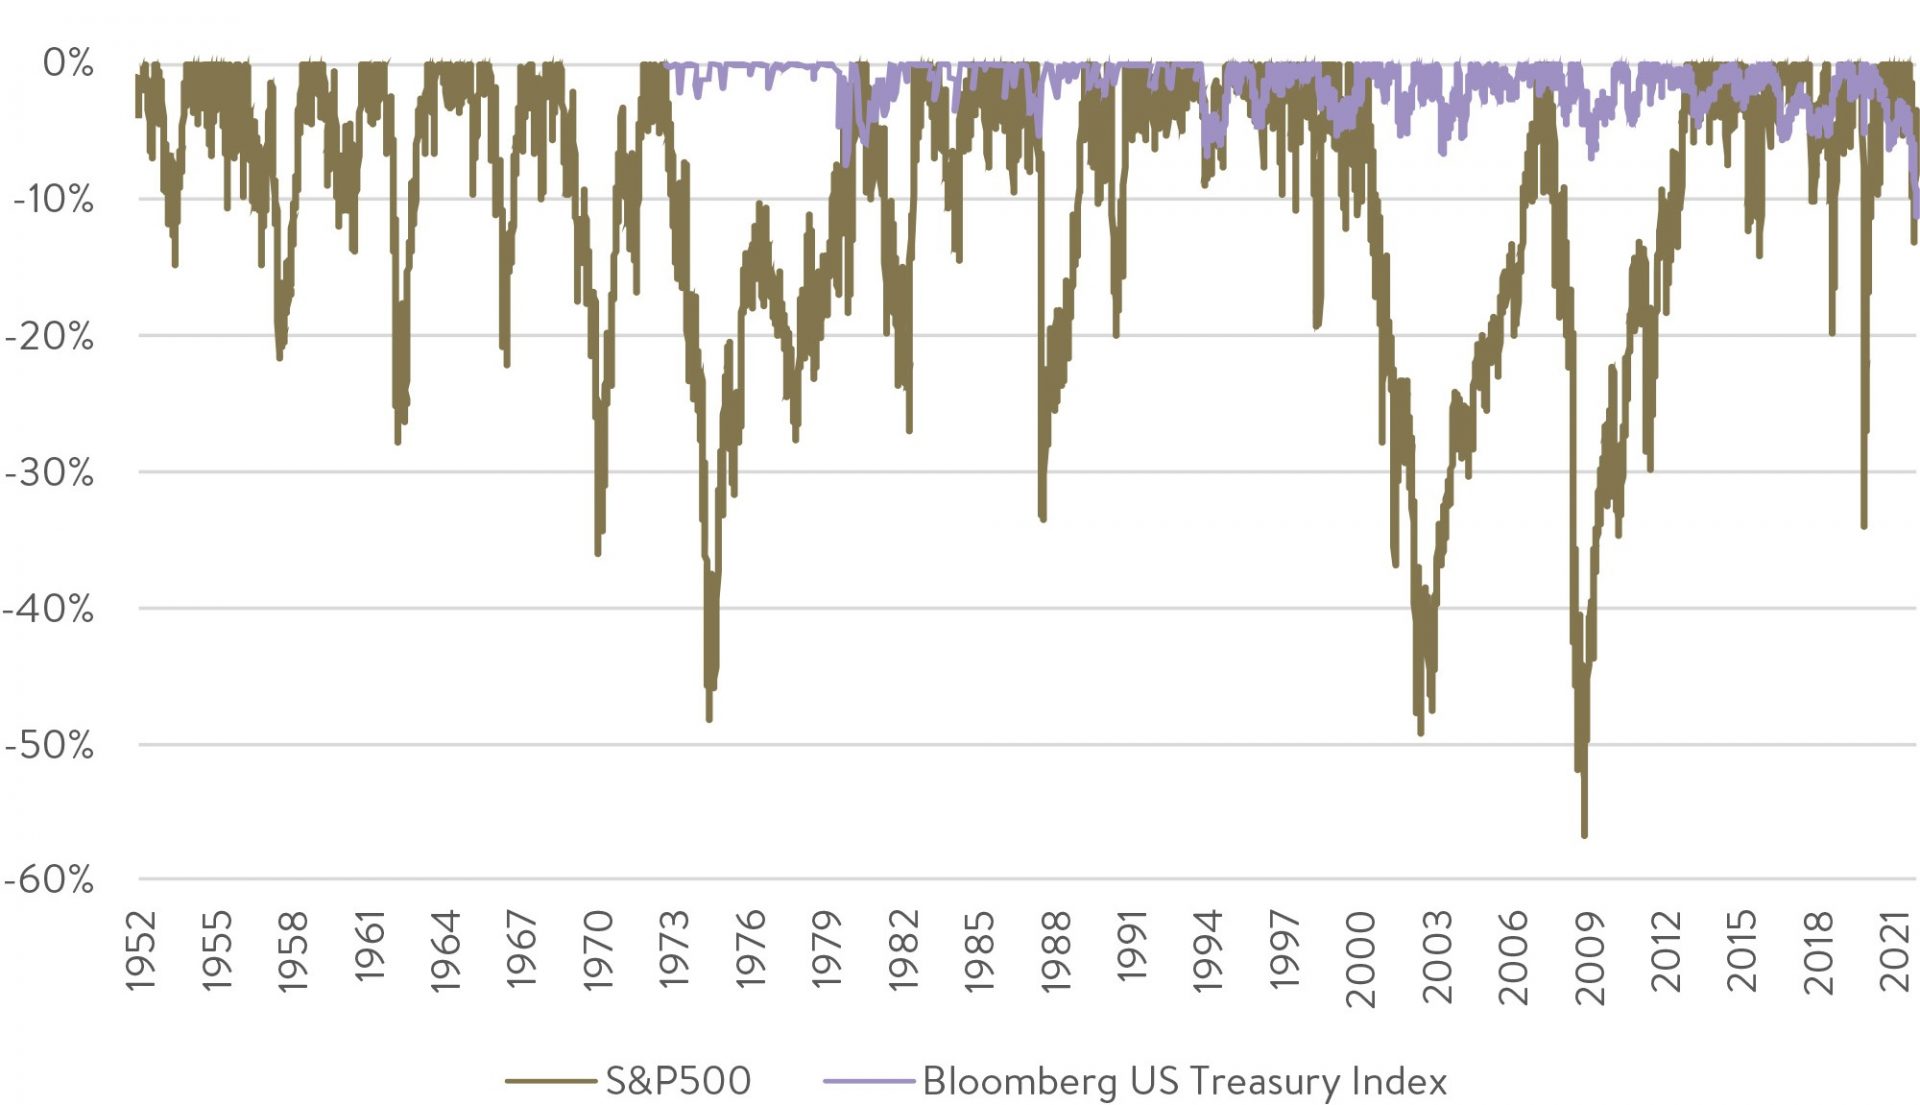
Source: Factset
There has been three approximately -50% falls:
- The 1974 market crash
- The 2000s tech wreck
- The 2008-2009 global financial crisis
History suggests there is a very good chance you may encounter at least one or two of these, if not more, in your investing lifetime.
And of course, there has been a myriad of greater than -20% market falls (or so-called bear markets).
4. Dodging big falls (timing) is impossible
Now we’d all love to be able to time markets and miss these falls, but history (and the data!) suggests this is likely to be nigh on impossible. Just think about it for a minute. If it was possible to miss these falls, the maths can very quickly show that by being exposed only to the upside of share markets you would become one of the richest people in the world.
As we will see shortly, it is BECAUSE investors have to go through the painstaking drawdowns of the share market that they tend to be handsomely rewarded over the long term. If it was possible to miss the falls, this timing wonder drug would become incredibly valuable and would likely not stay secret for long with other investors incorporating it into their investment approach. If, en masse, investors could miss all of the market falls ,then the share market would cease to be as risky, it would trade on higher valuation multiples and we all would receive the commensurately lower returns we deserve from this now safer investment.
Or if you don’t believe us, perhaps Ben Graham, one of the legends of investing can convince you: “In financial markets, hindsight is forever 20/20, but foresight is legally blind, and thus, for most investors, market timing is a practical and emotional impossibility”.
5. The pros can’t avoid drawdown risk
In case you thought mum and dad investors were the only investors who can’t time share markets and largely avoid drawdown risk, think again.
Below we show a case study using Australian small cap fund managers, though the conclusion holds in general across all equity managers.
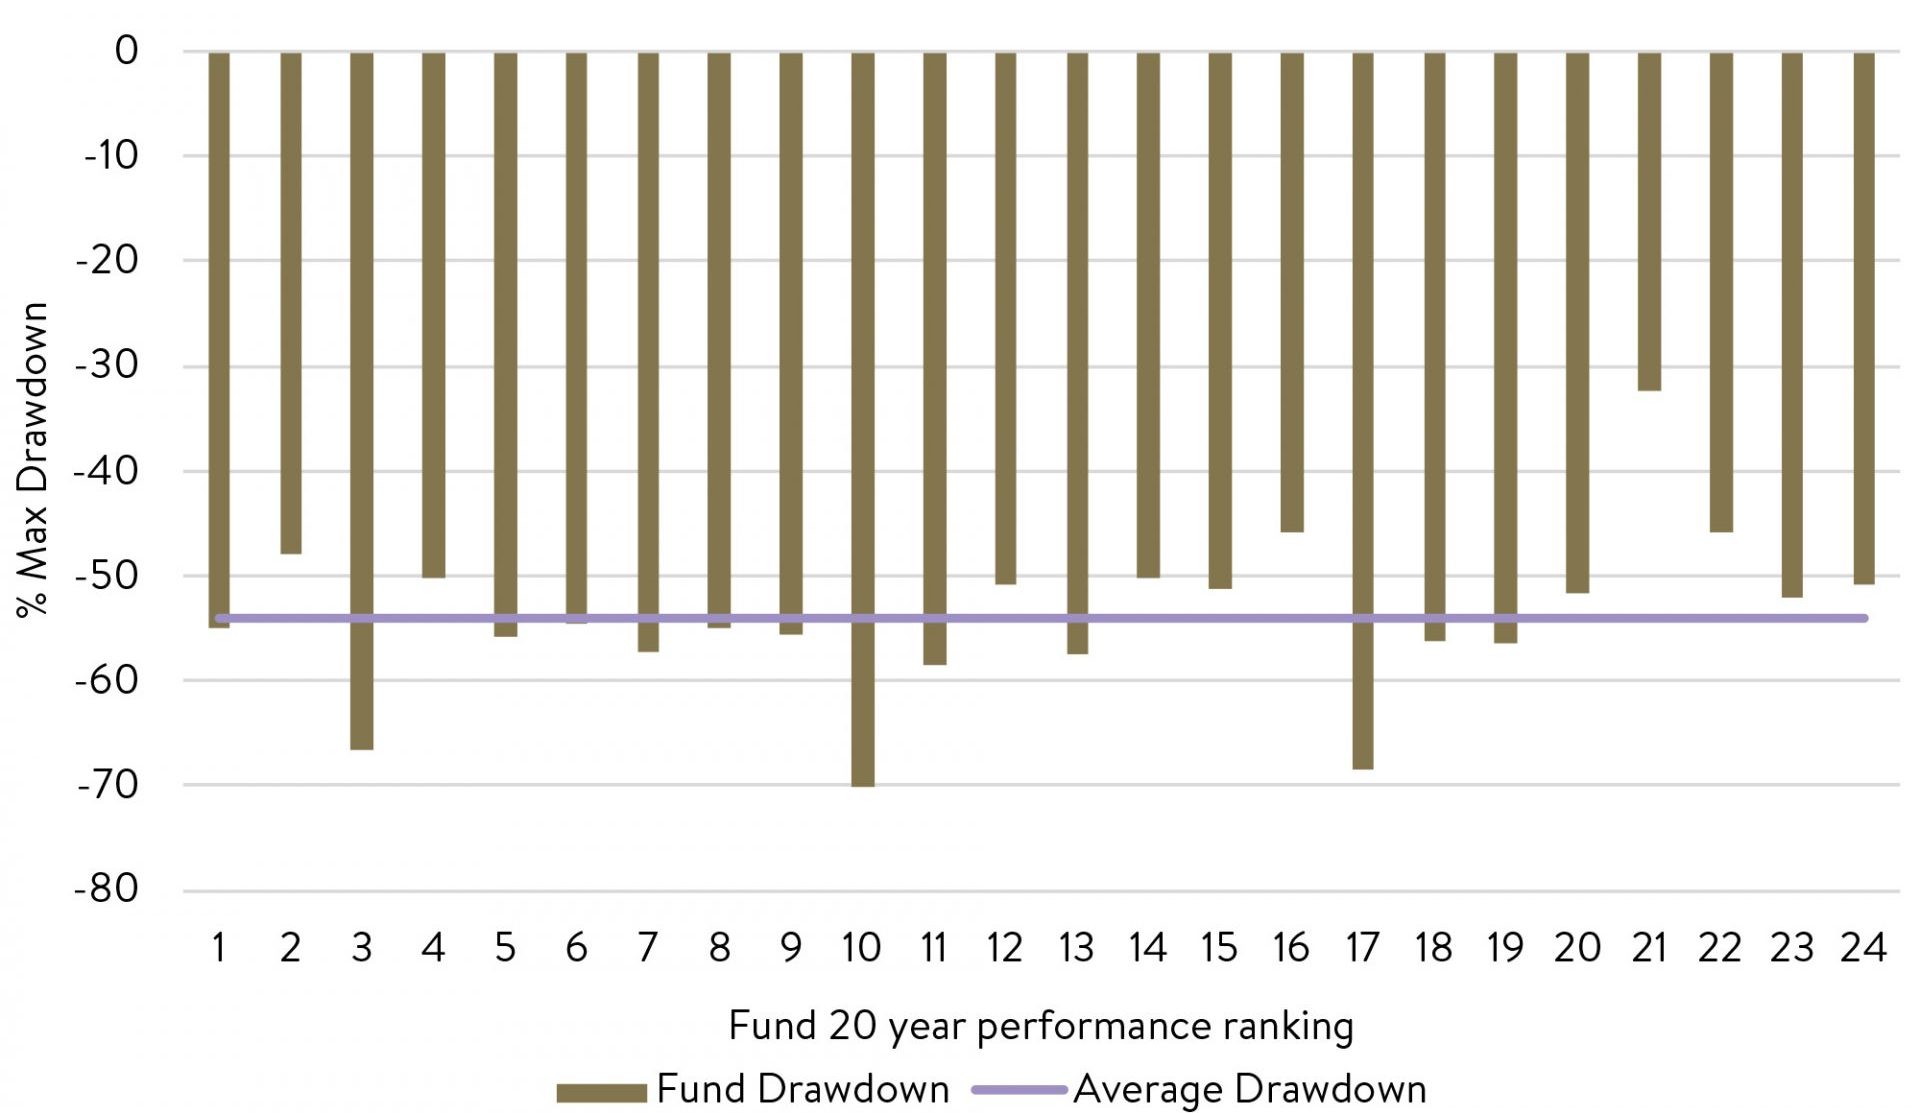
The chart below shows all the Australian small cap managers that have had a fund running for at least 20 years to 31 March 2022 (from the FE fundinfo database). There are 24 of them. We have ranked them from best performing to worst (left to right) over the two decades. We also show the maximum drawdown or fall in performance each has experienced over that time.
Australian Small Caps – Max Drawdown – 20 years to 31 March 2022
Source:
Four things stand out:
- Even the best performing managers over the long term have big drawdowns.
- There’s no relationship between the long-term performance of the manager and the size of their biggest falls in performance.
- No manager has been spared from material falls.
- The size of the biggest falls are all fairly consistent – with most between -45% and -60% .
This 20-year period includes the GFC in 2008-2009 which is when all the managers saw their biggest maximum drawdowns. This is not to say that the better performers ‘only’ falling -45% isn’t adding significant value for equity investors when the market was down more, it is.
But rather the evidence is clear that investors should not expect the pros to be able to time the markets either and avoid the periodic -50% falls that Munger says you must stomach to avoid the mediocre returns you may otherwise deserve.
6. Shares reward you handsomely over the long term
So, what has been the reward for bearing these occasional -50% share market falls and more frequent -20% bear markets?
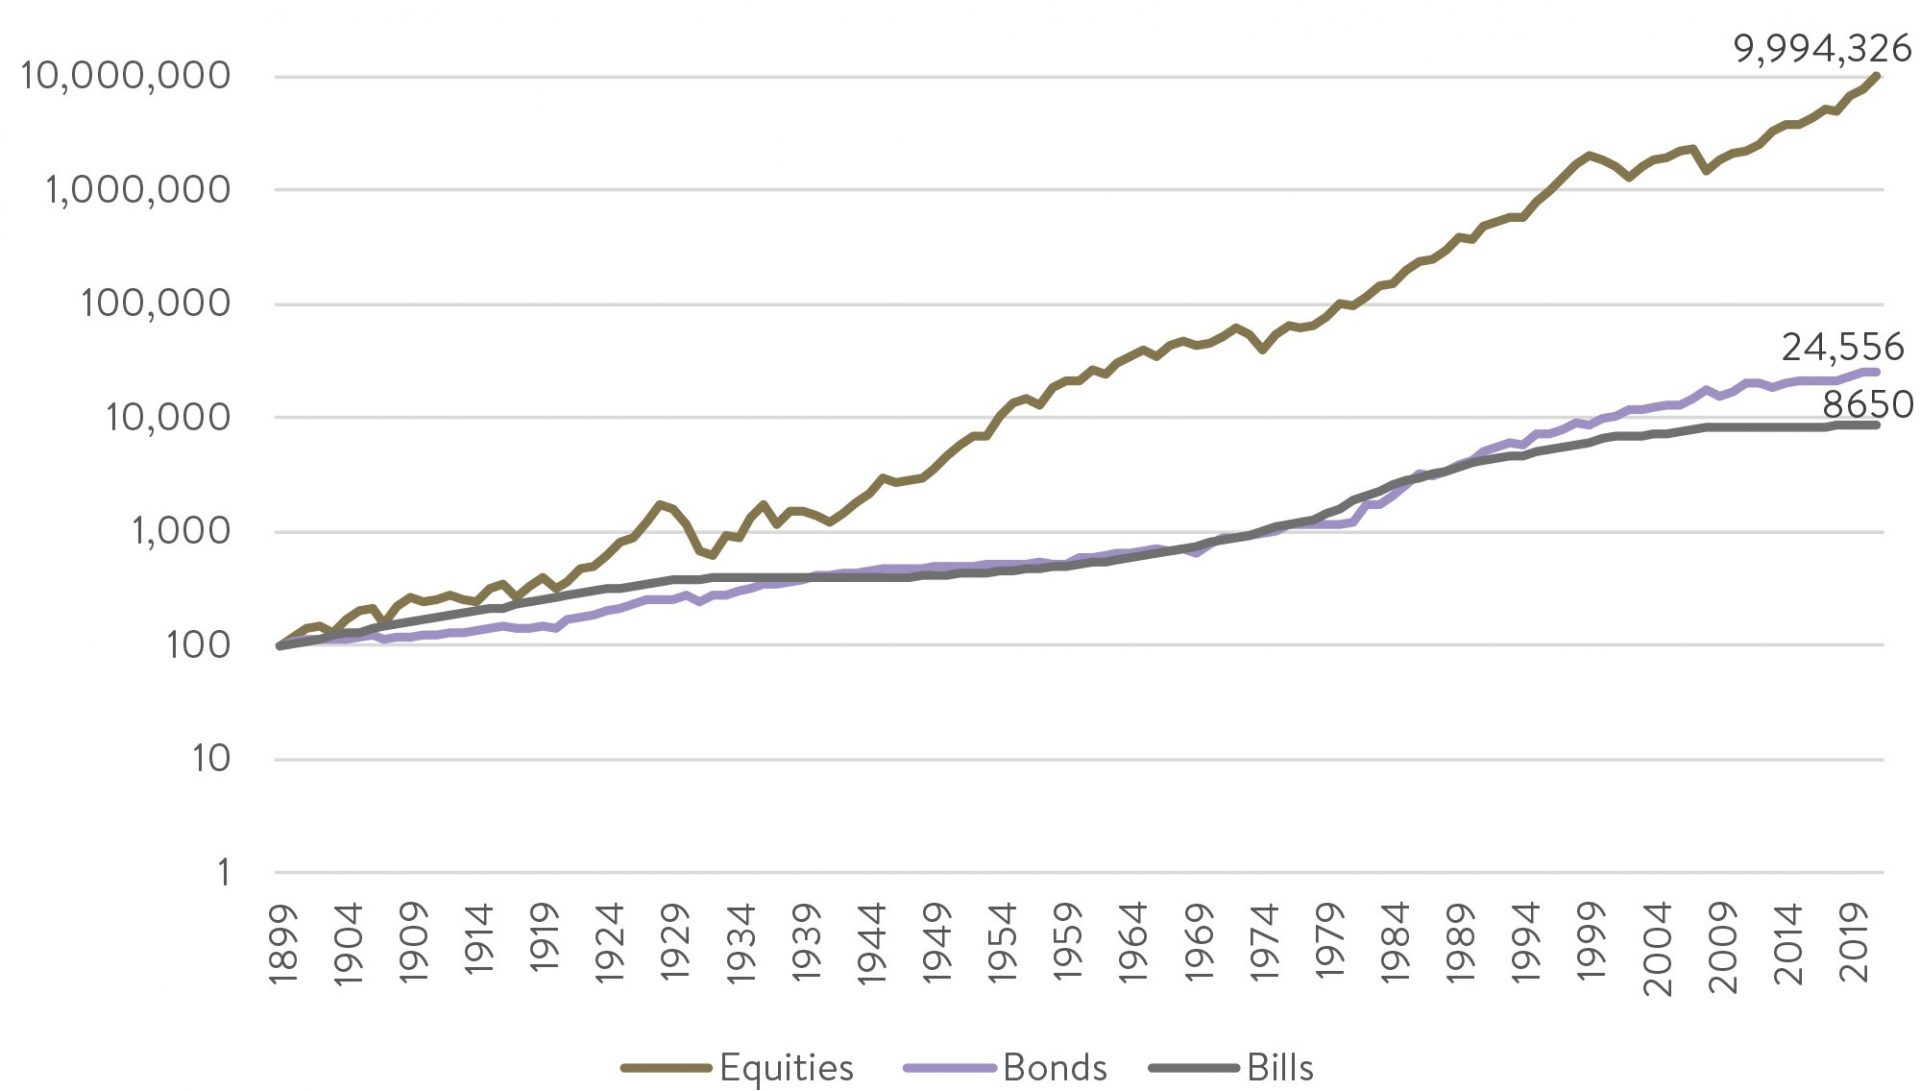
Below we show the growth of $100 invested in US shares, bonds and bills (a cash equivalent).
Unites States: Cumulative growth of $100
Source: FactSet, Cambridge Associates
We had to put this chart in ‘logarithmic’ mode on the vertical axis (it jumps by multiples of 10) so that you could even see the returns of bonds and bills next to equities such is the Grand Canyon-sized chasm between them. If the chart was plotted on a standard vertical scale, it would be almost impossible to even see the growth of the investment in bonds and bills they are so comparatively miniscule.
A $100 investment in bills made in 1899 would have grown to $8,650 by the end of 2021, while you would have made almost three times this ($24,556) if you had placed it in bonds. However, in another galaxy is equities at $9,994,326! Hard to believe but true, at more than 400x the dollar return of bonds over the last 122 years. The shorter-term risk of shares has been handsomely rewarded over the long term.
It’s hard not to think of the wealth that could be accumulated in equities over generations if only most people didn’t spend most of it during their lifetimes!
Now one word of warning with the above. The United States has been one of the best-performing share markets over the last 100+ years. Not every country has seen results as good. But of all the 23 countries that we have good data for going back to 1900, all have share markets that have very handsomely outperformed bonds, bills and inflation (Credit Suisse Global Investment Returns Yearbook 2022).
7. Shares may actually become safter than bonds … over the very long term
As mentioned, shares can be very volatile in the short term, but because of that volatility and risk of significant drawdowns, they tend to provide significantly higher long term returns than ‘safer’ bonds and bills.
But as shares get safer over the long term, through a reduced probability of providing negative returns, do they always remain riskier than bonds? Not necessarily.
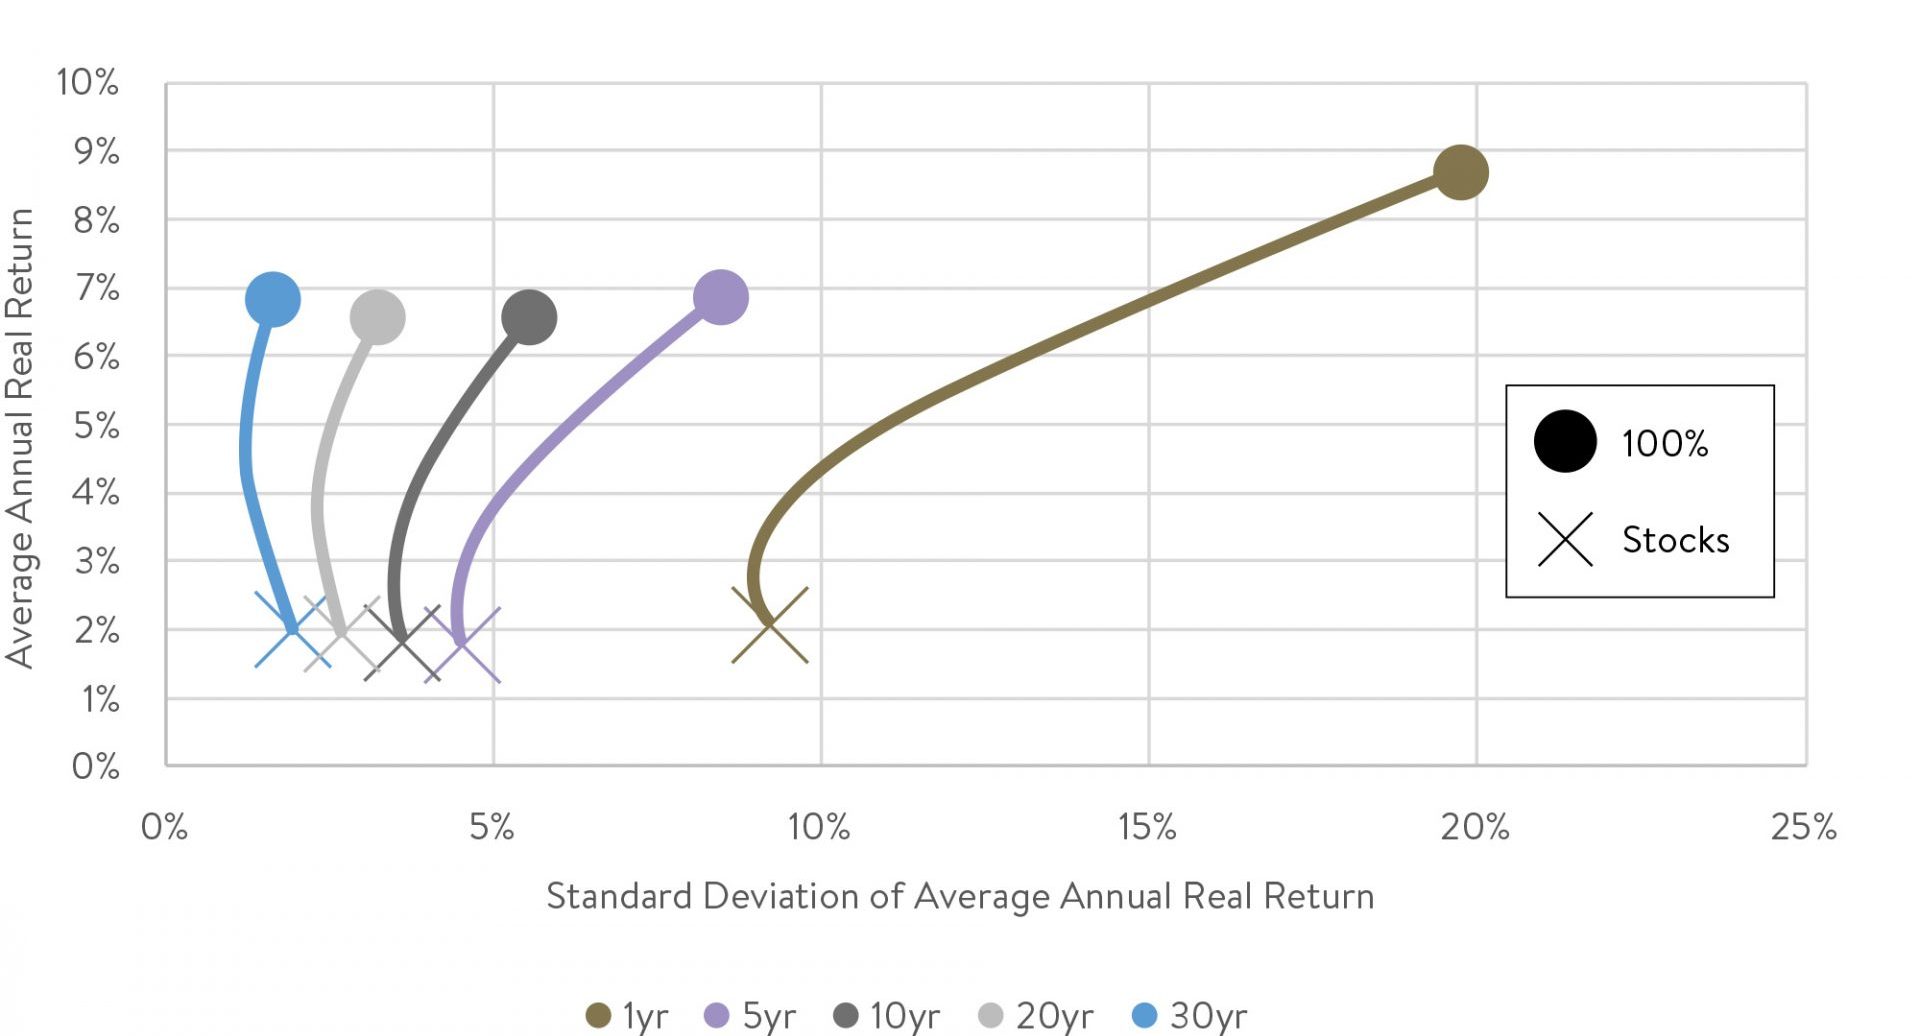
US Equities and Bonds: Risk-return trade-off for various holding period, 1900-2021
Source: Factset, Cambridge Associates
Above is close to our favourite investment chart of all time. A big call I know. But understanding the chart will be worth the effort.
It shows the average real (after inflation) returns for portfolio mixes of US shares and US bonds on the vertical axis over different holding periods since 1900. What you can see is that portfolios made up of 100% stocks have average annual real returns well above those comprised of 100% bonds over all holding periods.
This first part shouldn’t be a surprise. Stocks tend to do better than bonds on average, no matter what period you hold them for. It also shows that as you add more bonds to the mix, going from a 100% stock portfolio closer to a 100% bond portfolio by moving down each line, your returns tend to get lower. Again, this should make sense.
What we have shown on the horizontal axis is the range of outcomes historically around the average real return of each portfolio, as measured by that great stat we all learned about in year 10 at school: standard deviation. It shows that for holding periods of just one year, a 100% stock portfolio is very risky with a large standard deviation and therefore a wide range of outcomes around its average. Over a one-year holding period, though, as you add bonds to the portfolio, the return tends to go down on average but so does the range of outcomes around that average.
As your holding period increases to five years and eventually to 30 years, the range of outcomes (standard deviation) decrease dramatically, particularly for the 100% stock portfolios. And when you get to 30-year holding periods (a common investment horizon for most over their lifetime), nirvana happens. Historically at least, US shares have provided higher returns AND lower risk than US bonds! Incredible.
Before you dismiss this as a US share market anomaly, this outcome also holds for the Australian share market.
As investors raise their investment horizon to the longer term, risk to real stock returns dramatically decreases and approximates or may even become less than bonds. This suggests that investors over long horizons may be able to be more confident of the purchasing power of a diversified stock portfolio than they are of a diversified government bond portfolio.
To the victor go the spoils if only investors can resist getting worried out of the short-term volatility of shares. As Buffett once wisely said: “The share market is a device for transferring money from the impatient to the patient”.
No risk, no reward.
In sum, volatility and drawdowns are the price you pay for higher returns from shares over the long term. You genuinely can’t have the sweet without the sour. That is not to say risk management to minimise drawdowns and permanent loss of capital are not worthy or valuable endeavours – they are highly valuable. But expectations must be realistic about what these practices can achieve – they are not a cure all for avoiding declines in value when markets fall.
At Ophir, we see volatility and market falls as the friend of the long-term high-quality active manager. It is always painful whilst you are going through it, but ultimately it is a necessary ingredient for shares to outperform over the long term and for active managers, such as ourselves, to be able to stand the chance of beating the markets over time.