18 Nov, 2024

How will Trump’s epic win affect the share market?

Investment Strategy • 5 mins read

Back to Insights Back to Insights

🡣 Download PDF


On the 5th of November 2024, U.S. voters resoundingly elected Donald Trump as the nation’s 47th President.

New governments inevitably bring about change. In most instances new policies are forgotten and business continues as before.

Yet sometimes a new government can attempt radical reform – such as the repeal of the Glass Steagall Act or the implementation of the Affordable Care Act (Obamacare) – that may require a total reassessment of the opportunities and risks facing listed companies.

Not only has Trump won the Presidency, but the Republican Party appears on track to control both the House and Senate. A clean sweep could pave the way for Trump to implement radical reform and upend the outlook.

In the lead-up to the election, the tightness of the race resulted in some market swings as the probabilities of outcomes shifted between candidates, but overall, markets didn’t see a significant amount of volatility. However, since the election, the Trump trade has been well and truly on.

Source: Ophir, Bloomberg.

But do elections really alter the fortunes of equities, particularly when the governing party changes? And should investors be concerned about the potential impact of the Trump victory on the stock market and other markets?

The impact of elections on equities

We looked at how the S&P500 Index traded through each U.S election since 1960. The period covers 16 elections, with nine Democrat wins and seven Republican victories.

As you can see, on average, the S&P500 rose 10.2% in the first twelve months following a U.S. election. When the government changed hands, the increase in the S&P500 was less material at 6.0%.

Interestingly, in the first year following a Democratic win, the S&P500 index has generated stronger returns than a Republican win. This may sound counter-intuitive, as conventional wisdom suggests Republicans are better for markets given their pro-business stance.

Source: Ophir, Bloomberg.

As we look deeper into the data, the return profiles following elections since 1984 have been more attractive, with the same Democrats vs Republican trends holding true.

Source: Ophir, Bloomberg.

Presidential performances

Typically, a change in government is good for U.S. equities, which can be seen in the chart below.

However, individual terms and specifically the first year following an election can be heavily influenced by idiosyncratic factors that aren’t necessarily linked to the governing party:

  • Bill Clinton’s two terms in office saw the fastest market rally. The S&P500 gained of 203% over eight years. The rally was fuelled by the repeal of the Glass-Steagall Act, which allowed commercial and investment banks to merge and expand financial product offerings.
  • During Barak Obama’s term the S&P gained 148% gain in a post-GFC rally. Had the financial crisis occurred during Obama’s tenure (instead of just before), it would have weighed down the market returns through his term.
  • Under Ronald Reagan, the market rose 105% with the Black Monday crash of 1987 causing the underperformance.
  • The Iraq war and the September 11 attacks dragged the market down 32% under Bush Jr.

What policies is Trump looking to implement?

Now that Trump has won the presidency and likely both chambers of Congress, he has a platform to enact sweeping and impactful change.

Trump plans include, but are not limited to:

  • Reduced Corporate tax rates
  • Reduced personal taxes through reduced social security taxes, no tax on tipped income or overtime pay as well as reductions for first responders and military.
  • Increased tariffs, particularly on China.
  • Propping-up fossil fuel industries, particularly oil and gas.
  • Potential deportation of unauthorised immigrants.
  • Mixed outcomes on defence with a potential pull back from Ukraine and Europe more broadly, but a likely redirection towards China.
  • Building a U.S. Strategic Bitcoin Reserve of 1 million Bitcoin over the next 5 years.

Resulting from these policies we could see:

  • Upward pressure on inflation, reducing the rate in which the Federal Reserve will cut rates.
  • A strengthening in the U.S. Dollar as higher rates makes the U.S. relatively more attractive for investors seeking higher yields.
  • Deregulation will benefit sectors including financial services, technology and fossil fuels. The Trump campaign, for example, promised to reduce environmental protection and expand U.S. energy production (oil and gas drilling).
  • Ongoing support for cryptocurrency markets

How will Trump’s victory impact small caps?

As highlighted above, markets reacted positively to the Trump Presidency with the S&P500 up 3.5% and the Rusell 2000 up 5.8% in the week since the election.

Michael Kantrowitz at Piper Sandler and Co points out this is the fourth time small caps have seen an outperformance spike compared to large caps more recently. This has been driven by multiple expansion, with the market pricing in a better outlook for growth and earnings.

Source: Piper Sandler & Co, November 2024

So why do we think this time is different to the last three?

Given the protectionist nature of Trump policies, this should support U.S. companies who operate domestically. By their nature this tends to favour smaller companies that haven’t yet grown enough to justify offshore expansion.

While increased inflationary pressures from Trump’s policy agenda could impact the profit margins of smaller companies, this will likely coincide with an improved growth outlook. Against this backdrop, we believe strong top-line trends could drive upwards EPS revisions across the Russell 2000. Should this transpire, it could act as the catalyst for the significant valuation gap between large and small caps to begin to close.

At Ophir we focus on businesses with resilient earnings that can perform throughout market cycles. Our positioning remains a mix of cyclical and defensive names, and we have high conviction that our Funds will perform through the market cycle.

Previous

17 Oct, 2024 Letter To Investors - September

Next

18 Nov, 2024 Letter To Investors - October
17 Oct, 2024

Should investors be joining the gold rush?

Investment Strategy • 6 mins read

Back to Insights Back to Insights

Gold has been grabbing headlines. You would most probably have seen the precious metal has surged to all-time highs. And gold bars have cracked US$1 million for the first time ever this year.*

*Gold bars typically weigh 400 troy ounces and the gold price surpassed US$2,500 for the first time ever in August this year.

In Australia, gold miners now make up 7.6% of the ASX Small Ords Index – making it a key player in the local investment landscape.

But should investors be joining this gold rush and increasing their exposure?

In this month’s Strategy Note, we explore gold’s history and what is driving the gold price today. And, importantly, we look at how at Ophir we are gaining exposure to surging gold prices while remaining true to our core investment philosophy.


Gold versus Equities

From 1971 to the early 2000s, the gold price had been relatively stable. Gold was, for the longest time, considered a hedge against inflation, economic shocks and currency devaluation.

Then gold soared in 2003 in the lead up to the Iraq war as investors used the commodity as a safe-haven asset. (By coincidence, the first gold ETF was launched in 2003 on the ASX).

All up, since the decoupling of the gold standard in 1971, the gold price has increased from US$43 to US$2,642 per troy ounce at time of writing.

On the face of it, this appears to be a good investment. But the return from gold has been meagre when compared to equities. From 1971 to now, while gold has returned 5,977%, the S&P 500 has delivered a return of 24,472%.


Gold’s Relationship with Real Yields

So why has gold gone up at all?

There is no simple answer.

There is an element of basic supply and demand at work. Gold is a physical asset with a finite supply, so less supply over time should cause an uplift in its price. Similarly, any boost in demand should also see its price rise.

(ETFs have provided easier access to the commodity, so this would also have helped increase demand.)

Another driver has been real yields – the nominal bond yield minus inflation.

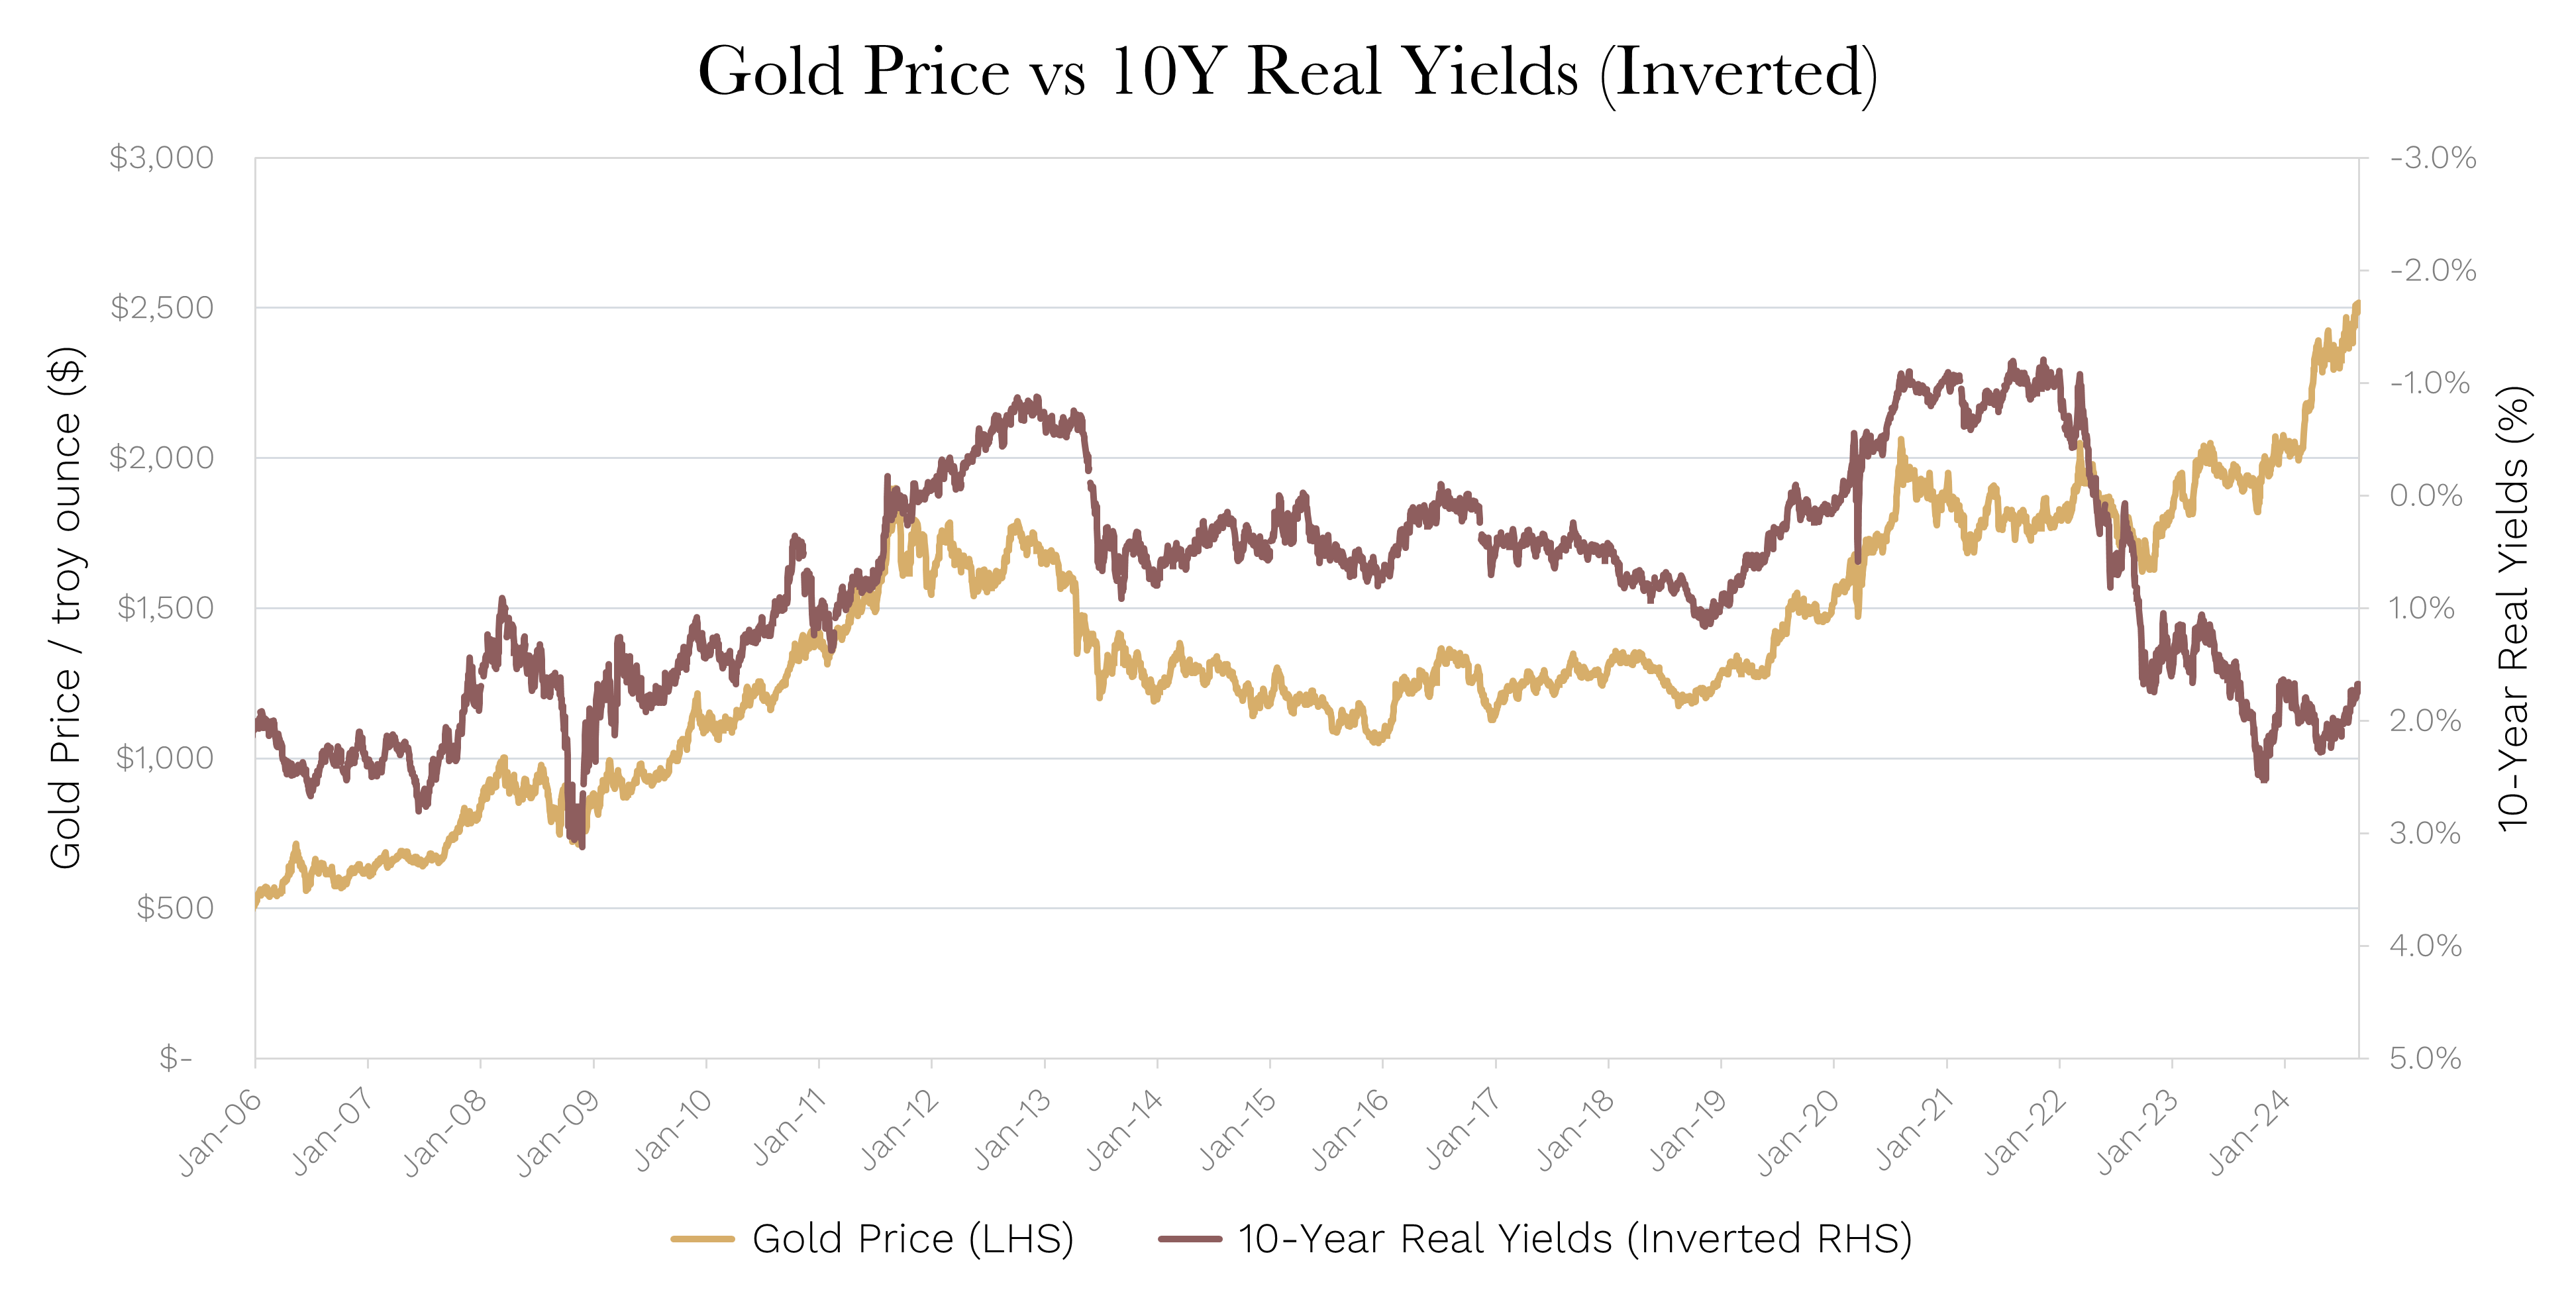
Historically, at least most of the last two decades, gold has been inversely correlated to real yields.

When real yields are trending higher, and fixed income investments provide adequate income to beat inflation, the gold price has decreased because it becomes relatively less attractive as a non-yielding asset. When real yields are falling, the gold price tends to increase because those real yields become less attractive.


Source: Ophir. Bloomberg.

This inverse correlation is not perfect but has remained consistent over time.


Why the relationship fell apart

But wait – why has gold pushed higher in recent times when real yields are increasing?

If correlations had held, shouldn’t the gold price have been trending lower over the last two years?

Has the relationship changed?

From 2022 through 2023, it appears three things have all taken turns in pushing the gold price higher, despite the surge in real yields:

  1. Firstly, the Russia-Ukraine war in early 2022 seemed to increase gold’s attraction as a safe haven.
  2. Then the rise in inflation expectations throughout 2022 seemed to see more investors buy gold as an inflation hedge.
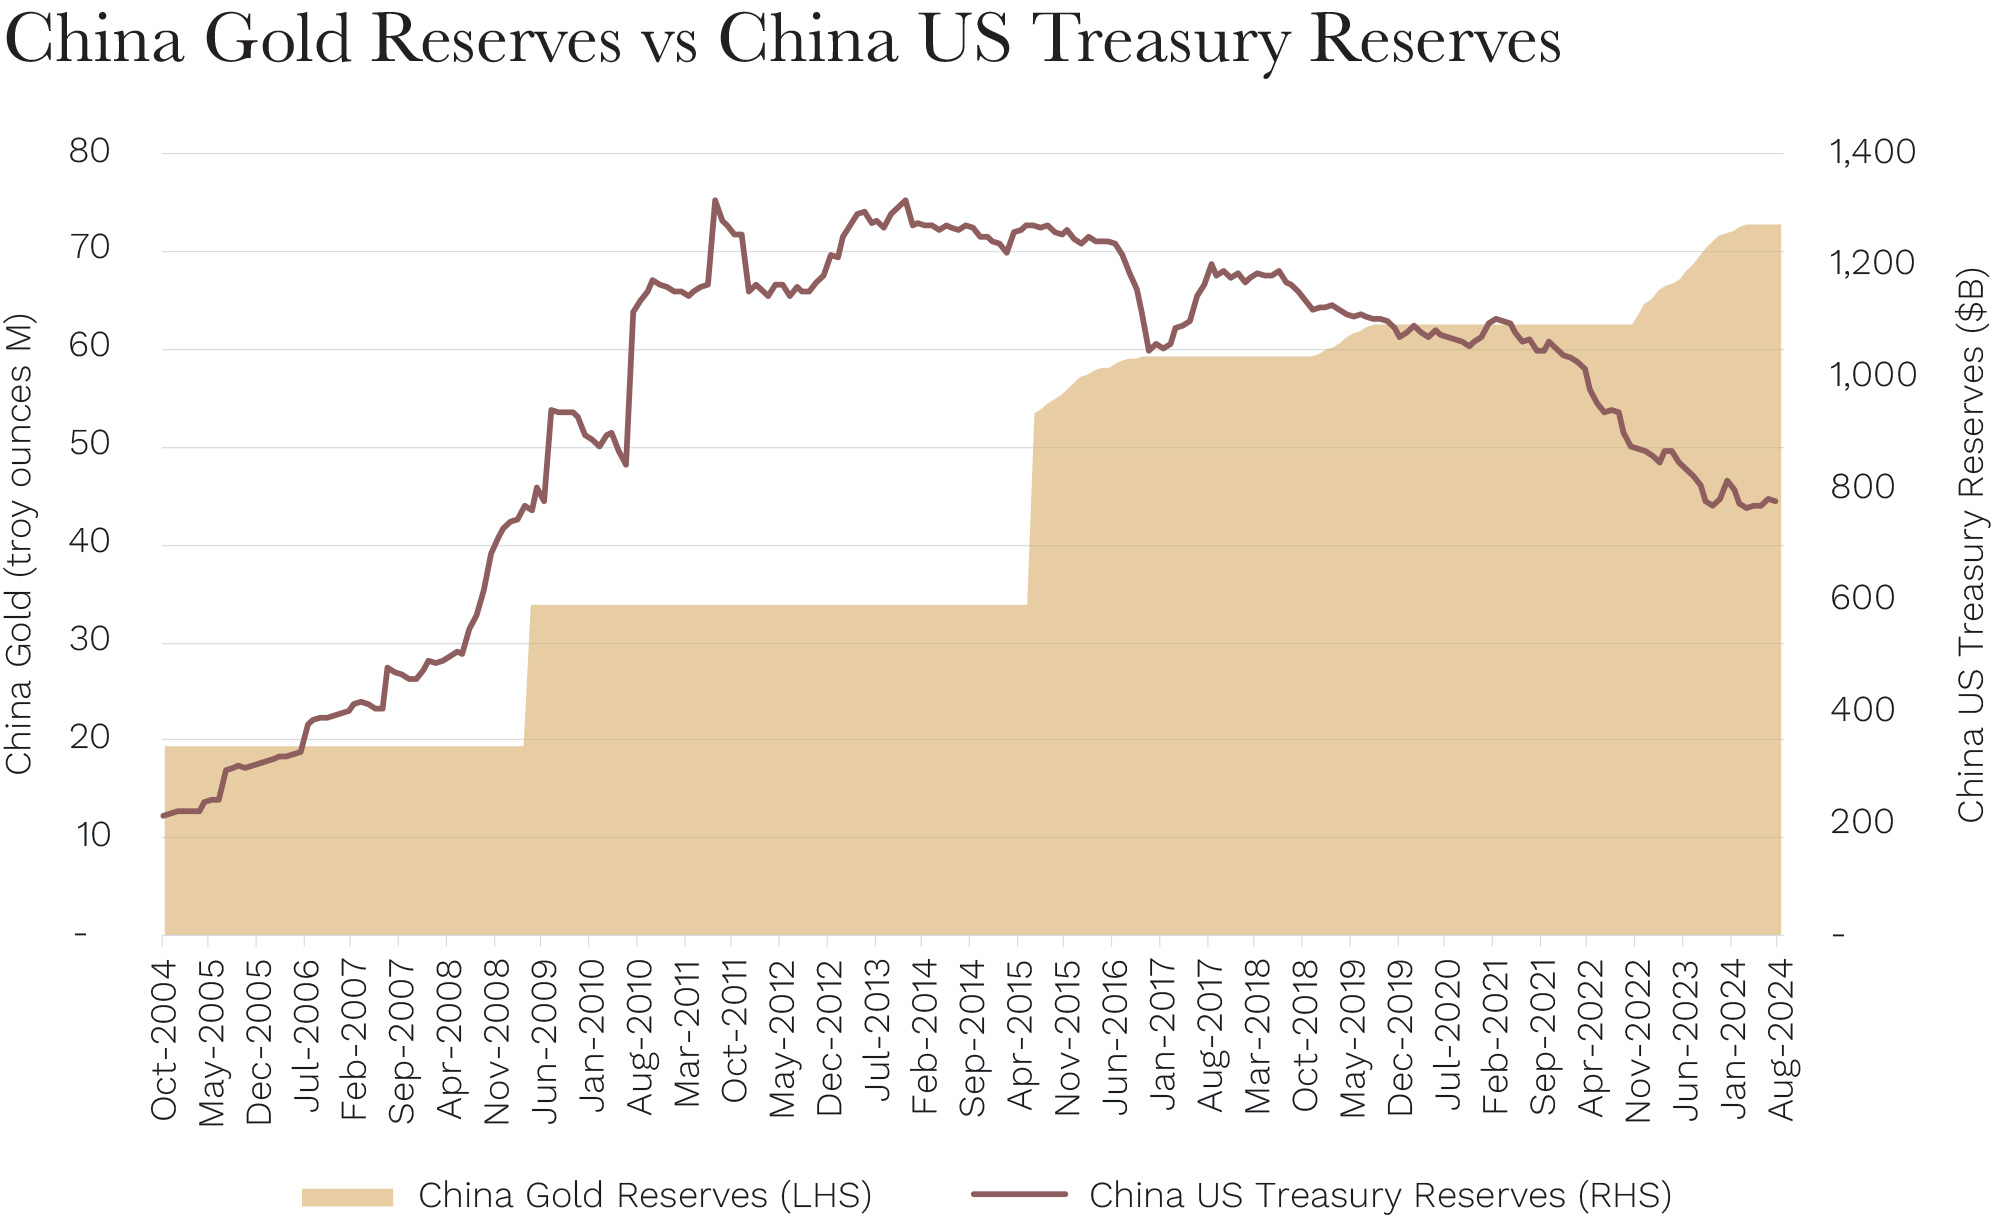
  3. And, finally, as the US dollar depreciated through late 2022 and 2023 it increased the attractiveness of gold, which is priced in US dollars, to foreign buyers. One such buyer has been central banks which, according to the World Gold Council, purchased more than 1,000 tonnes of gold in 2022, more than two times the annual average of the previous five years. For example, China has been reducing their US Treasury bond holdings while increasing their gold reserves. India is also increasing their gold reserves at an increasing rate.


Source: Ophir. Bloomberg.


A return to normal

Since late 2023, when the US Federal Reserve signalled they were done hiking interest rates and that rate cuts were on the cards for 2024, real yields have started falling again.

History suggests that during rate-cutting cycles the negative relationship between real yields and the gold price tends to strengthen.

And that is what we have seen since late 2023: real yields have fallen and the gold price has continued to surge to new all-time highs.

Where it goes from here is anyone’s guess. But if you expect real yields to continuing falling back to their longer term average of around 1.5%, then there still may be a little upside to the gold price left near term.


Backing the manager: How Ophir invests in gold

To paraphrase Warren Buffett – “[gold] won’t do anything … except look at you”.

We have a similar sentiment at Ophir: That gold itself is not a worthwhile investment because it is a non-yielding asset and has no cashflows.

However, over the years Ophir has invested in the gold space and done reasonably well.

But we do not invest in gold itself. Instead, we invest in good miners who run gold mines efficiently and economically with strong cashflows following.

As with other non-mining companies, we look for gold producers that will beat on earnings and raise guidance for their next results.

We have built up expertise in Australia of identifying the best mining – and in this case gold mining – managers and management teams.

For us, it’s more of a case of backing the jockey (management), rather than the horse (the specific commodity). We expect these jockeys to have their expertise result in higher cash flows over times, despite the natural cyclicality of the underlying commodities they are leveraged to.

Backing the jockey works particularly well for the gold sector as their capital bases are smaller compared to other commodities so that you can buy an old mine and turn it around pretty quickly. Contrast this to an iron ore mine that needs billions in capex to make a difference.

The sales and marketing effort for gold is also MUCH easier. One of our old investing mentors used to say all you need to do is charter a plane, put the gold bars in it and fly to a major city and that was the extent of your sales effort!  Compare that with the comparative logistical complexity of rail, ports, shipping and the like to get iron ore to its destination.

Historically, in the gold sector, we have invested in Bill Beament when he ran Northern Star (now at Develop Global). And we currently invest in a number of high-quality gold miners, including Luke Creagh at Ora Banda.

So despite typically being underweight the Materials sector in our Australian funds, where it is a big part of the index, we haven’t shied away from the sector and have made some great money for our investors by sticking with a few first-rate managers.

But we leave it to the likes of Ora Banda and its gold experts to make short-term decisions based on the commodity price. And we invest in the strategic nous of management and the operational effectiveness of the business over the longer term – just as we would in any other sector.

Previous

18 Sep, 2024 Letter To Investors - August

Next

17 Oct, 2024 Letter To Investors - September
18 Sep, 2024

Is your fund manager skilful or just lucky?

Investment Strategy • 8 mins read

Back to Insights Back to Insights

There is no doubt in the world of sport that the likes of 20-time tennis Grand Slam winner Roger Federer outperforms because of skill, not luck. When investors evaluate the performance of equity funds, however, it’s not as obvious which funds are skilled or have just been lucky.

Fund manager league tables were recently released for the last financial year, and the media, as usual, trumpeted funds with hot performance.

But now is a particularly difficult time for investors to assess fund managers. With markets rising, some funds have just been lucky and ridden strong gains. There is now a danger that investors chase these hot, lucky funds and become saddled with poorly performing investments for years.

In this article we outline how investors can try to tell which funds managers have ‘skill’ – and can be expected to keep outperforming for a long time — and those that are simply ‘lucky’ and likely to disappoint when markets change.

If investors can spot the difference, they are significantly more likely to choose the right fund for them, a fund that delivers sustained performance, and a fund that ultimately helps them reach their financial and lifestyle goals.

The skilled few

The big problem for investors is that few funds are truly skilled.

In a 2014 report on equity investing, Willis Towers Watson, the global investment consulting firm, argued that only 10 per cent of fund managers could be considered genuinely skilled over the long term, while 70 per cent show mediocre performance and 20 per cent are inferior.

The fact that so few managers were deemed truly talented is a product of the multiple forces which influence portfolio performance, such as:

  • Being lucky
  • Gambling on high-risk stocks during a rising market
  • Having exposure to the right investment style at the right time
  • Taking on hidden risks like selling put options
  • Being skilled

Obviously, managers that perform via the first four should be avoided. But how can we tell who has the right qualities to be considered genuinely talented managers?

4 attributes of the skilled

Although no specific rule book exists on how this should be judged, we believe that skilled investors have four characteristics in common.

1. They perform through time

The number one attribute of skilled investment managers is their performance over time. By studying this, we can observe if performance has aligned with their intended investment style. For example, if they are a “Growth” style manager have they tended to perform well when that style is in favour? If they are an “all -weather” manager, have they been able to perform well through all different kinds of market environments? We can also measure how persistent returns have been across different stages of the market cycle.

2. They have a high number of winning bets

One should also study the number of bets made over time. A manager who makes many bets over time, and wins a reasonable number of them, deserves to be rated far higher than a manager whose success is solely attributable to one or two knockouts. The former manager has been tested more times, and hence we can be more confident in their ability to replicate that success in the future.

3. They are on a quest for “better”

Besides just looking at each manager’s track record of returns, those with skill at investing have an attitude to their craft that combines intensity, flexibility, and humility. These managers have a passion for investing and are constantly striving to put in the work to become more skilled investors.

4. They accept the role of chance

At the same time, best-in-class investors are aware of the role of chance in their investment outcomes and don’t try to paint their success as pre-ordained. By contrast, fund managers who don’t realise how much chance impacts their results can end up being painfully stubborn or arrogant. And when the environmental variables that help outperformance eventually stop, a humble manager is more likely to adapt and evolve their process commensurately.

The harsh reality is that even a skilled investment manager will underperform at times, and an unskilled manager can outperform, potentially even for years. Still, the longer the period over which a given investment manager delivers superior performance, and the larger the investment base involved, the more likely the results reflect skill rather than luck. To put this another way, over time as an investor becomes more skilful, their performance should become more consistent.

Like medical research

So how do professional fund manager selectors statistically test whether a fund manager’s performance is truly different from their benchmark, or the market?

They perform tests similar to the type medical researchers use to test whether a drug’s treatment of a condition is statistically different from a placebo.

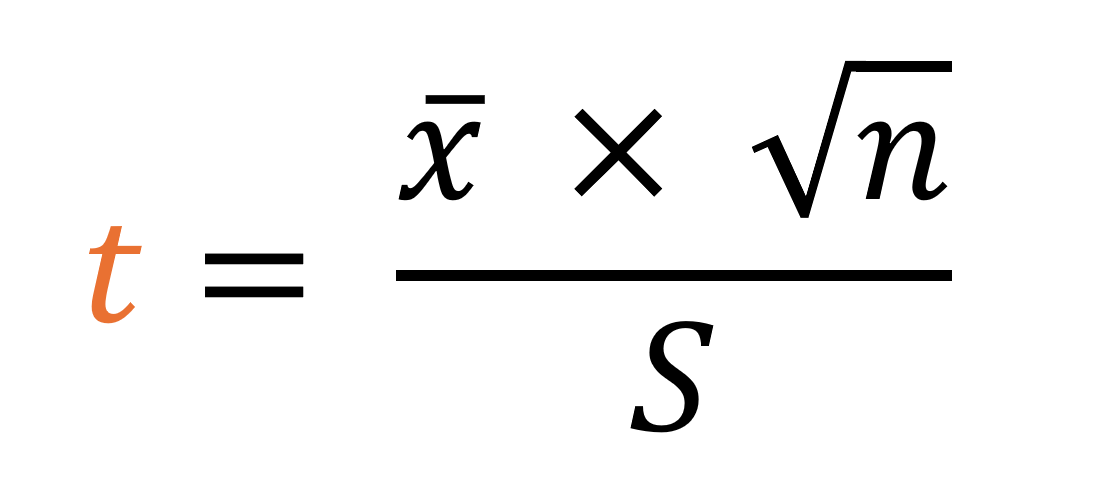
A simplified example of this test is below:

Where:

T = the so-called ‘test statistic’

X = is a measure of the outperformance (if positive) or underperformance (if negative) of the fund versus the benchmark

N = is a measure of how long the fund has been going for

S = is a measure of the volatility of the outperformance or underperformance of the manager through time

A ‘test statistic’ greater than about 2 means you have 95%+ confidence that the manager’s outperformance or underperformance is different to zero. This level of confidence is the most commonly used to determine if something is truly different from its comparator or baseline.

3 takeaways

What you can quickly see is that both the greater the size of the outperformance and the longer the manager’s track record are both positive attributes. Also, the lower the volatility of the outperformance, the more likely that outperformance is ‘statistically significant’ (different to zero) and due to skill rather than luck.

Some takeaways from this are:

  1. You should pay less attention to 12-month returns reported by the press in the newspaper because returns this short have a greater potential to be due to luck, rather than 3, 5 or 10-year returns.
  2. The larger the outperformance, the more likely this is to be due to skill, which can sometimes make up for a short track record. A word of warning though on this one: It is a good idea to test whether a manager has simply been ‘punting’ the fund and has made a big lottery-type payoff on one, or a small number of bets, or whether it is due to a broader series of unrelated investments.
  3. Smaller, consistent outperformance may potentially be more likely to be due to skill than large, but volatile outperformance. There is a trade-off here.

Secretly skewing to small caps

More sophisticated statistical tests also exist to help ensure managers aren’t simply outperforming by taking more risk than is embedded in the benchmark or market they are trying to outperform. A manager, for example, might claim outperformance during a bull market, but they only outperformed because they used leverage in their fund to increase its risk, and hence returns, in that market environment.

Finally, we need to question whether a fund’s investment returns represent exposure that could be obtained at a much lower cost by investing through passive-type products. In such instances, there is no need to pay fees to a skilful investment manager to access these returns.

For example, small-cap equities, which is our space, have tended to outperform large-caps across many different equity markets over long periods of time. Investors should turn their nose up at large-cap managers who skew their funds to small caps, and where their small cap holdings have accounted for a meaningful share of their outperformance over their large-cap benchmarks.

Sorting the skilled from the plain lucky

To summarise, it is clear there is much to think about when trying to determine whether a manager’s returns have been due to skill rather than luck.

Hopefully we have dissuaded you though from putting too much weight on a manager’s short term annual returns reported in the so-called ‘leagues tables’ in the press!

At Ophir we judge the performance of our funds, and our analysts who contribute to it, primarily on its size, duration, consistency, and number of unrelated positions that have led to the result. We also seek to control for excessive risks that could jeopardise absolute performance over the long run.

As long-time readers will know, we think there are two other key criteria that help the skill of any manager shine through:

  1. Alignment: nothing focuses your mind and skills like having your own money on the line when investing. As Charlie Munger has said: “Show me the incentive and I’ll show you the outcome”. Having a significant percentage of your own wealth at risk we believe increases the incentive to perform well.
  2. Capacity constraints: Size kills performance. Managing a lot of money is hard – it can impact your nimbleness and force you to operate in more efficient markets that are more difficult to outperform in. As Warren Buffett has said: “Anyone who says that size does not hurt investment performance is selling”. A skilled manager who has been outperforming for years can quickly turn into an apparently unskilled manager whose performance drops off when they start managing a lot more money.

There are of course many other factors to consider as well when trying to disentangle the skilled from the unskilled, but the above is what we consider to be some of the most important here at Ophir.

Previous

23 Aug, 2024 Letter To Investors - July

Next

18 Sep, 2024 Letter To Investors - August
17 Jun, 2024

LIC/LIT big discounts – Permanent purgatory or rate cut relief ahead?

Investment Strategy • 7 mins read

Back to Insights Back to Insights

Australian Foundation Investment Company (AFIC) is the largest Listed Investment Company (LIC) or Trust (LIT) on the ASX, with a market cap of around A$9 billion. It’s also the most liquid and oldest (listed in 1936!).

The fund has an enviable, very-long-term outperformance track record.

Since the late 1980s, AFIC has traded on an average premium to Net Tangible Assets (NTA) of +1.8%. That premium reached nearly +20% in 2022.

Yet AFIC now trades at a 7 to 7.5% discount to NTA,  putting it in the lowest 5-10% of its discount-premium range in AFIC’s history.

So, what gives? Why such a historically big discount? And what does that mean for the outlook for other listed funds, such as our own Ophir High Conviction Fund’s LIT (ASX:OPH)?

An alternative explanation

Investors give several reasons for LIC & LIT premiums and discounts, including:

  1. Supply and demand
  2. Size of the LIC or LIT
  3. Liquidity of the fund
  4. Investor sentiment
  5. Market direction
  6. Investment performance

But so many of these reasons fail to explain AFIC’s historically large discount.

AFIC is a large, liquid fund, with good recent one and five year performance. The Australian large-cap dominated index (ASX200) is within a whisker of all-time highs, so we have a fairly bullish market.

What else could explain AFIC’s historically high discount?

We think it’s interest rates.

Below, you can see the premium and discount of AFIC on a monthly (orange line), and six-month moving average basis (black line), since the early 1990s.

We have added a red line, which is the average of the US Federal Reserve’s Fed Fund Rate and the Reserve Bank of Australia’s Cash Rate, inverted.

LIC/LIT premiums/discounts move with rate hikes/cuts

Source: Bloomberg

It’s clear: lower interest rates (a higher red line) have been associated with higher premiums to NTA … and higher interest rates (a lower red line) have been associated with higher discounts to NTA.

Managing OPH’s big discount

Our Ophir High Conviction Fund (ASX:OPH) has been listed on the ASX as a LIT since late 2018.

It has traded as high as a +20% premium, and as low as an -18% discount to NTA. Overall, it has traded close to par with an average discount of -2.2%.

However, like AFIC, it currently trades at a larger-than-average discount, in OPH’s case circa -11% at writing.

We, of course, are working hard to help manage the discount, including:

  1. Enhanced marketing to make investors aware of the value on offer to investors if they buy the fund at a discount, particularly given it has an attractive +13.1% (net) p.a. NAV investment total return since inception in 2015, versus its benchmark of +9.1% p.a.;
  2. Signalling to investors the value we see on offer through us (Andrew and Steven) personally buying units in the Fund recently; and
  3. Using the buyback mechanism to buy OPH units in the Fund when we see compelling value on offer.

We have used all three of these since the Fund was listed.

Do interest rates affect discount/premiums for the broader pool of LIC/LITs?

It’s important, however, to understand whether other factors that are out of our control, such as interest rates, influence the cyclical nature of the premium and discount for OPH.

OPH has only been listed for a little over five years, so we need to look to longer-running LIC/LITs to see if our ‘rates relationship’ hypothesis holds, and not just for AFIC.

The evidence strongly suggests it does hold.

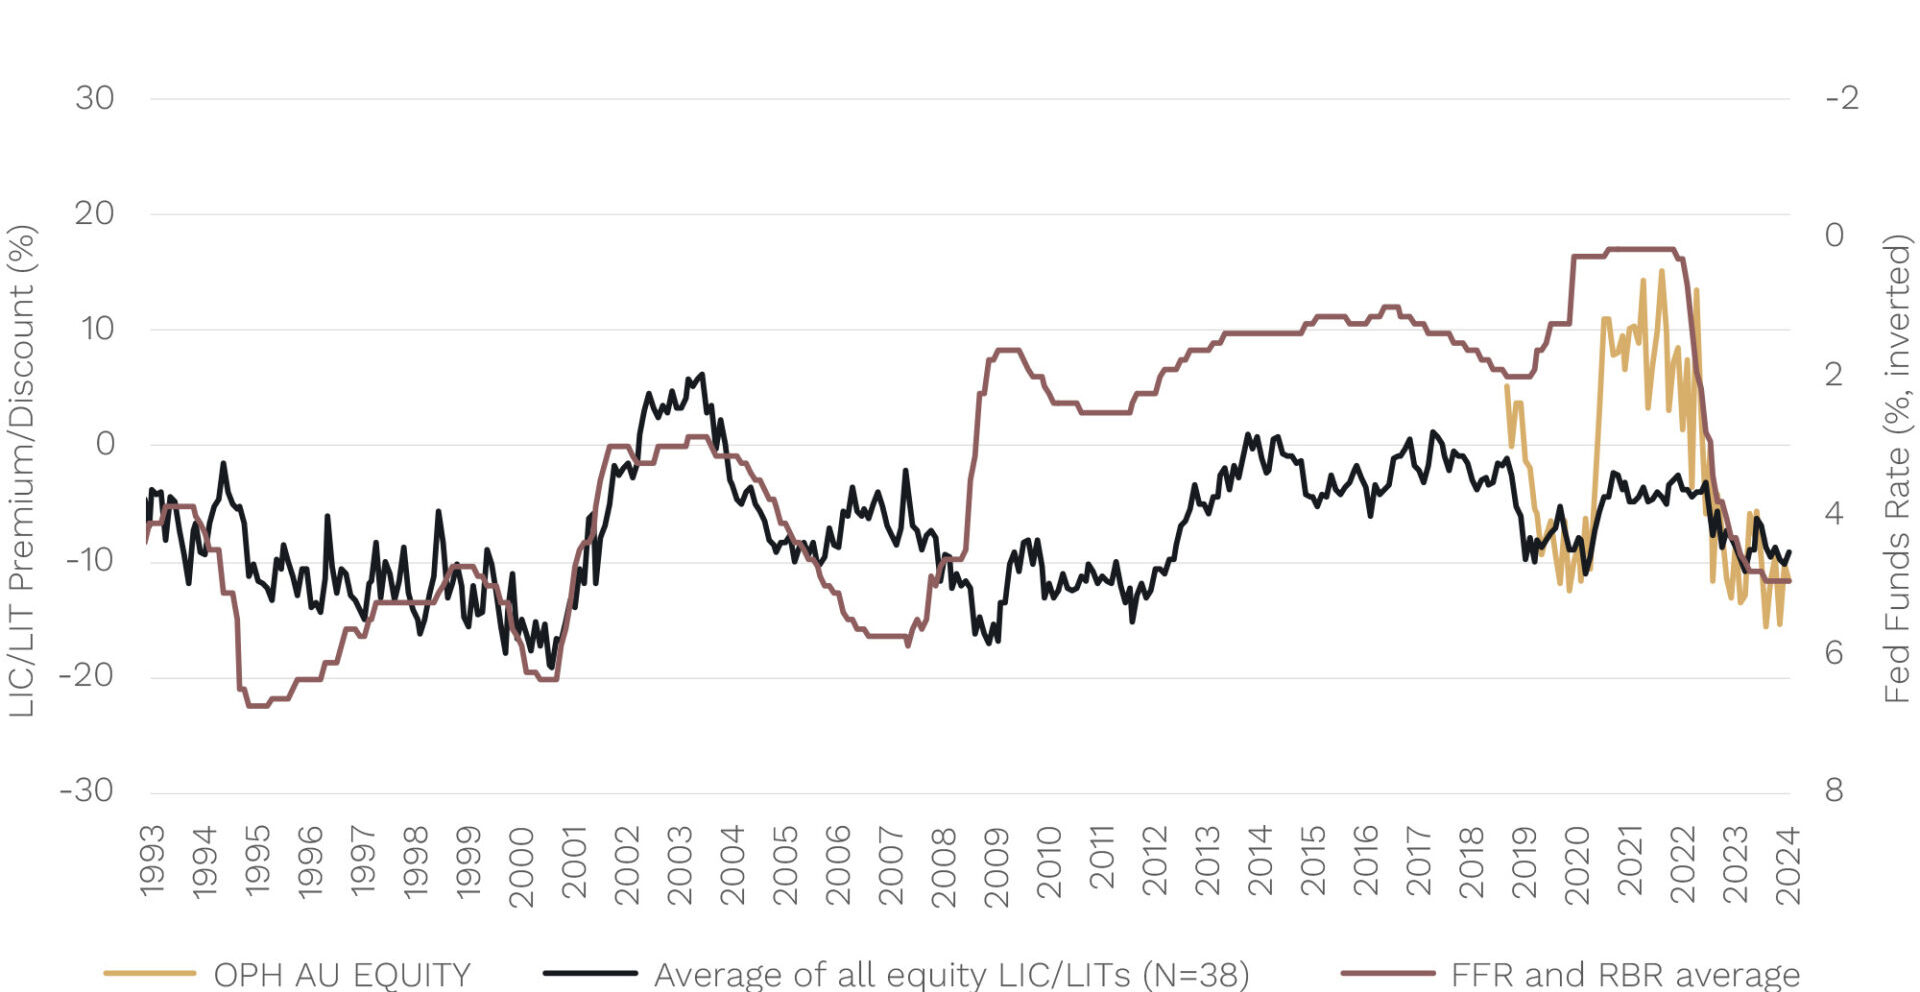
Below, we show the relationship between interest rates and the 38 long only Australian and Global Equity LIC and LITs on the ASX. Though not a perfect relationship, the black line – the average premium or discount on these funds – has broadly moved inversely with interest rates in both the US and Australia[1].

LIC/LIT premiums/discounts move with rate hikes/cuts

Source: Bloomberg

Another way to view this is through the average and median premiums or discounts that have prevailed in the equity LIC/LIT market on the ASX for different Fed/RBA interest rate ranges. We show this below for all 38 equity LIC/LITs from the chart above:

Range for Average of Fed/RBA policy rate Average Premium/Discount Median Premium/Discount
0-2% -4.6 -3.8
2-4% -6.0 -6.9
4-6% -8.3 -8.8
6-8% -12.4 -11.8

Source: Bloomberg. Data since January 1992 and includes premium/discount history for 38 equity LIC/LITs on the ASX using history back to their inception dates.

While premiums are rarer on average for the full contingent of equity LIC and LITs, it is clear, larger discounts do tend to be associated with higher interest rates.

From TINA to TIARA

This is certainly the case today, with the Fed Funds Rate the highest since the year 2000 and the RBA Cash Rate the highest since 2011.

We think it’s fair to say that the highest interest rates seen in 10-20+ years in the US and Australia is weighing on LIC/LIT premiums and discounts. That’s because higher rates are likely providing an alternative investment to LIC/LITs for some investors, which is impacting demand.

Basically, we have shifted from an interest rate world of 0% during COVID in 2020 and 2021 where the ‘TINA’ (There Is No Alternative to equities) moniker was in play and many saw shares as the only investment choice to “TIARA” (There Is A Reasonable Alternative) where fixed income and even cash investments have become more attractive again.

The OPH premium and discount has not been immune, as you can see by the yellow line in the chart above.

In the chart below, we have zoomed into the period since OPH listed in December 2018.

LIC/LIT premiums/discounts move with rate hikes/cuts

Source: Bloomberg

It traded at a premium for a few months after listing, but then fell to a discount in 2019 following recent rate hikes in the US[2].

However, when the Fed and RBA cut rates in early 2020, in response to the outbreak of COVID, OPH shot back to a premium, and the average discount for equity LIC/LITs as a whole shrunk.

Later in early-to-mid 2022 both the Fed and RBA (along with other developed economy central banks) starting hiking interest rates in response to ‘sticky’ inflation pressures.

In some of the fastest rate hiking cycles seen in decades, the OPH premium became a discount, and the average LIC/LIT market discount also began to widen again.

Springtime for LIC/LITs?

So where to from here?

We have made the case that LIC/LIT premiums and discounts in general across the market tend to be cyclical. And that cycle is heavily influenced by the direction and level of interest rates. Rates are by no means the only factor, and other factors can be more meaningful for individual LIC/LITs.

But if history is any guide, interest rate cuts are likely to be a catalyst for LIC/LIT discounts to shrink in general and premiums to widen.

Which begs the question: when is the rate-cutting cycle currently forecast by markets likely to start?

Currently, there is a greater-than-50% chance the Fed will start its cutting cycle in just over three months’ time in September. While for the RBA, rate cuts look likely to start in either very late 2024, or early 2025.

It has been a frosty winter for discounts for many LICs and LITs on the ASX in the last year or two.

But summer may be just around the corner.

[1] Policy interest rates in both the U.S. and Australia have broadly moved in line with each other since the early 1990s with coordinated hiking and cutting cyles. The exception is the U.S. Federal Reserve hiking cycle from late 2015 to late 2018 – a period over which the only change by the RBA was 0.5% of rate cuts over six months in 2016.

[2] Proposed franking credit changes by the Opposition Government in Australia in 2019 and arguably an oversupply of LIC/LITs to market also likely contributed to bigger discounts for LIC/LITs during this period.

Previous

15 May, 2024 Letter To Investors - April

Next

17 Jun, 2024 Letter To Investors - May