By Andrew Mitchell & Steven Ng
Co-founders and Senior Portfolio Managers
In this month’s Letter to Investors we analyse the impact that ripping bond yields has had specifically on small caps and how not all parts of the small cap market have been treated equally.
Welcome to the September Ophir Letter to Investors – thank you for investing alongside us for the long term.
Rates gravity gets markets down
As share markets pushed on from the July/August reporting season, they were looking for direction. They certainly found it courtesy of ripping bond yields.
The US 10-year treasury bond saw its yield surge from 4.10% to 4.57% over September. That’s the biggest monthly increase since it rose 0.64% in September last year.
There are likely many causes of long-term interest rates moving higher. They include:
- a high supply of government debt, given the size of the current US fiscal deficit that needs funding;
- a ballooning oil price; and
- resilient US economic growth.
The outcome for equity markets was like last September: a rout!
September 2023 Ophir Fund Performance
Before we jump into the letter in more detail, we have included below a summary of the performance of the Ophir Funds during September. Please click on the factsheets if you would like a more detailed summary of the performance of the relevant fund.
The Ophir Opportunities Fund returned -2.3% net of fees in September, outperforming its benchmark which returned -4.0%, and has delivered investors +20.8% p.a. post fees since inception (August 2012).
Download Ophir Opportunities Fund Factsheet
The Ophir High Conviction Fund (ASX:OPH) investment portfolio returned -4.2% net of fees in September, outperforming its benchmark which returned -4.3%, and has delivered investors +12.5% p.a. post fees since inception (August 2015). ASX:OPH provided a total return of -2.4% for the month.
Download Ophir High Conviction Fund Factsheet
The Ophir Global Opportunities returned -5.4% net of fees in September, underperforming its benchmark which returned -4.6%, and has delivered investors +12.4% p.a. post fees since inception (October 2018).
Download Ophir Global Opportunities Fund Factsheet
As bond yields rose (see dotted line in the chart below, inverted), they acted like gravity, crushing equity market valuations. A move higher in long-term interest rates reduces the present value of future cash flows that companies are predicted to make, lowering valuations. The biggest falls were in small caps, the U.S., and growth-orientated indices like the Nasdaq.
One way sailing for rates & shares in September
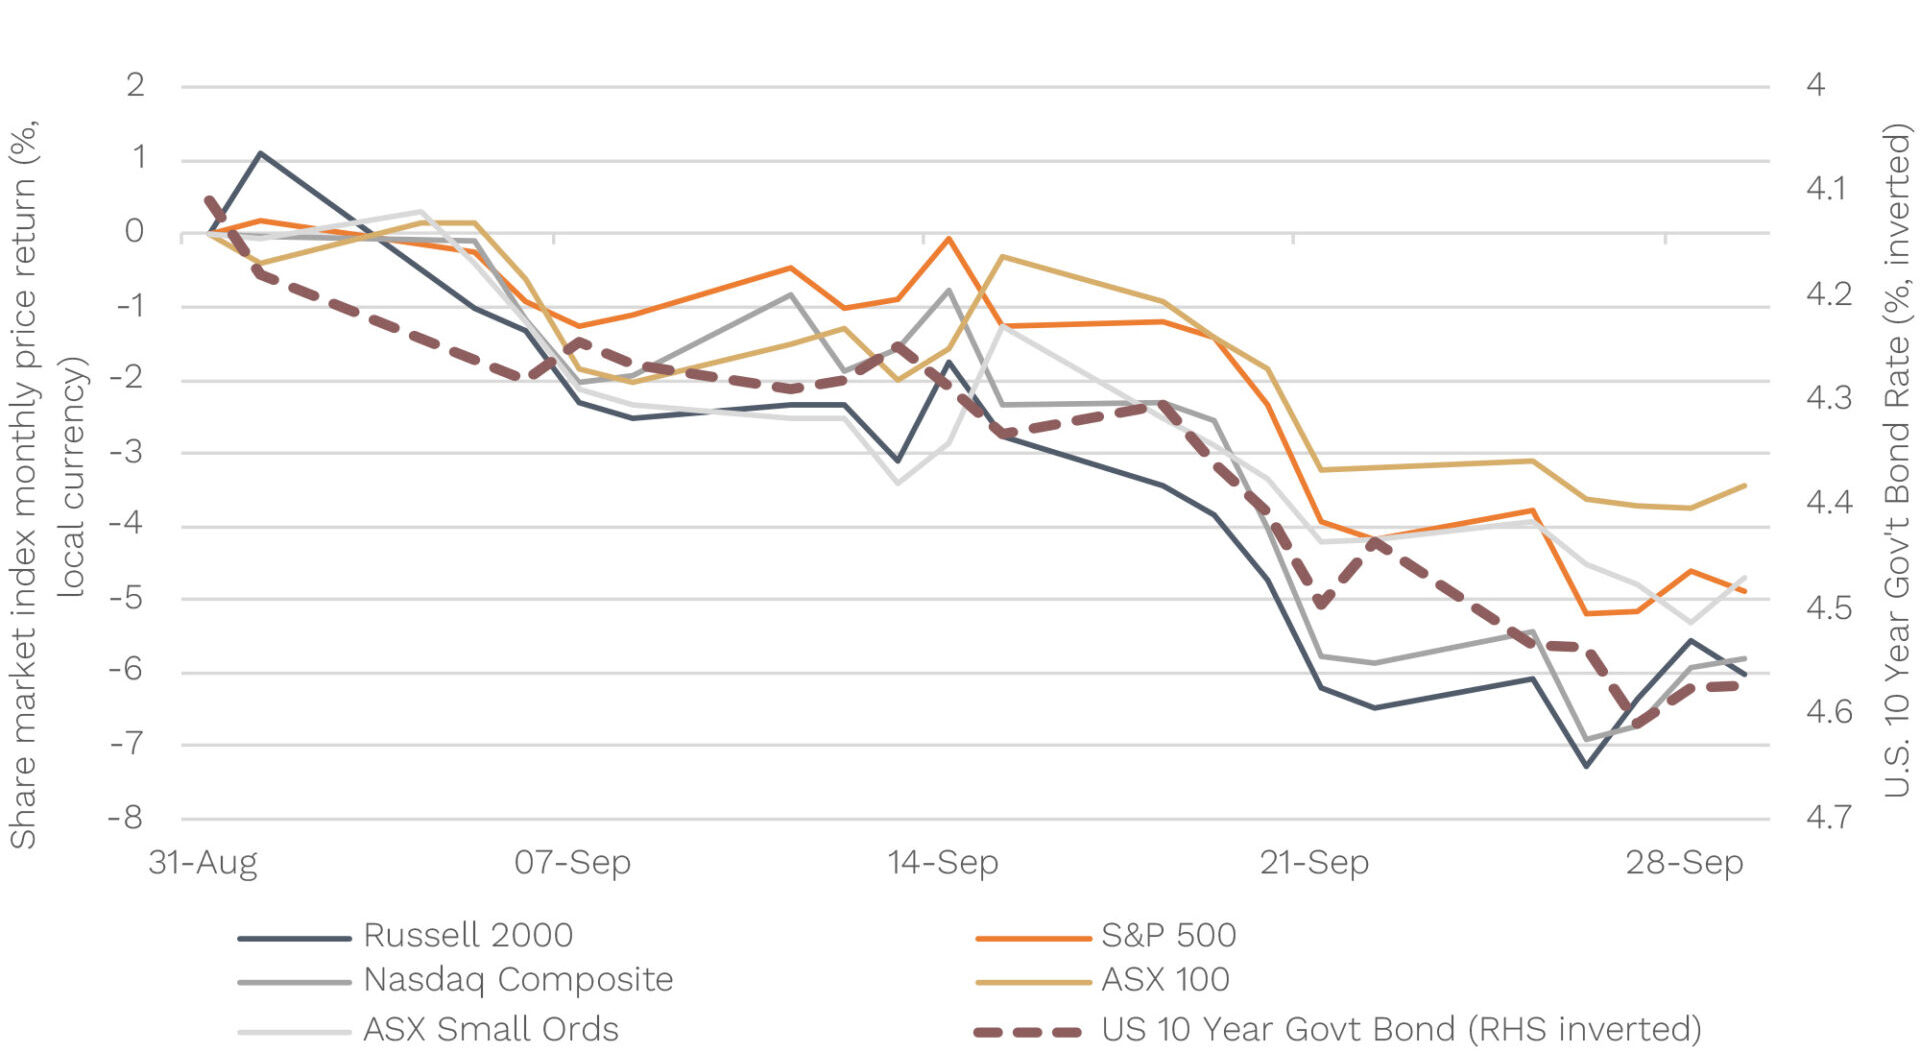
Source: FactSet. Data from 31 August 2023 to 30 September 2023. Returns in local currency terms.
Feel like the last thing equity markets need is to be whacked again?
Spare a minute, though, for investors in long-maturity debt, such as those that lend to the U.S. treasury for 10, 20, 30 years plus. Remember, a rise in bond yields means a fall in bond prices for fixed-interest bonds.
One of the longest-maturity bond fund ETFs, which invests in 25+ year zero-coupon US Treasury Bonds and goes by the ticker ZROZ, is down a staggering -61.5% from its high at writing. That’s more than the U.S. equity market fell during the GFC! And who said government bonds were risk-free …
But it is the impact of the jump in bond yields on small caps that has been of most interest to us this month. The good news is that, while we are currently seeing tough times in small caps, it is setting up big opportunities, particularly in the type of small caps in which we specialise.
New lows for small caps
During September, the bond yield spike saw a number of key small-cap indices make new lows this cycle.
The benchmark Russell 2000 index of U.S. small caps is down -29% from its previous high in November 2021, almost matching the maximum fall of -32% it posted in June of last year.
The further you go down the market cap spectrum, though, the worse it gets. The ‘Equal Weight’ Russell 2000 index, as well as the Russell Microcap and Russell Microcap Growth index, have all just hit new cycle lows. (Microcap stocks generally have a market cap of less than $U.S.300 million.)
Incredibly, the Russell Microcap Growth index is now down -55% from its highs, which goes to show you just how much normalising long-term interest rates has hit the smallest and growthiest companies in the market. These types of businesses have had their valuations punished the most as they typically have a larger proportion of their expected lifetime future cash flows further out in the future and which are discounted by more when long term interest rates rise.
Drawdowns – U.S. Small Cap indices making new lows
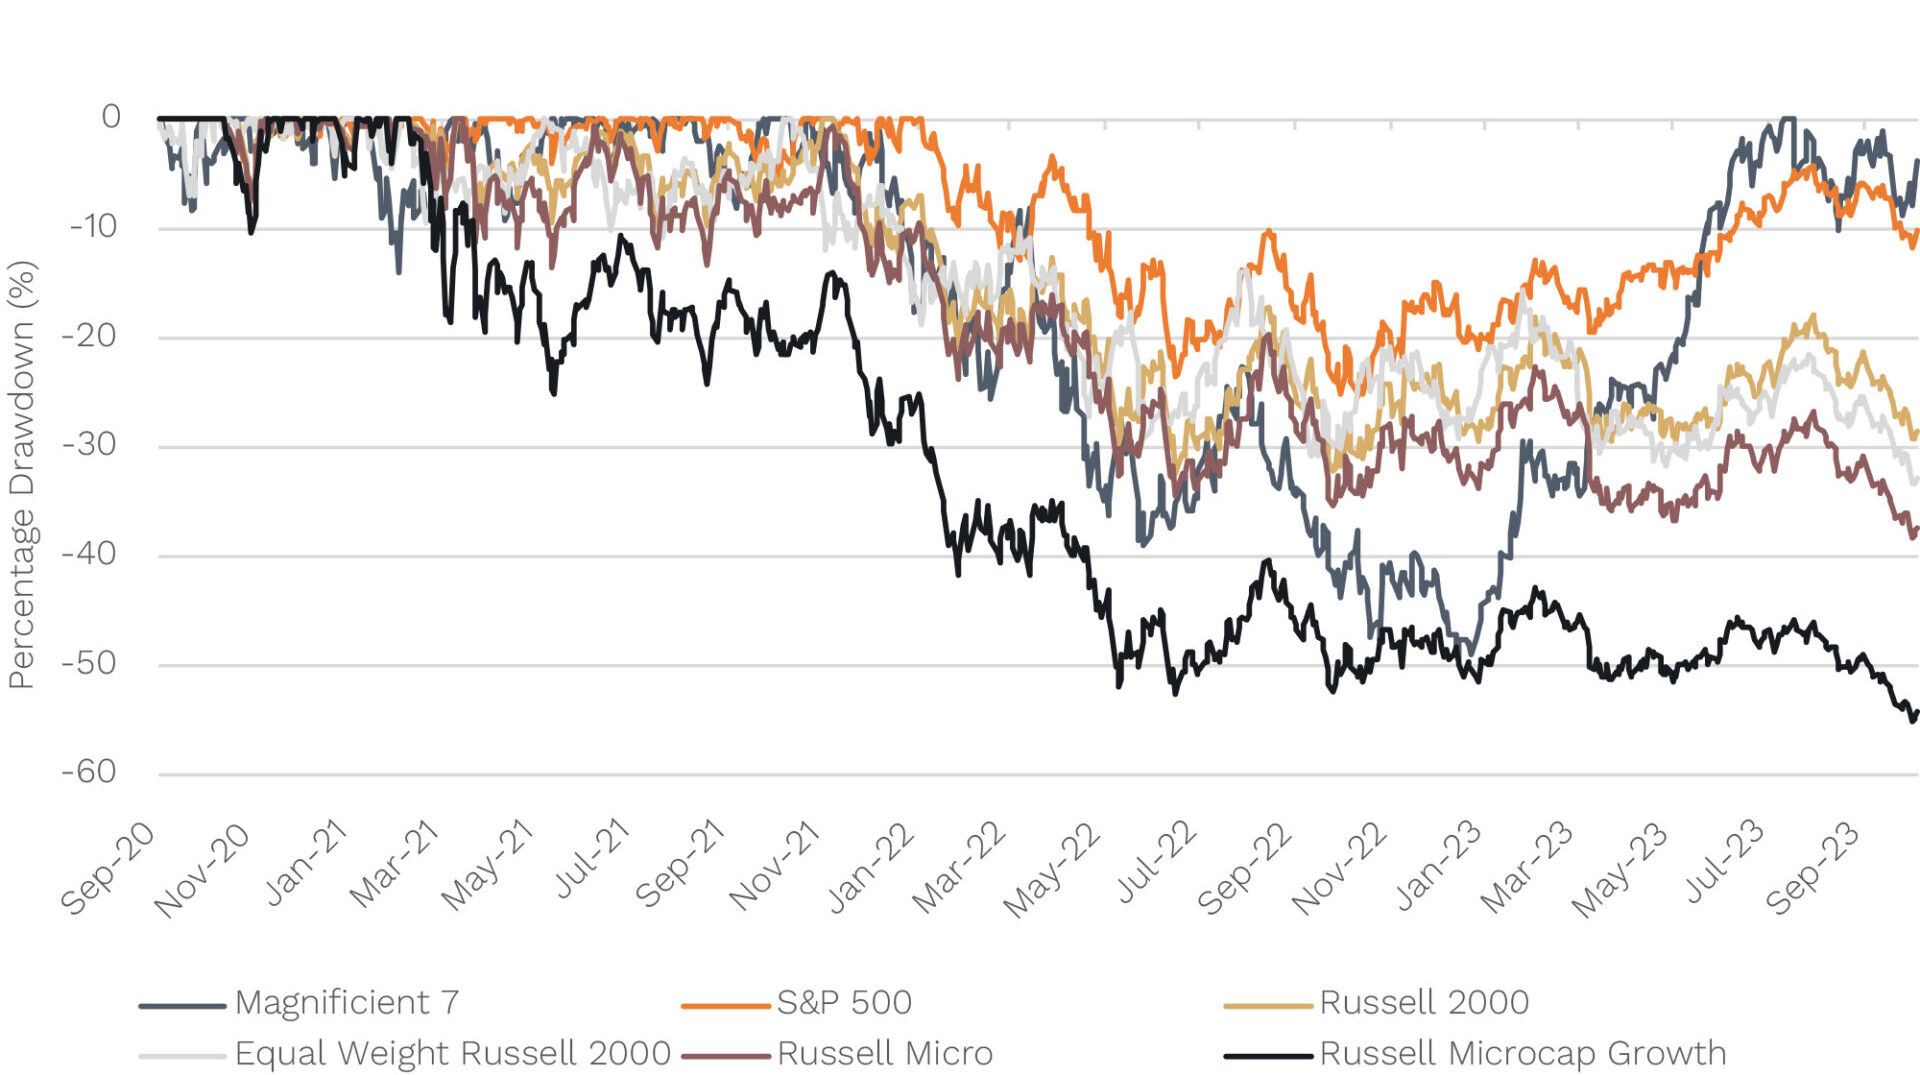
Source: Factset. Data as at 6 October 2023.
Now we don’t invest that far down the market cap-spectrum to the micro end – we generally look for businesses with $A1 billion+ market cap for our global funds – but it does highlight how disproportionate the pain has been compared to large and mega-cap companies.
Magnificent 7 sturdy
The S&P500, for instance, was down about -25% at its October 2022 lows and at writing is only off about -10% from its highs.
Even more incredible is the ride of the so-called ‘Magnificent 7’ mega-cap tech companies (Amazon, Apple, Google, Facebook, Tesla, Nvidia, Microsoft), which at their worst were down almost -50% in late 2022, before staging an almighty recovery to hit new all-time highs in July this year. They are currently only about -4% off those highs.
What of the Aussie share market you may ask?
Below, we show the drawdowns for Aussie large (ASX100) and small caps.
Drawdowns – Australian Small Cap index near its low
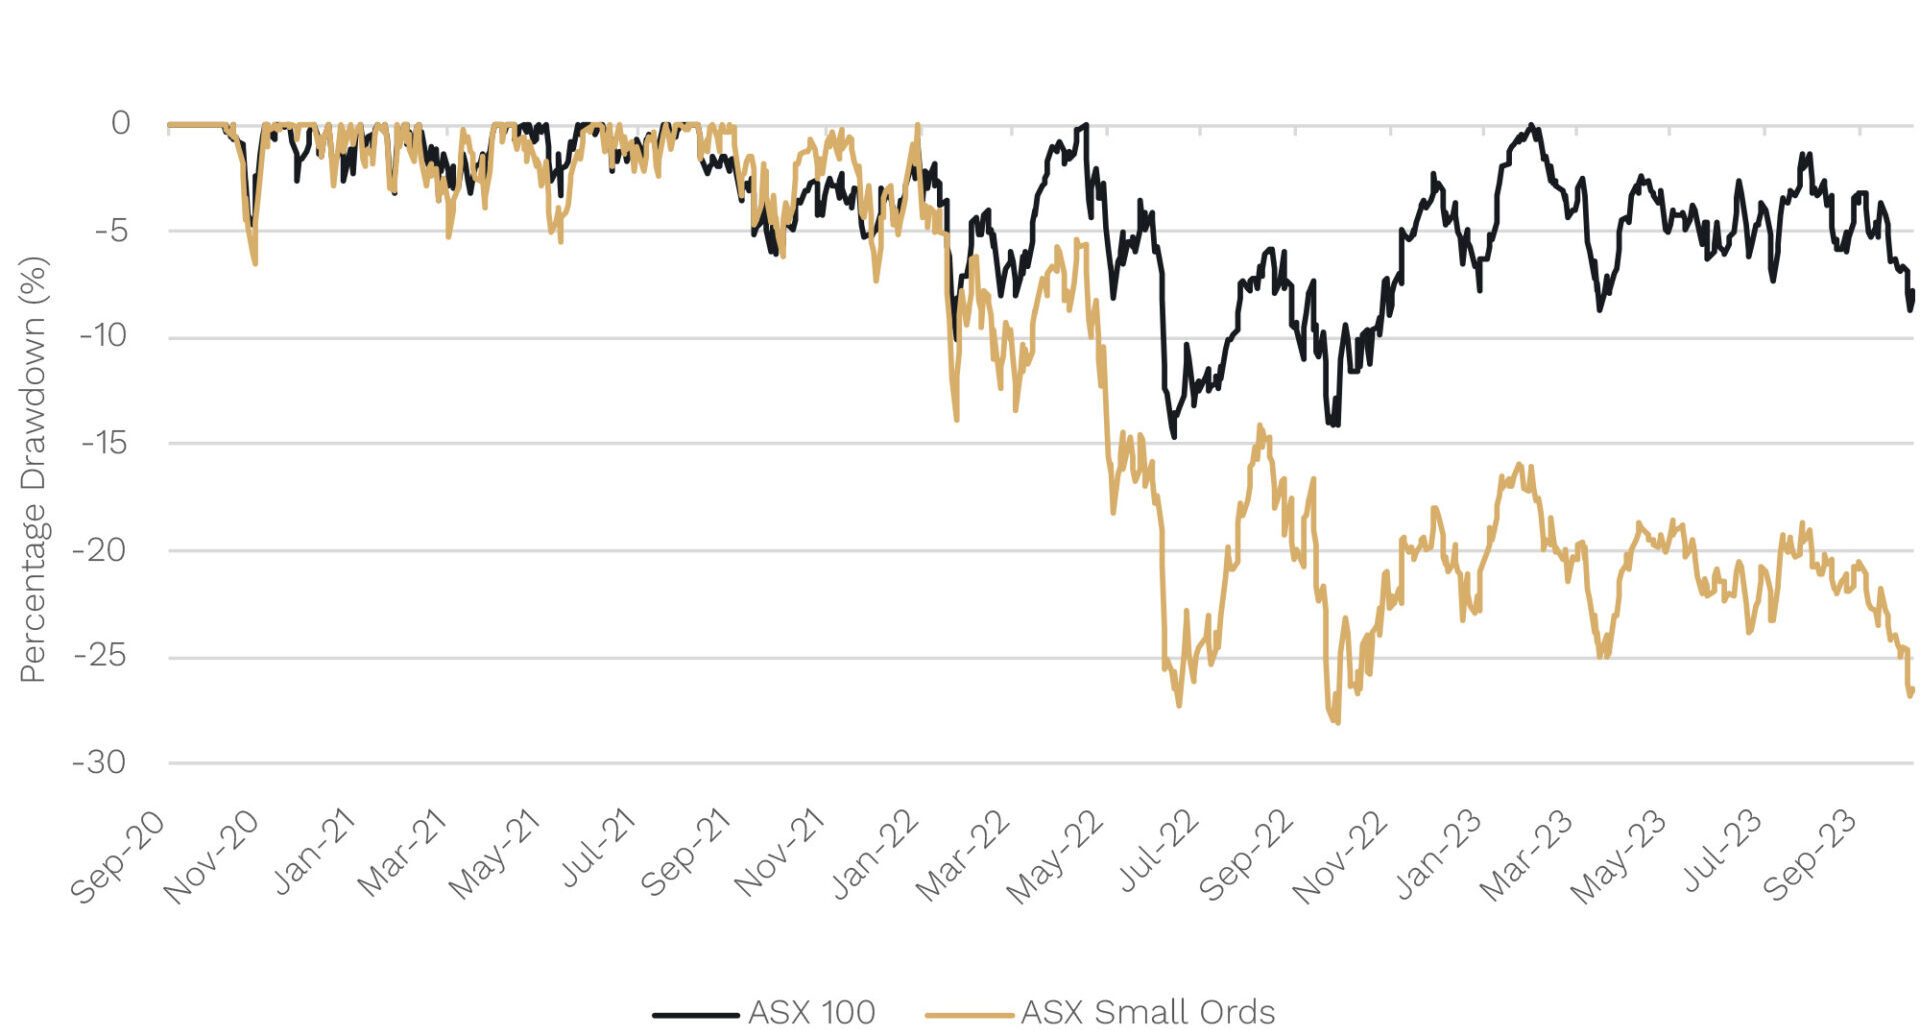
Source: Factset. Data as at 6 October 2023.
As with the U.S., Aussie large caps are still some distance off their drawdown lows of 2022, which was around -15%. Aussie small caps, again like the U.S. are down considerably more, and within a whisker of making new lows this cycle.
Big smalls outperform
As you could see with the wide dispersion in drawdowns of the various U.S. small-cap indices above, not all parts of the small-cap market are being treated equally.
To show this, below we break the Russell 2000 index – the most frequently used benchmark for U.S. small caps – into three buckets:
- So called ‘small’ small caps with market caps of less than $A3 billion
- ‘Mid’ small caps of between $A3 billion to $8 billion, and
- ‘Large’ small caps with market caps greater than $A8 billion.
Russell 2000: 1-year total returns by market cap ranges
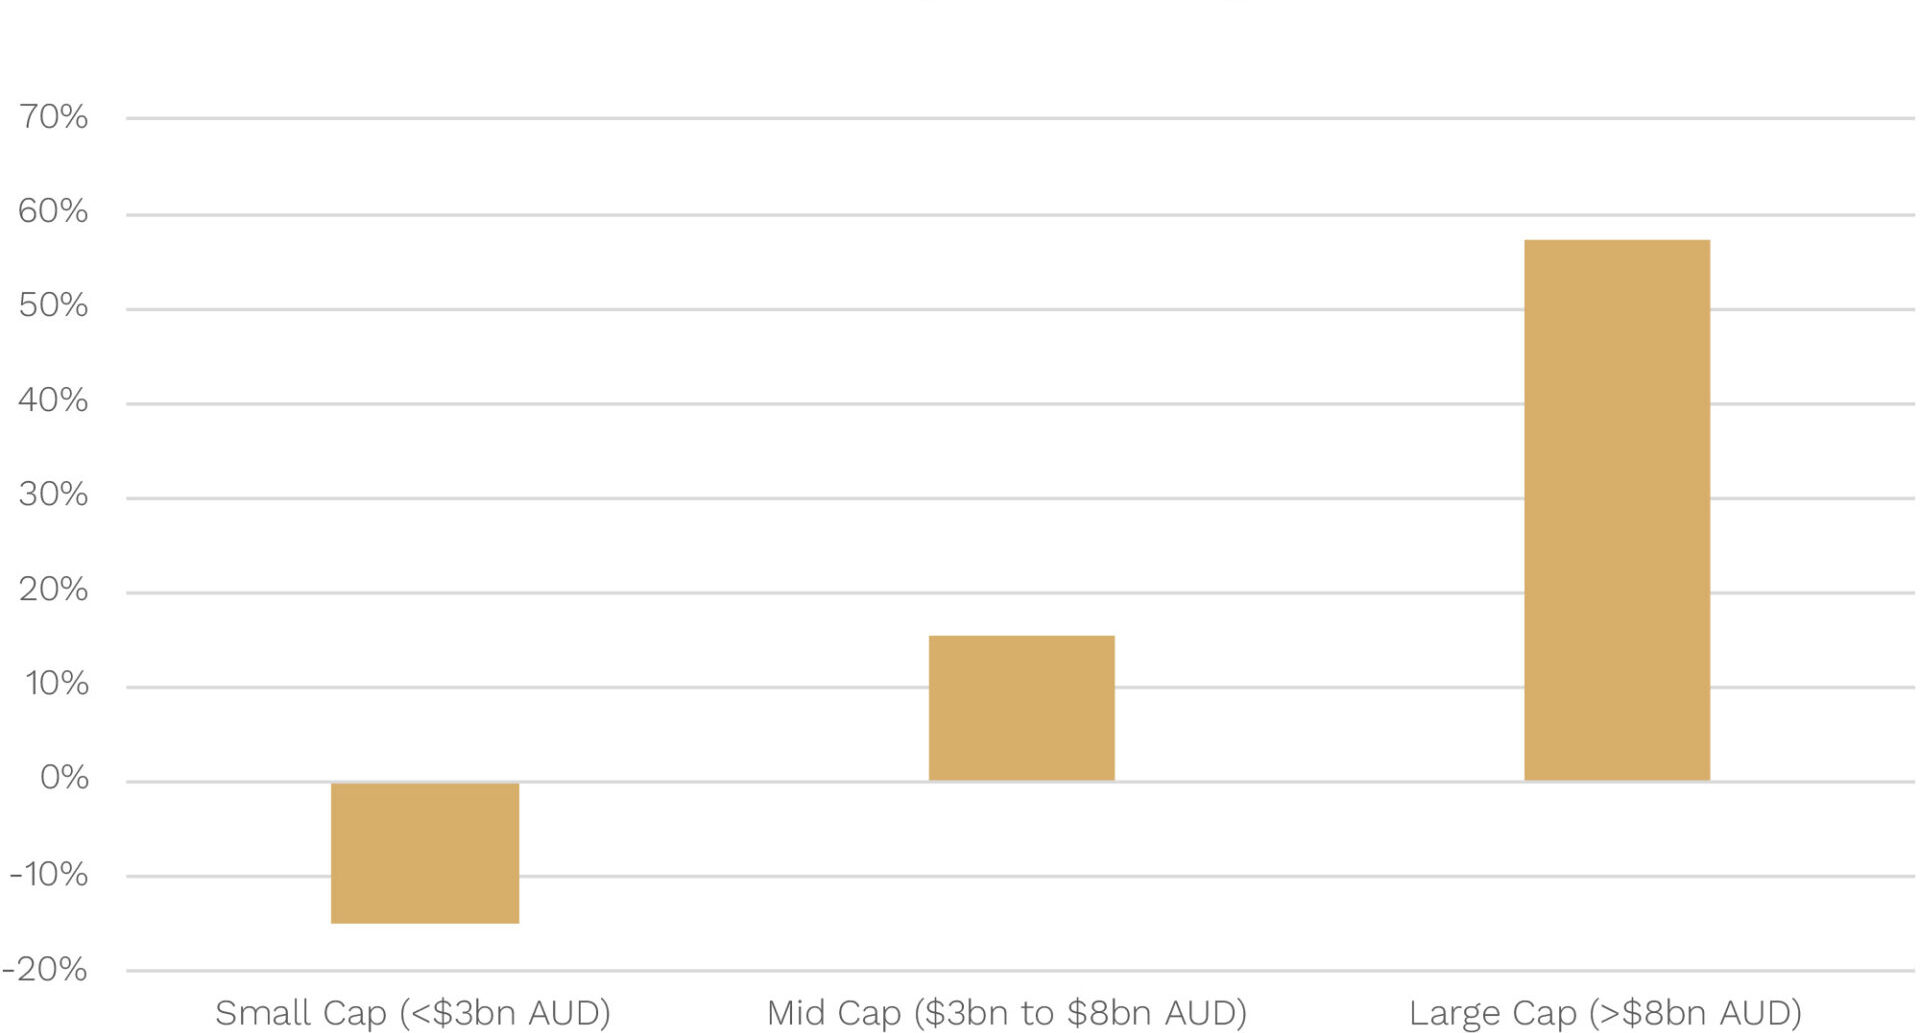
Source: FactSet. Data from 30 September 2022 to 30 September 2023. Returns in local currency terms. Total returns for each of the three market cap buckets are comprised of the weighted average returns in each bucket over the year.
It’s clear that if you fished in the larger small caps pond over the last year you would have fared much better.
Our fertile hunting ground set to outperform
At Ophir, we tend to cast the rod in the $A1 billion to $A6-7 billion market-cap range for our global funds over the long term. We find that range provides the best combination of being less efficiently priced, whilst also avoiding the large number of sub-scale, less liquid and often unprofitable businesses below $A1 billion in market cap.
There is no doubt that not being at the larger end of small caps in our global funds over the last year has held back performance.
Longer term, however, we think our market cap range is much more likely to provide a more fertile hunting ground than the larger end. Valuations are more attractive in this segment, and we believe much more likely to outperform the large end of small caps when the next sustainable bull market begins, and liquidity flows back down the market cap spectrum.
As always, thank you for entrusting your capital with us.
Kindest regards,
Andrew Mitchell & Steven Ng
Co-Founders & Senior Portfolio Managers
Ophir Asset Management
This document is issued by Ophir Asset Management Pty Ltd (ABN 88 156 146 717, AFSL 420 082) (Ophir) in relation to the Ophir Opportunities Fund, the Ophir High Conviction Fund and the Ophir Global Opportunities Fund (the Funds). Ophir is the trustee and investment manager for the Ophir Opportunities Fund. The Trust Company (RE Services) Limited ABN 45 003 278 831 AFSL 235150 (Perpetual) is the responsible entity of, and Ophir is the investment manager for, the Ophir Global Opportunities Fund and the Ophir High Conviction Fund. Ophir is authorised to provide financial services to wholesale clients only (as defined under s761G or s761GA of the Corporations Act 2001 (Cth)). This information is intended only for wholesale clients and must not be forwarded or otherwise made available to anyone who is not a wholesale client. Only investors who are wholesale clients may invest in the Ophir Opportunities Fund. The information provided in this document is general information only and does not constitute investment or other advice. The information is not intended to provide financial product advice to any person. No aspect of this information takes into account the objectives, financial situation or needs of any person. Before making an investment decision, you should read the offer document and (if appropriate) seek professional advice to determine whether the investment is suitable for you. The content of this document does not constitute an offer or solicitation to subscribe for units in the Funds. Ophir makes no representations or warranties, express or implied, as to the accuracy or completeness of the information it provides, or that it should be relied upon and to the maximum extent permitted by law, neither Ophir nor its directors, employees or agents accept any liability for any inaccurate, incomplete or omitted information of any kind or any losses caused by using this information. This information is current as at the date specified and is subject to change. An investment may achieve a lower than expected return and investors risk losing some or all of their principal investment. Ophir does not guarantee repayment of capital or any particular rate of return from the Funds. Past performance is no indication of future performance. Any investment decision in connection with the Funds should only be made based on the information contained in the relevant Information Memorandum or Product Disclosure Statement.


