By Andrew Mitchell & Steven Ng
Co-founders and Senior Portfolio Managers

In this month’s Letter to Investors we look at how inflation is driving this market mayhem and what it may take for the market to find a sustainable bottom. We also review evidence that, despite inflation’s sway over markets, we may be close to ‘peak’ macro and a return to a focus on earnings.
Welcome to the September Ophir Letter to Investors – thank you for investing alongside us for the long term.
When good is bad and bad is good
It’s understandable if investors are suffering some form of PTSD.
Many share markets in September clocked up their worst month since March 2020. We all know what happened back then when Covid utterly shocked the world. The S&P500 reflected the ghastly uncertainty of that time and crashed -12.5% in that fateful month.
But here we are two-and-a-half years later, and in September the S&P500 crashes -9.3%. That’s about three quarters of the March 2020 fall (a time when the pandemic emerged and we had no idea at all where the world was heading).
The Aussie share market wasn’t spared. The two benchmarks for our Australian equity funds, the ASX Small Ords and the ASX Small-Mid Index, were down -11.2% and -9.4% respectively in September.
In this letter we look at how inflation is driving this market mayhem, mayhem that will only end when the ‘anti’ Four Horsemen of the Apocolypse ride to the rescue (see more on that later). And we look at evidence that, despite inflation’s sway over markets, we may be close to ‘peak’ macro and a return to a focus on earnings.
A pleasing return to outperformance
But first, one positive during September’s sell-off was that all our Funds at Ophir protected wealth and outperformed, some materially so.
Our portfolios combined good fortune (structural underweights in underperforming bond-proxy sectors such as real estate and utilities) with good design (a skew towards quality, lowly geared businesses with more resilient earnings and some good stock-specific news).
As the Aussie dollar depreciated, our global portfolios benefited from being unhedged for currency movements, with the falling Aussie making our overseas investments on average worth more when converted to AUD.
But of more significance to us is the return to outperformance across our investment portfolios over the last four months, a period which has included both bear market rallies and significant sell-offs. This suggests to us the adjustments we made back in March/April in portfolio positioning across the Funds were likely appropriate.
September 2022 Ophir Fund Performance
Before we jump into the letter in more detail, we have included below a summary of the performance of the Ophir Funds during September. Please click on the factsheets if you would like a more detailed summary of the performance of the relevant fund.
The Ophir Opportunities Fund returned -5.9% net of fees in September, outperforming its benchmark which returned -11.2%, and has delivered investors +21.2% p.a. post fees since inception (August 2012).
Download Ophir Opportunities Fund Factsheet
The Ophir High Conviction Fund investment portfolio returned -6.5% net of fees in September, outperforming its benchmark which returned -9.3%, and has delivered investors +12.2% p.a. post fees since inception (August 2015). ASX:OPH provided a total return of -14.4% for the month.
Download Ophir High Conviction Fund Factsheet
The Ophir Global Opportunities returned +0.8% net of fees in September, outperforming its benchmark which returned -4.3%, and has delivered investors +14.7% p.a. post fees since inception (October 2018).
Download Ophir Global Opportunities Fund Factsheet
Opportunity in the OPH discount
While the investment portfolio of OPH, the listed vehicle for our Ophir High Conviction Fund, has seen a return to outperforming its benchmark over the last four months, its unit price on the ASX has not. As you can see in the bottom panel of the chart below, OPH has moved from trading at a premium to its Net Asset Value (NAV) to a discount.
ASX:OPH – Share Price vs NAV
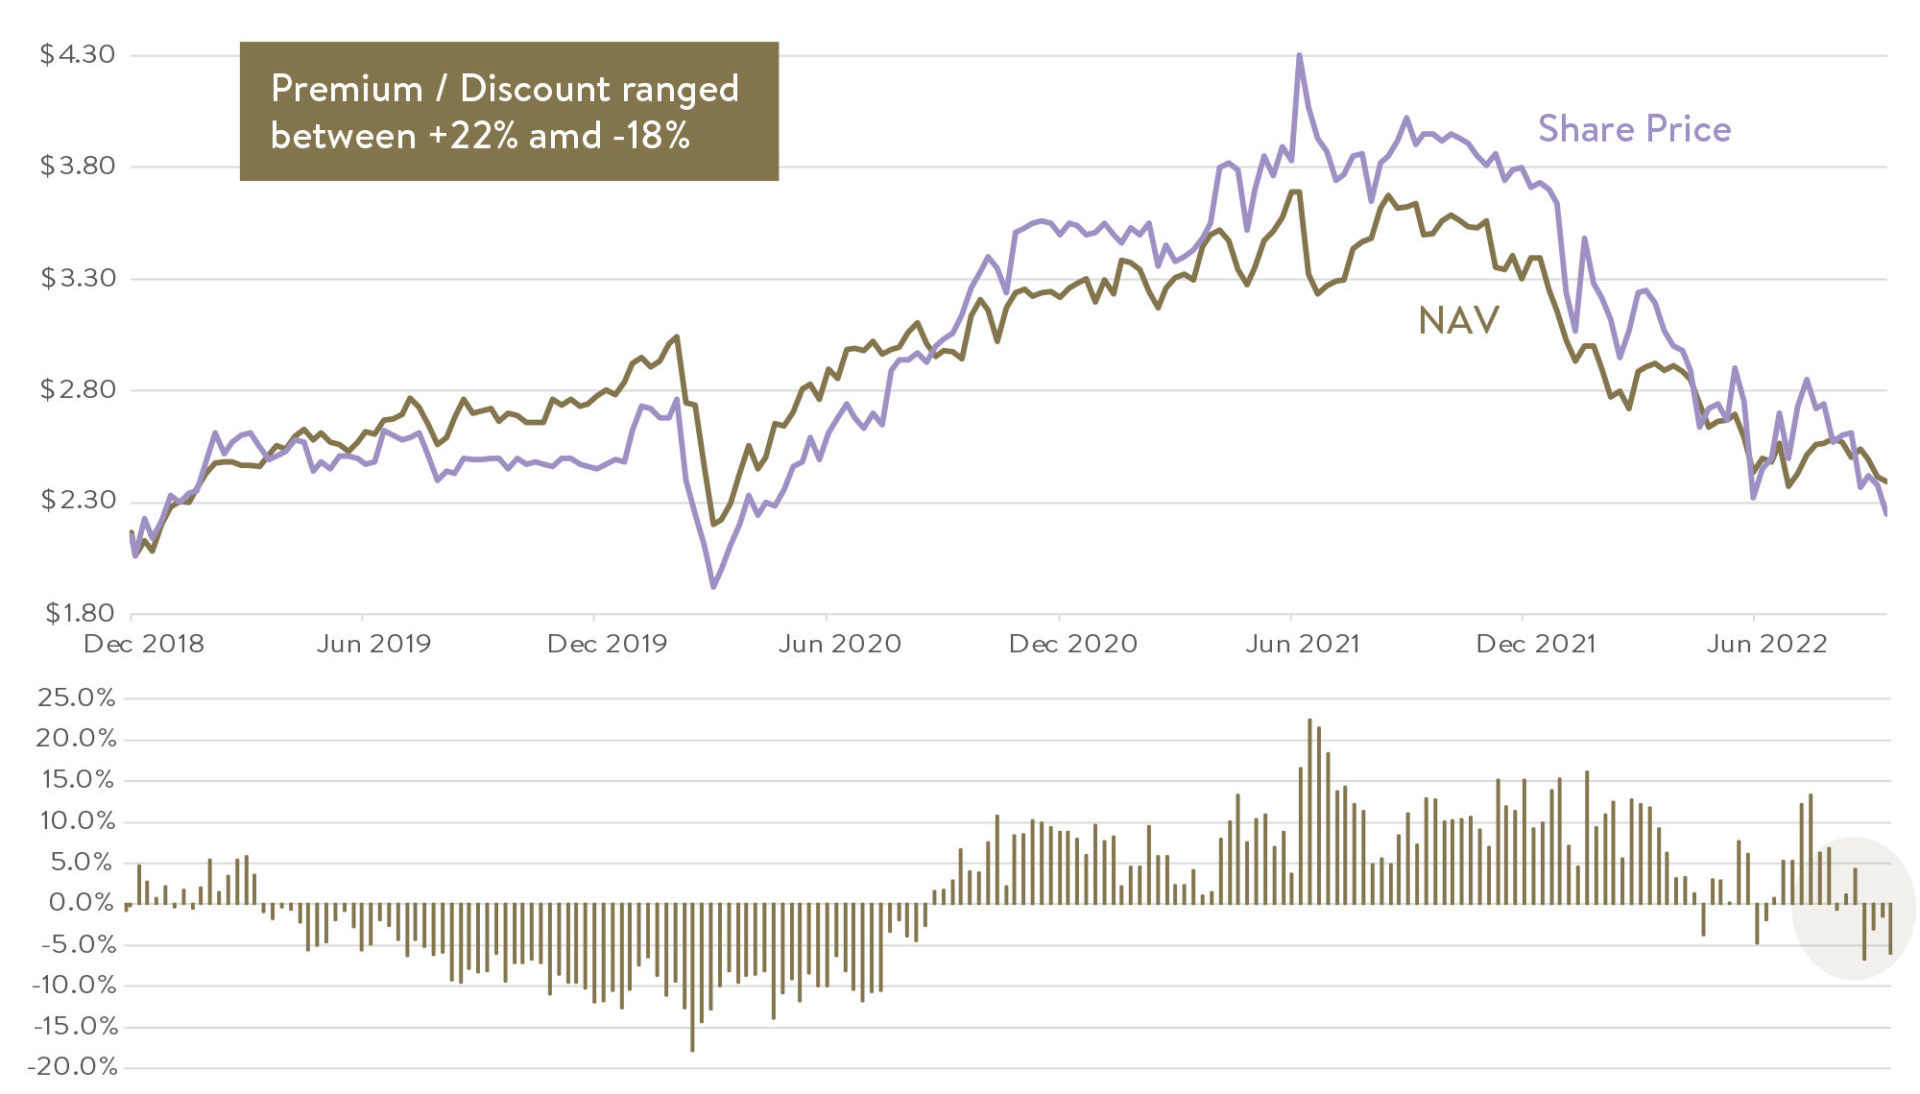
Data as at 30 September 2022. Past performance is not a reliable indicator of future performance.
For listed equity funds, premiums shrinking or discounts widening during equity market sell-offs is a well-known trait. You can see the discount widened during the March 2020 Covid sell-off.
To some, the premium or discount to NAV is an additional risk. But we personally see it as an opportunity to buy the Fund at a discount. The Fund continues to be a top-performing Aussie mid-cap fund over the long term and the senior team members and investment process remains the same.
Nowhere to hide
One of the toughest aspects of the current market is that investors haven’t been able to flee to the safe haven of bonds.
Investors who have piled out of equities into bonds got caught (has anyone ever got that timing consistently right?).
As you can see below, long-term bonds in the US are on track for their worst year ever – by a long way.
S&P 500, US 10-Year Treasury, and 60/40 Portfolio (Total Returns, 1928-2022)
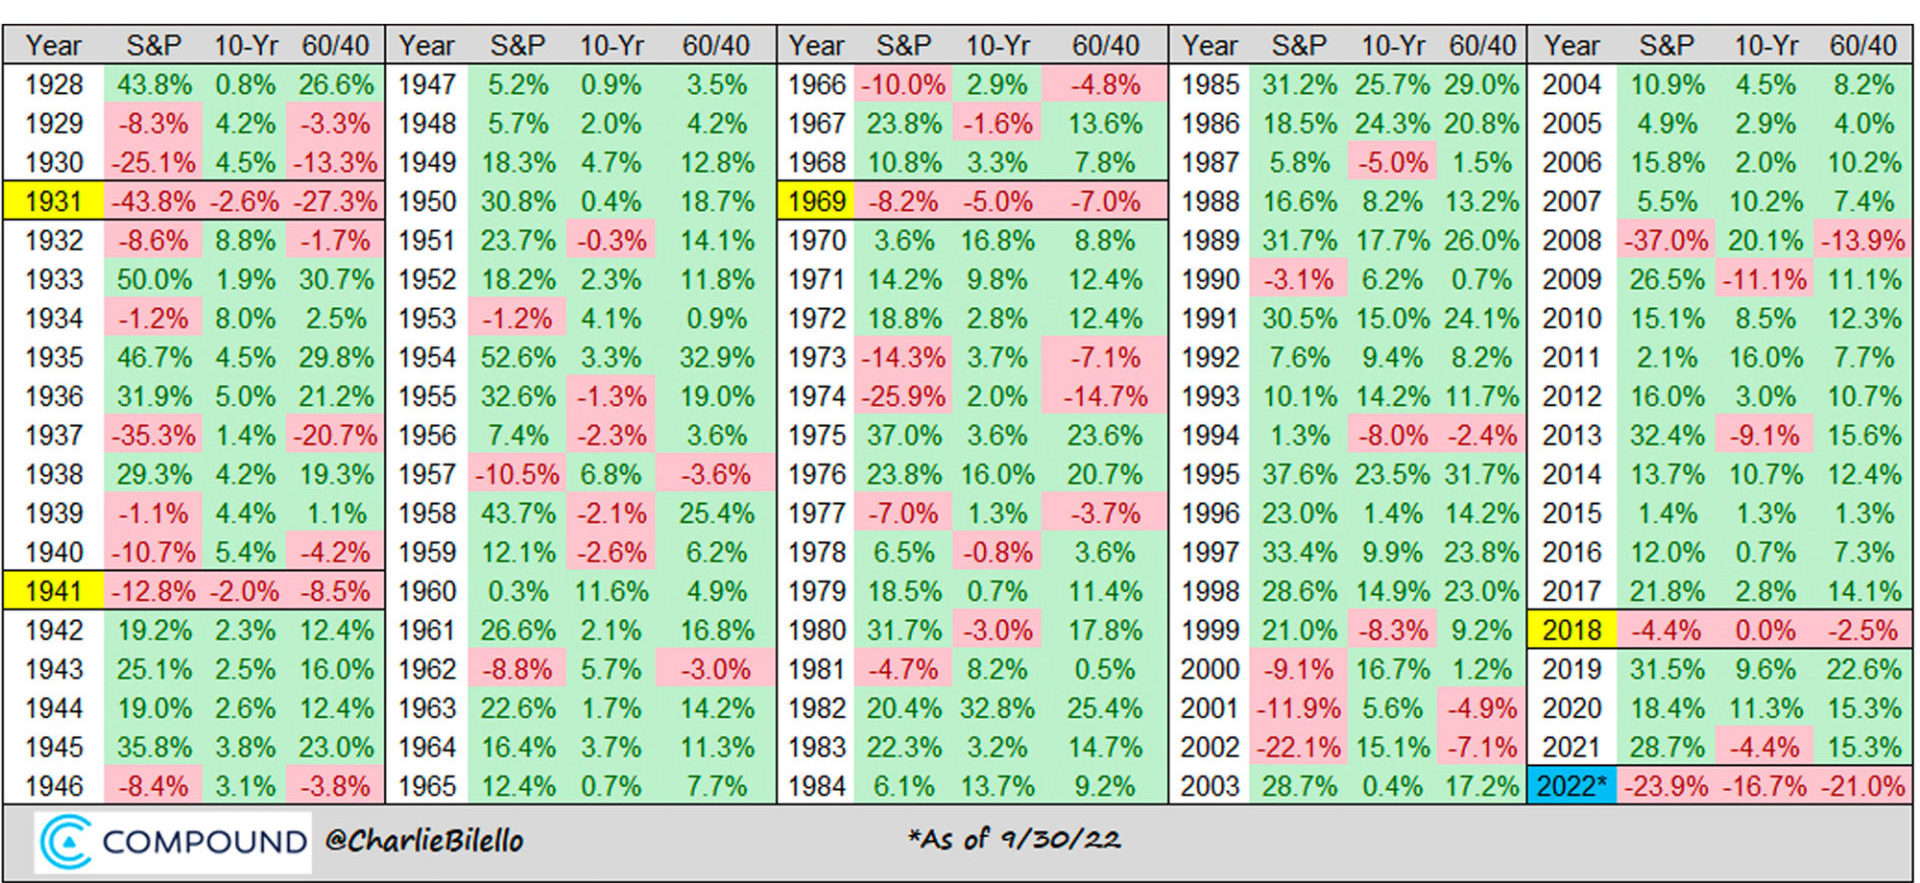
The table also shows the annual returns going back to almost the last century for the US share market (S&P 500), 10-year US Treasury Bonds, and a 60/40 combo of both.
We have to go back to 1931 (!) and the Great Depression to see a worse year for a ‘diversified’ stock/bond investor.
Incredibly, there’s only been four other years where both stocks and bonds have been down (highlighted in yellow).
Even during the GFC in 2008, diversified stock/bond investors weren’t having it as tough as this year. Bonds then played their traditional, diversifying role in the short term, with their gains partially offsetting share market falls.
Tough times, but expected returns move higher
So why have we had such historically bad returns in these two core asset classes that make up the backbone of many investors’ portfolios?
Quite simply, rampant inflation has ended the decades-long fall in long-term interest rates. In response, equity and bond markets valuations, which only made sense if interest rates were to stay ultra-low over the long term, are normalising (a euphemism for ‘crushed’).
In recent years, those ultra-low rates ‘brought forward’ returns, but long-term investors are now paying some of those returns back.
But new investors, of both the equity and bond variety, are getting the opportunity to invest at valuations that make expected returns over the next 5-10 years vastly better than they were just a year ago. In the table above you can see just how rare years of -20%+ falls are and how strongly negative years in the equity market are typically followed by strongly positive years.
When markets bottom: all roads lead to inflation
Ultimately, the likely trajectory of markets ends up coming back to inflation.
Historically, four things have typically happened when bear-markets have bottomed, which you might call the ‘anti’ Four Horsemen of the Apocalypse:
- Market-wide profit downgrades start to slow
- The rebound happens 1-2 quarters before the economic trough
- Central banks start to pivot from rate hikes to at least thinking about cuts
- Inflation has peaked and showing clear signs of falling
Everyone is fixated on number 4, and for good reason. As mentioned, inflation is what got us into this mess in the first place.
Once there are clear signs of inflation peaking, then central banks can pivot (sign 3). If this happens soon enough, the higher the probability that signs 1 and 2 will occur with less, or perhaps little, carnage to economic and corporate fundamentals.
This time is different
The track record of bringing high inflation (above 5%) down to low/target inflation in many countries of around 2% in a speedy manner, though, is not good. The average time taken in advanced economies is 10 years if we look at the last 40 years of data.
Cases of inflation above 5% in advanced economies 1980-2020, years to decline to 2%
Once inflation is above 5% in advanced economies, it takes on average 10 years to drop to 2%
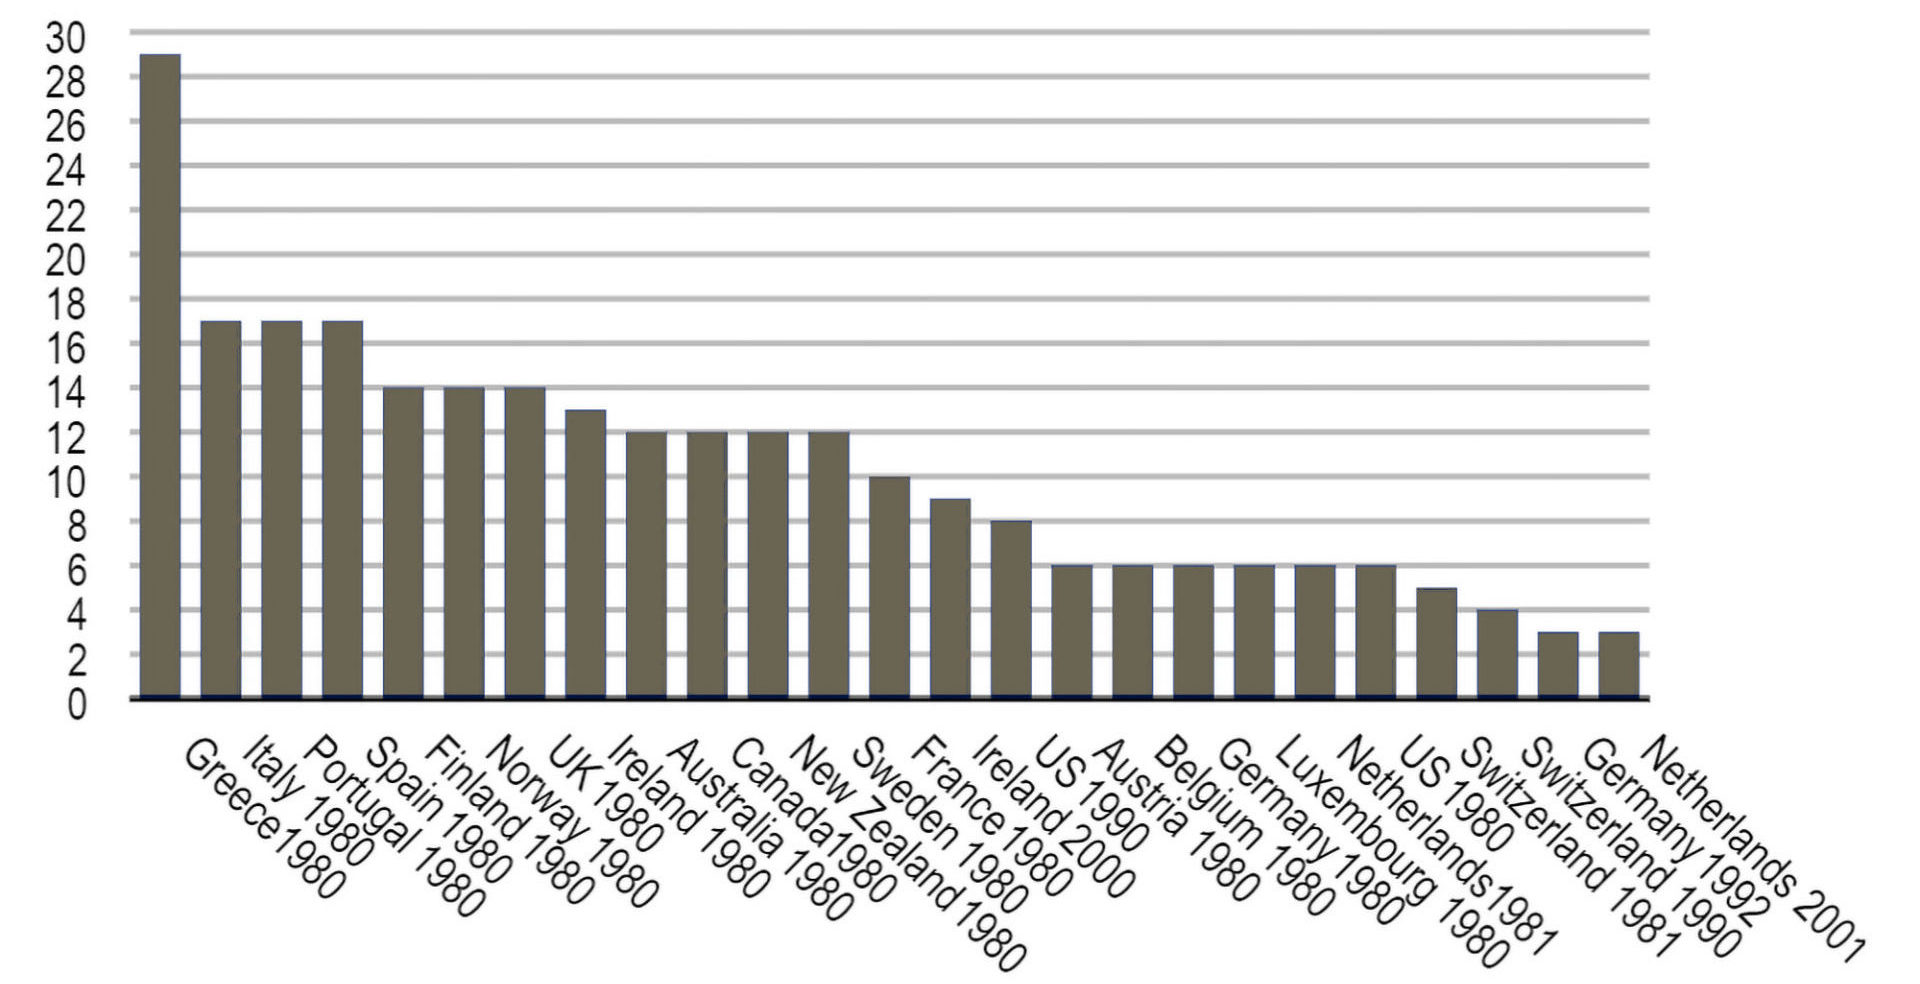
Source: IMF and BofA Global Research.
But this likely paints a misleading and overly pessimistic picture of the ability of central banks to get inflation more rapidly under control. Much of the excessive time taken to get inflation under control stems from the 1970s/early 1980’s episode which differs from today in that:
- We now have an inflation targeting regime at independent central banks that didn’t exist then;
- Longer-term inflation expectations are well anchored now given (1) (this wasn’t the case in the 1980s);
- There are much lower levels of unionisation in the workforce now, which helps stop high consumer-price inflation feeding into a wage-price spiral;
- There is evidence the supply-side causes of inflation, particularly Covid induced supply chain interruptions, are improving; and
- Central banks, while starting maybe slower than many would have liked, have since acted rapidly to raise interest rates and restrict demand
When good is bad and bad is good
Until such time as there is clear evidence inflation globally is falling, however, expect markets to continue to play a game of cat and mouse with each economic data release.
This has been clear in early October. Bad or weak economic data has been met with booming share markets as investors rejoice that rate hikes are doing their job, economic growth is slowing and likely so is inflation, prompting central banks to soon pivot. Then just days later good or strong economic news crushes the hopes of the ‘pivot’ camp, sending share markets plummeting on beliefs of higher-for-longer interest rates.
This well-worn dance will likely continue until inflation is defeated.
Peak macro?
But that doesn’t mean that macro will dominate forever. Indeed, there are signs we could be reaching ‘peak macro’.
As regular readers of our Letters know, big-picture macro forces, such as inflation, central bank policy and bond yields have been driving the market and company share prices a lot more than usual over the past 12 months.
One way to measure the extent of macro influence on share markets is the correlation between stocks. When macro influences (that impact all stocks) dominate correlation is high. Correlation is low when individual company-specific micro news holds sway.
We are at peak macro … but bottom-up will be back
ASX 200 intra-market correlation by month and 12 month moving average
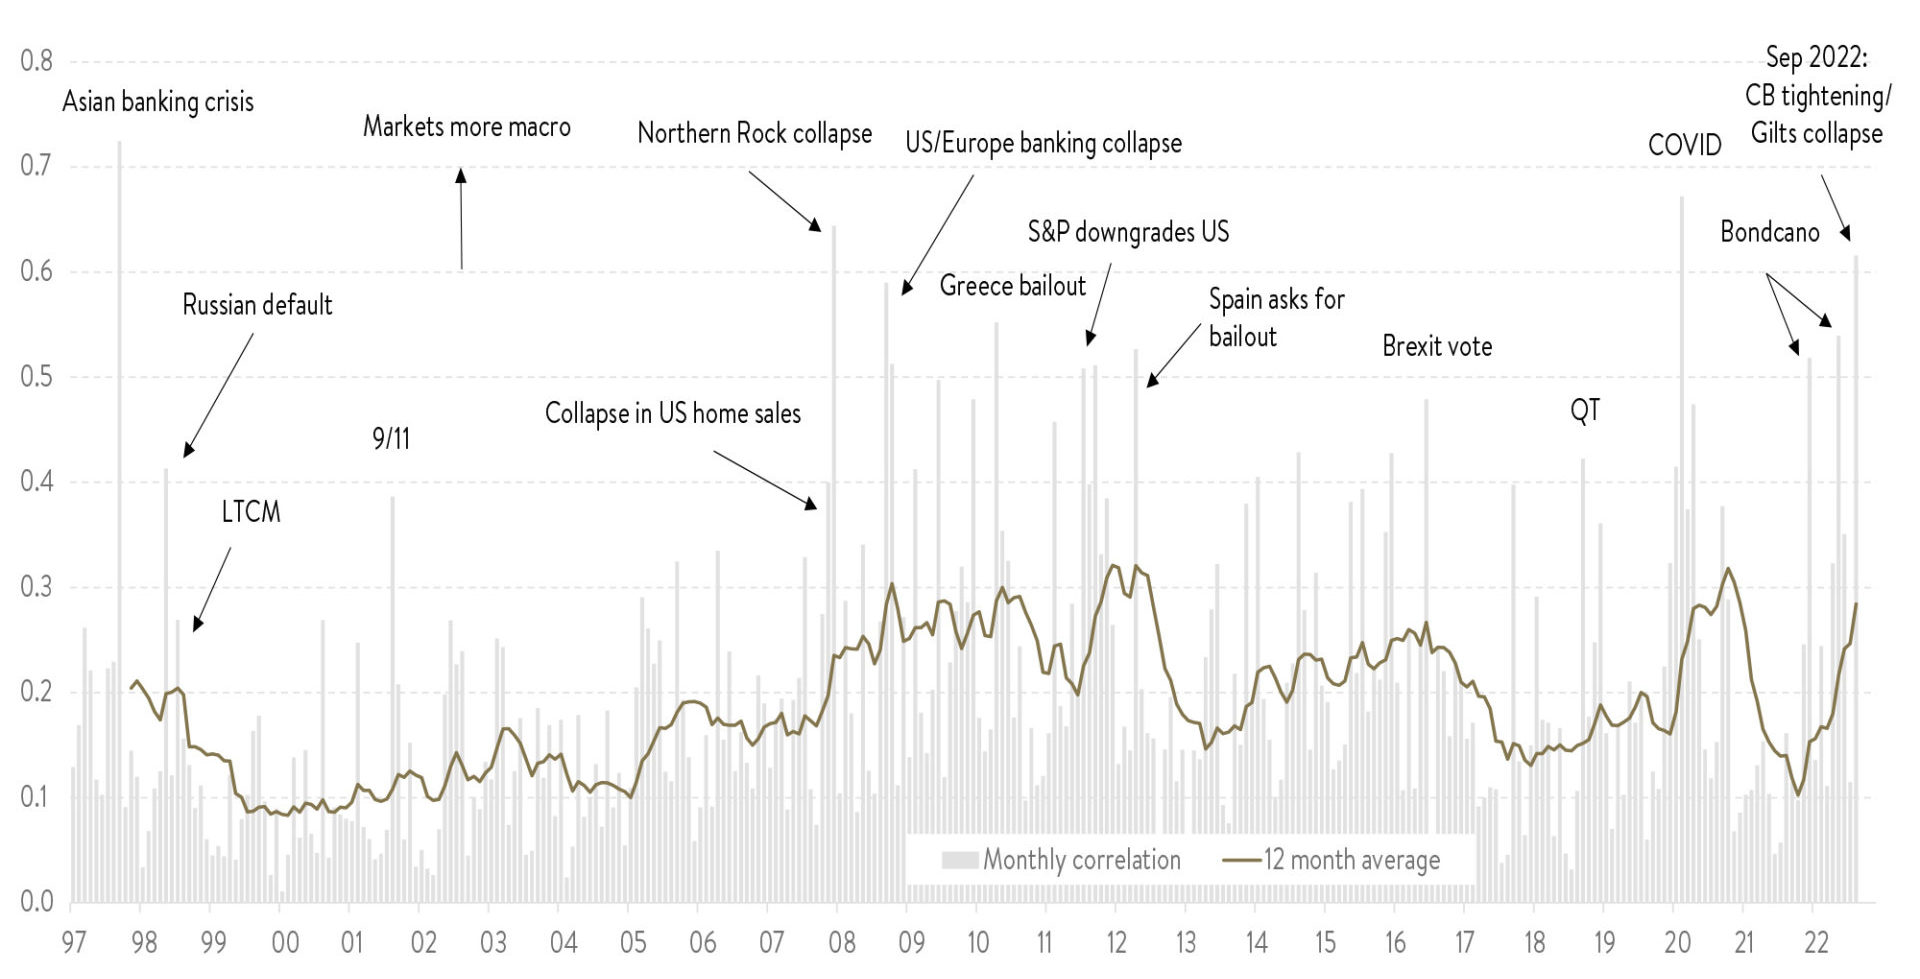
Source: Refintiv, Factset, MST Marquee
As you can see above, during September the Aussie share market had the fourth-highest stock correlation of any month in the last 25 years! Based on this metric, 2022 has been the third most macro-driven year over the last quarter century. The stats are similar for many other major share markets.
That’s good for macro traders (if it’s even possible to consistently make money from calling the macro), but harder for bottom-up stock pickers.
There might, however, be evidence we’ll soon be passing peak macro.
Arguably, central bank and bond yield moves are likely to get smaller (witness the RBA’s smaller-than-expected hike earlier this month). And after October we are heading into a seasonally weaker period for macro influence.
In the very long run, almost all that matters for share price returns is earnings. We think that will soon be the case once again. As the great stock picker Peter Lynch once said:
“Often, there is no correlation between the success of a company’s operations and the success of its stock over a few months or a few years. In the long term, there is 100 percent correlation between the success of the company and the success of its stock.”
No material changes
Despite the large fall in many equity markets, our outlook has not changed materially over the month. We are maintaining our skew to companies with resilient and less macro-sensitive earnings, and strong balance sheets. Our funds are holding cash at modestly higher levels than normal, and that cash is being deployed opportunistically.
The situation remains very fluid and uncertain. But our higher liquidity means we can be flexible as circumstances change. We see a period in coming weeks and months where interest rates find a ceiling and markets focus back on company earnings.
Markets will rebound, and if history is any guide, mostly likely aggressively so. The bearishness and poor investor sentiment of today are sowing the seeds of tomorrow’s rebound, and the opportunity to outperform for earnings-based investors such as ourselves.
As always, thank you for entrusting your capital with us.
Kindest regards,
Andrew Mitchell & Steven Ng
Co-Founders & Senior Portfolio Managers
Ophir Asset Management
This document is issued by Ophir Asset Management Pty Ltd (ABN 88 156 146 717, AFSL 420 082) (Ophir) in relation to the Ophir Opportunities Fund, the Ophir High Conviction Fund and the Ophir Global Opportunities Fund (the Funds). Ophir is the trustee and investment manager for the Ophir Opportunities Fund. The Trust Company (RE Services) Limited ABN 45 003 278 831 AFSL 235150 (Perpetual) is the responsible entity of, and Ophir is the investment manager for, the Ophir Global Opportunities Fund and the Ophir High Conviction Fund. Ophir is authorised to provide financial services to wholesale clients only (as defined under s761G or s761GA of the Corporations Act 2001 (Cth)). This information is intended only for wholesale clients and must not be forwarded or otherwise made available to anyone who is not a wholesale client. Only investors who are wholesale clients may invest in the Ophir Opportunities Fund. The information provided in this document is general information only and does not constitute investment or other advice. The information is not intended to provide financial product advice to any person. No aspect of this information takes into account the objectives, financial situation or needs of any person. Before making an investment decision, you should read the offer document and (if appropriate) seek professional advice to determine whether the investment is suitable for you. The content of this document does not constitute an offer or solicitation to subscribe for units in the Funds. Ophir makes no representations or warranties, express or implied, as to the accuracy or completeness of the information it provides, or that it should be relied upon and to the maximum extent permitted by law, neither Ophir nor its directors, employees or agents accept any liability for any inaccurate, incomplete or omitted information of any kind or any losses caused by using this information. This information is current as at the date specified and is subject to change. An investment may achieve a lower than expected return and investors risk losing some or all of their principal investment. Ophir does not guarantee repayment of capital or any particular rate of return from the Funds. Past performance is no indication of future performance. Any investment decision in connection with the Funds should only be made based on the information contained in the relevant Information Memorandum or Product Disclosure Statement.


