In this special edition of the Letter to Investors, we’re celebrating birthdays for our Ophir Global Funds by:
- Showcasing their very good one-year returns and pleasing long-term performance records
- Breaking down the unique factor driving our Global Opportunities Fund’s market-beating performance
- Highlighting why ‘quality’ matters too, not just ‘quantity’ when assessing a fund’s returns
- Taking you “inside baseball” on the quality metrics and explaining what they reveal about the Ophir Global Opportunities Fund
Our original Aussie Ophir Opportunities Fund recently celebrated entering its “teenage” years, after hitting its thirteenth anniversary.
But two of our “other children” – the Ophir Global Funds – also had birthdays this month:
- The Global Opportunities Fund turned 7 years old, delivering a standout +45.1% over the year to 30 September.
- The Global High Conviction Fund turned 5 years old, with an impressive +37.3% over the same period.
Both results sit well above our long-term target of +15% per annum across all Funds.
Of course, no investor should expect results like +45% or +37% every year, that would be setting yourself up for disappointment.
But +15% per annum is what we strive for and we’re proud to have delivered it, not just in our Global Funds but across all four Ophir Funds, over the long-term.
Ophir Fund’s Performance to 30 September 2025:
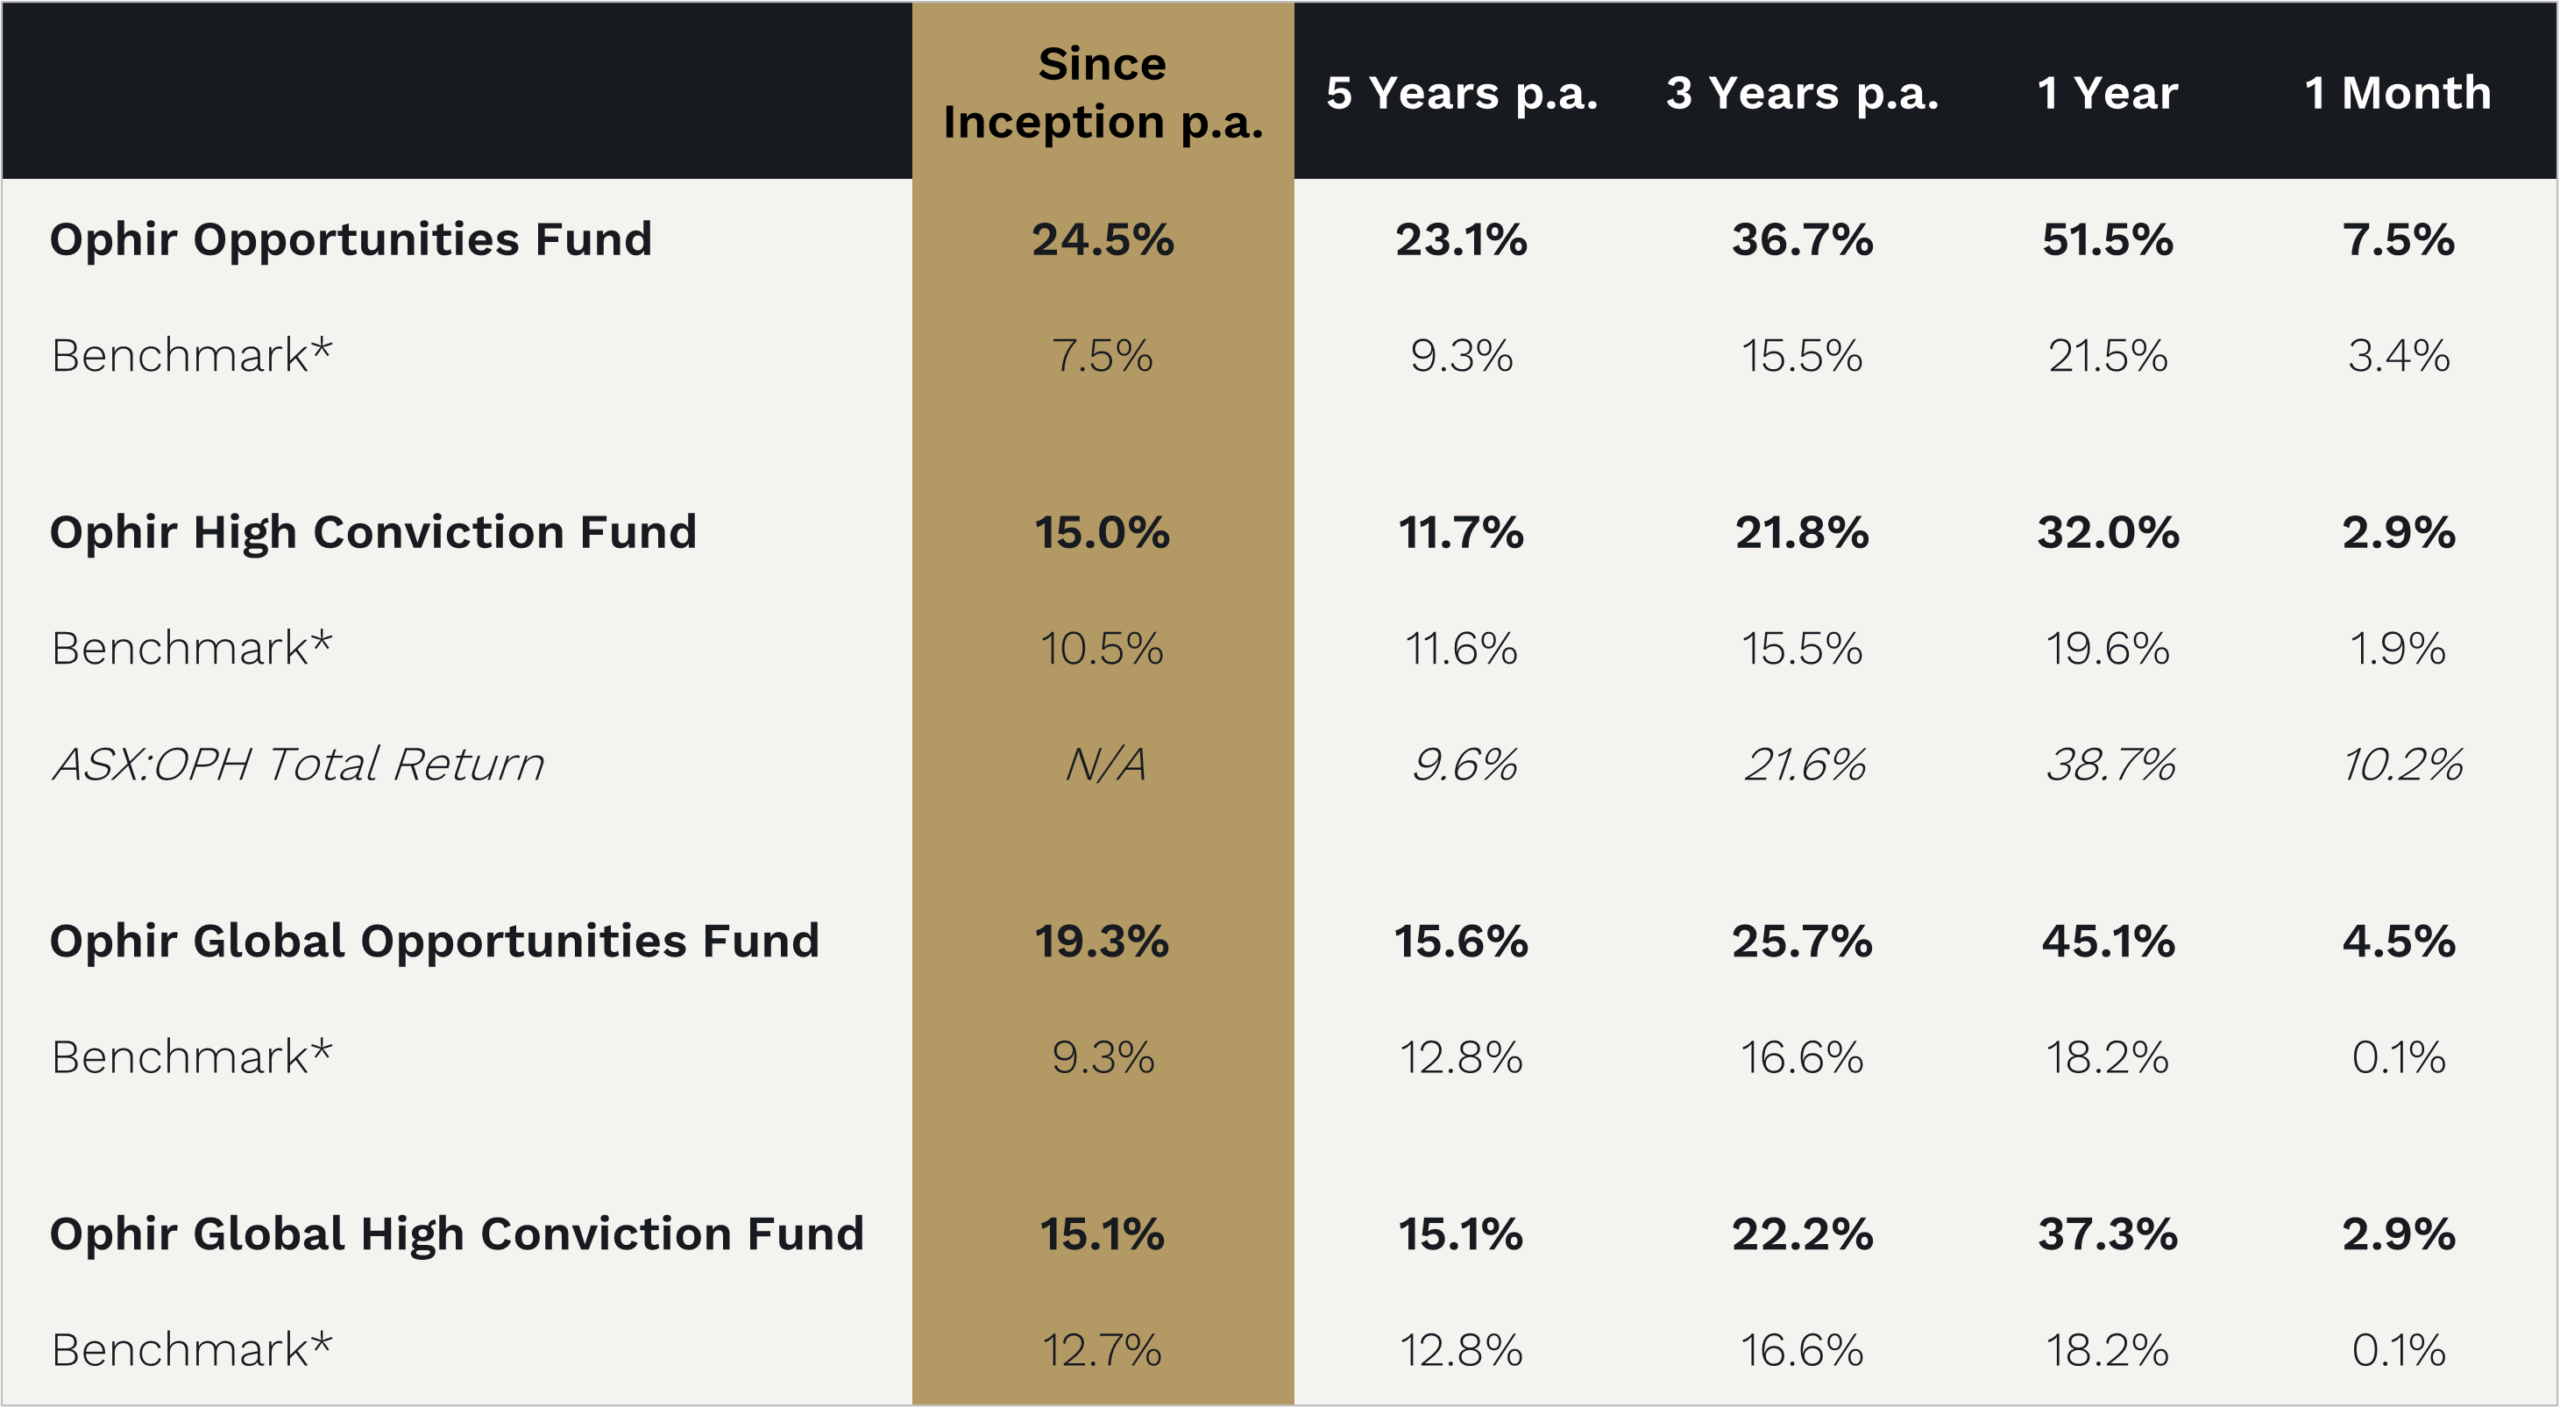
Source: Ophir, Citi. Benchmarks are: for the Ophir Opportunities Fund – ASX Small Ordinaries Index TR, Ophir High Conviction Fund – 50/50 ASX Small Ordinaries Index/ASX Mid Cap Index TR, Ophir Global Opportunities Fund and Ophir Global High Conviction Fund – MSCI World SMID Cap Index NR (AUD)
However, more pleasing than volatile one-year numbers are the longer-term returns from our Global Funds.
In particular, the older sibling of the two Global Funds, the Ophir Global Opportunities Fund, has now returned +19.3% per annum after fees since its birth seven years ago, beating its benchmark by 10% per annum.
A $100,000 investment in the benchmark would have grown by an additional $86,000, while the same investment in the Global Opportunities Fund has grown by $245,000 – nearly three times as much.
That’s the power of compounding at higher returns.
What’s Driving the Performance?
Below we share an updated version of the chart first introduced in our June Letter to Investors.
It highlights the factors behind the Global Opportunities Fund’s outperformance or underperformance compared with its benchmark.
Global Opportunities Fund – multi-factor performance attribution
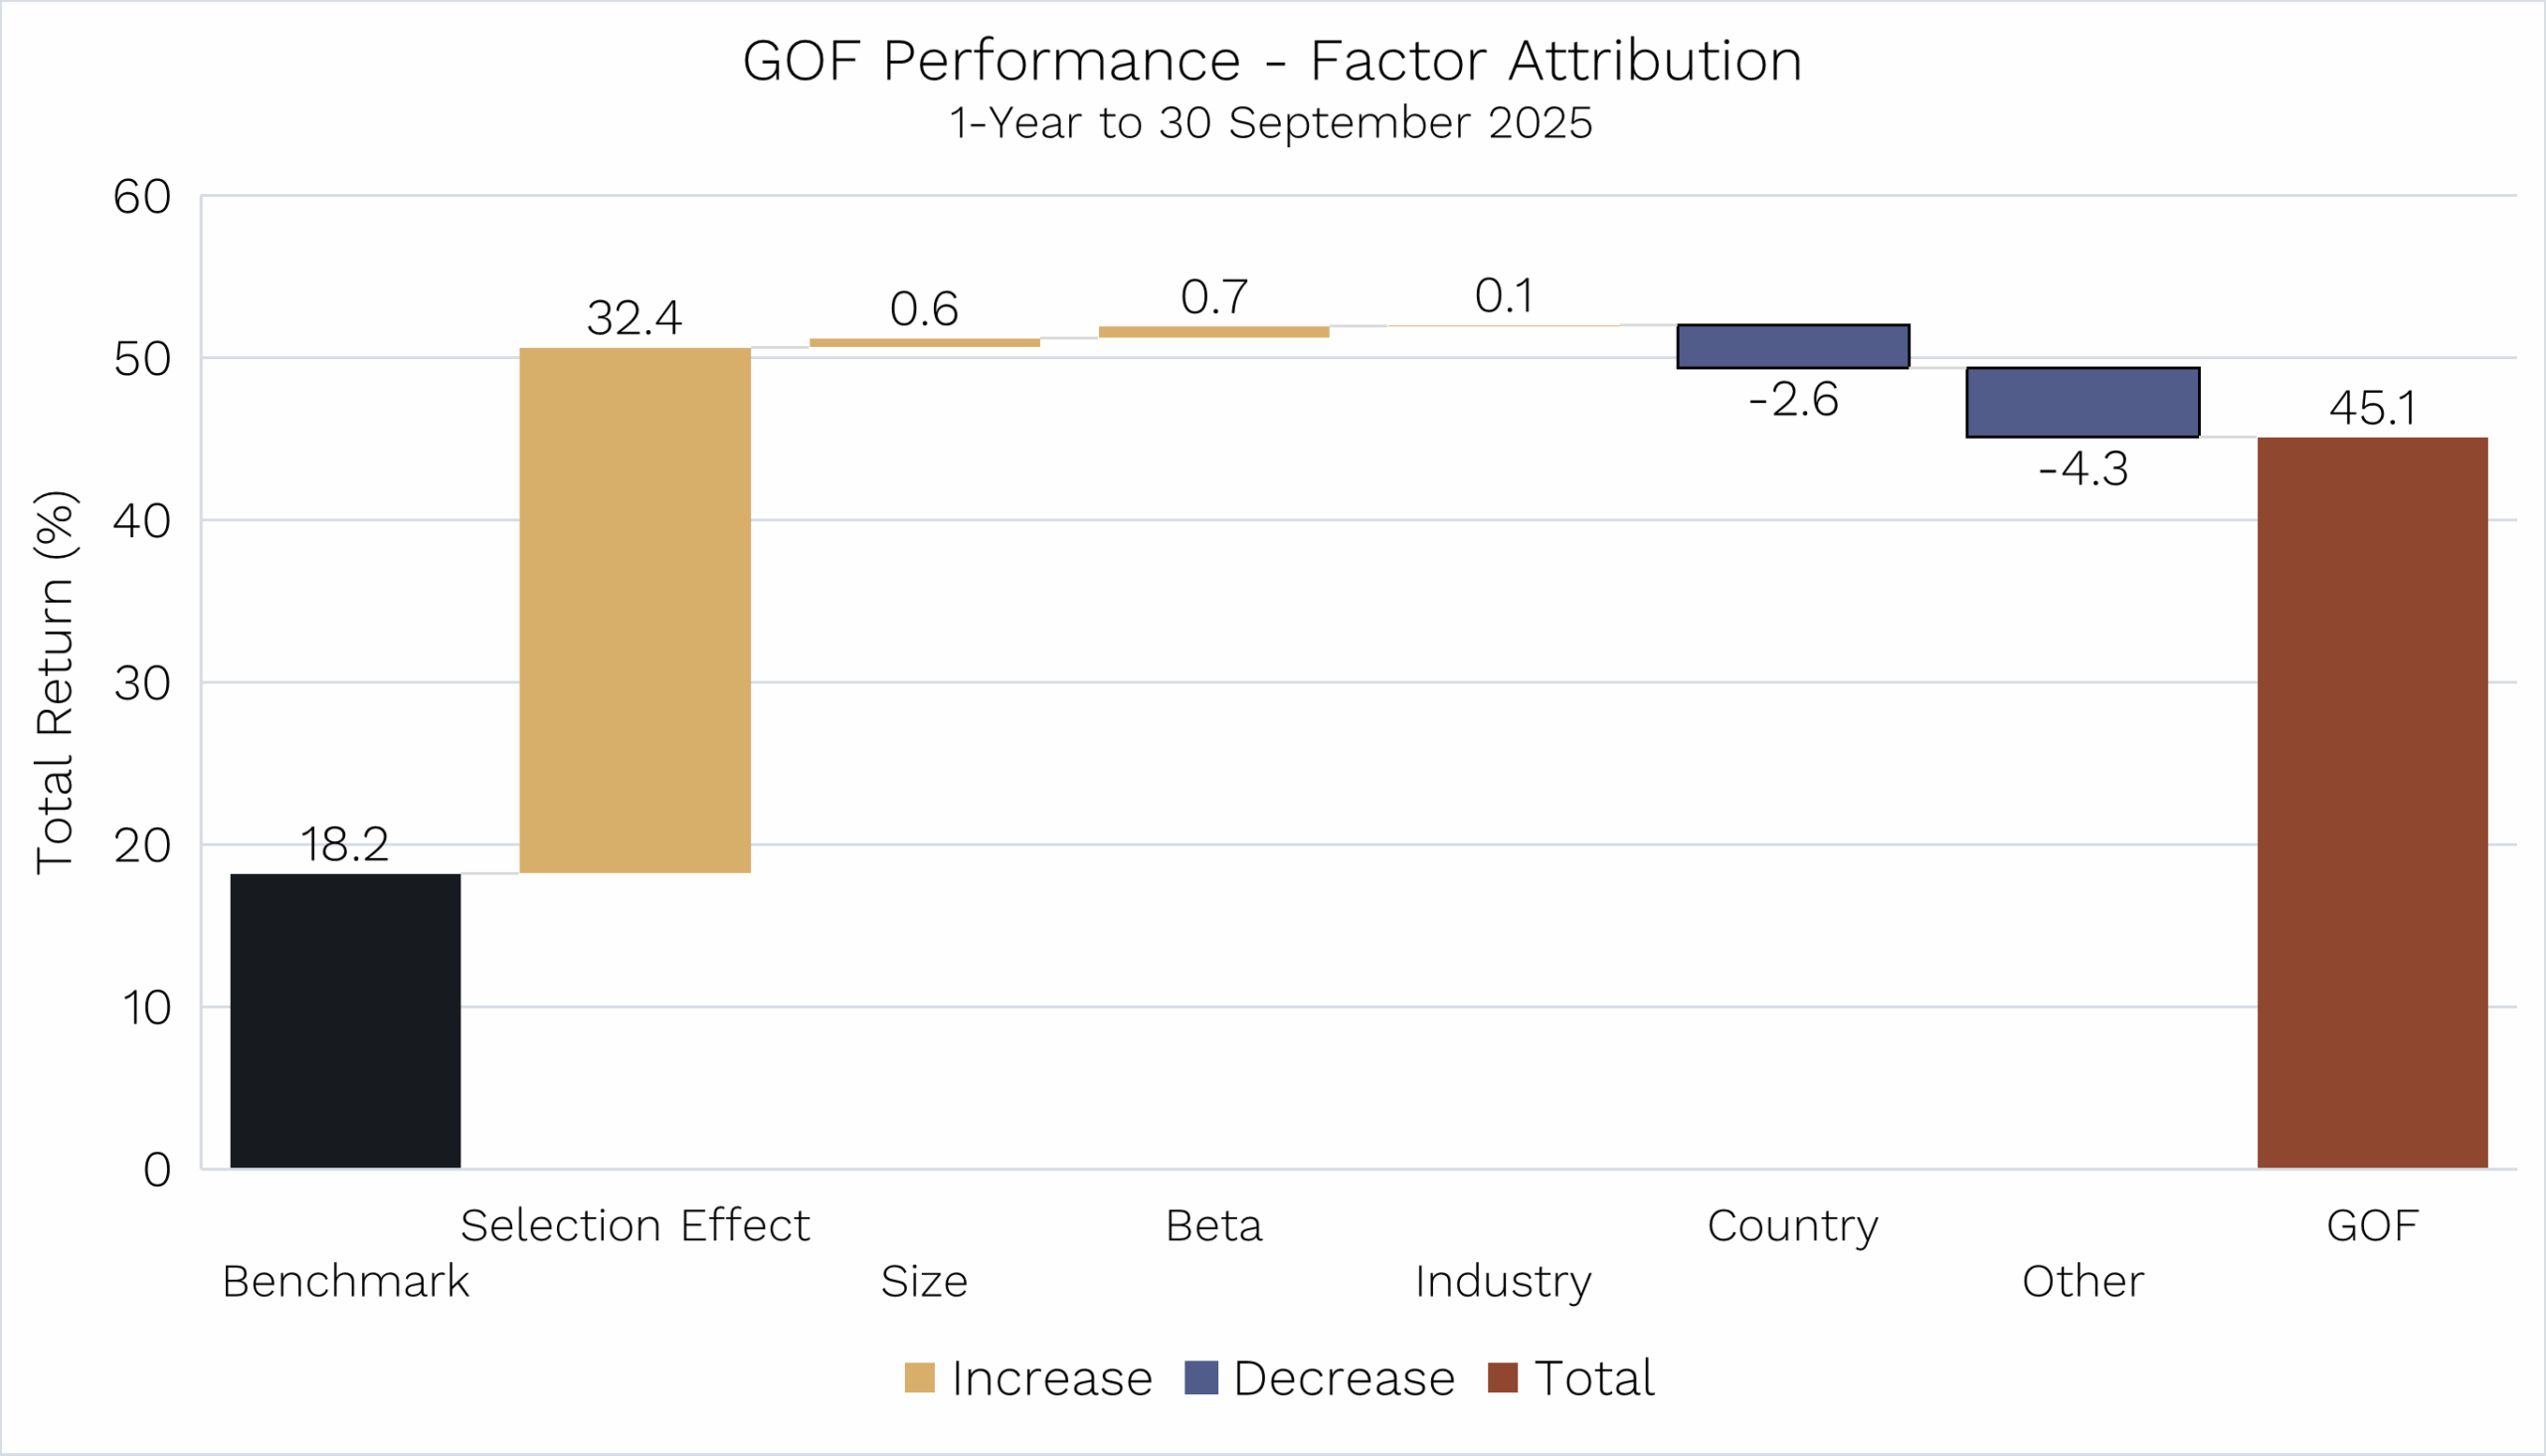
Source: Bloomberg. Data as of 30 September 2025. Benchmark MSCI World SMID Index NR (AUD).
As in our June Letter, the chart shows that for the Fund’s performance in the year to 30 September, +32.4% of the +26.9% outperformance (45.1% minus 18.2%), in other words more than 100% of it, was driven by Selection Effect.
Put simply, our outperformance didn’t come from factors like company size, market sensitivity (‘beta’), or industry and country allocation.
It came from stock picking.
That’s important, because it means our results aren’t just the by-product of tilting the portfolio toward common traits that anyone with a Bloomberg terminal could replicate.
Sure, it isn’t hard to assemble a 40-stock portfolio of U.S. small-cap consumer discretionary companies with certain characteristics and hope for the best. But history shows there’s little evidence that any one factor consistently outperforms over time. And when it does, market prices adjust quickly, wiping away the edge.
Instead, our outperformance comes from the long hours spent on the road, away from our families, meeting companies and digging into their ecosystems – competitors, customers, suppliers, even ex-employees.
This work helps us understand each company’s unique drivers and whether they’re likely to deliver results better than consensus expects.
We believe this, at least in part, is where our enduring edge over the market is.
Quality, Quality, Quality
When it comes to investment returns, quantity is what most people look at first. How much did you generate? Did you outperform or underperform? After all, you can only spend the returns you make.
But quality matters too.
Why? Because quality determines whether a manager’s returns are repeatable (or just luck) and how reliably they are delivered.
Some managers shine only in certain environments and struggle in others. That’s not the kind of consistency most investors want.
To measure quality in our Funds — here using the Global Opportunities Fund as the example — we track a range of key statistics.
The first three rows of the table below cover quantity: Fund returns, benchmark returns, and the difference between them (excess returns).
Then we move on to the quality measures, which reveal how consistent and sustainable those results really are.
Ophir Global Opportunities Fund Key Metrics:
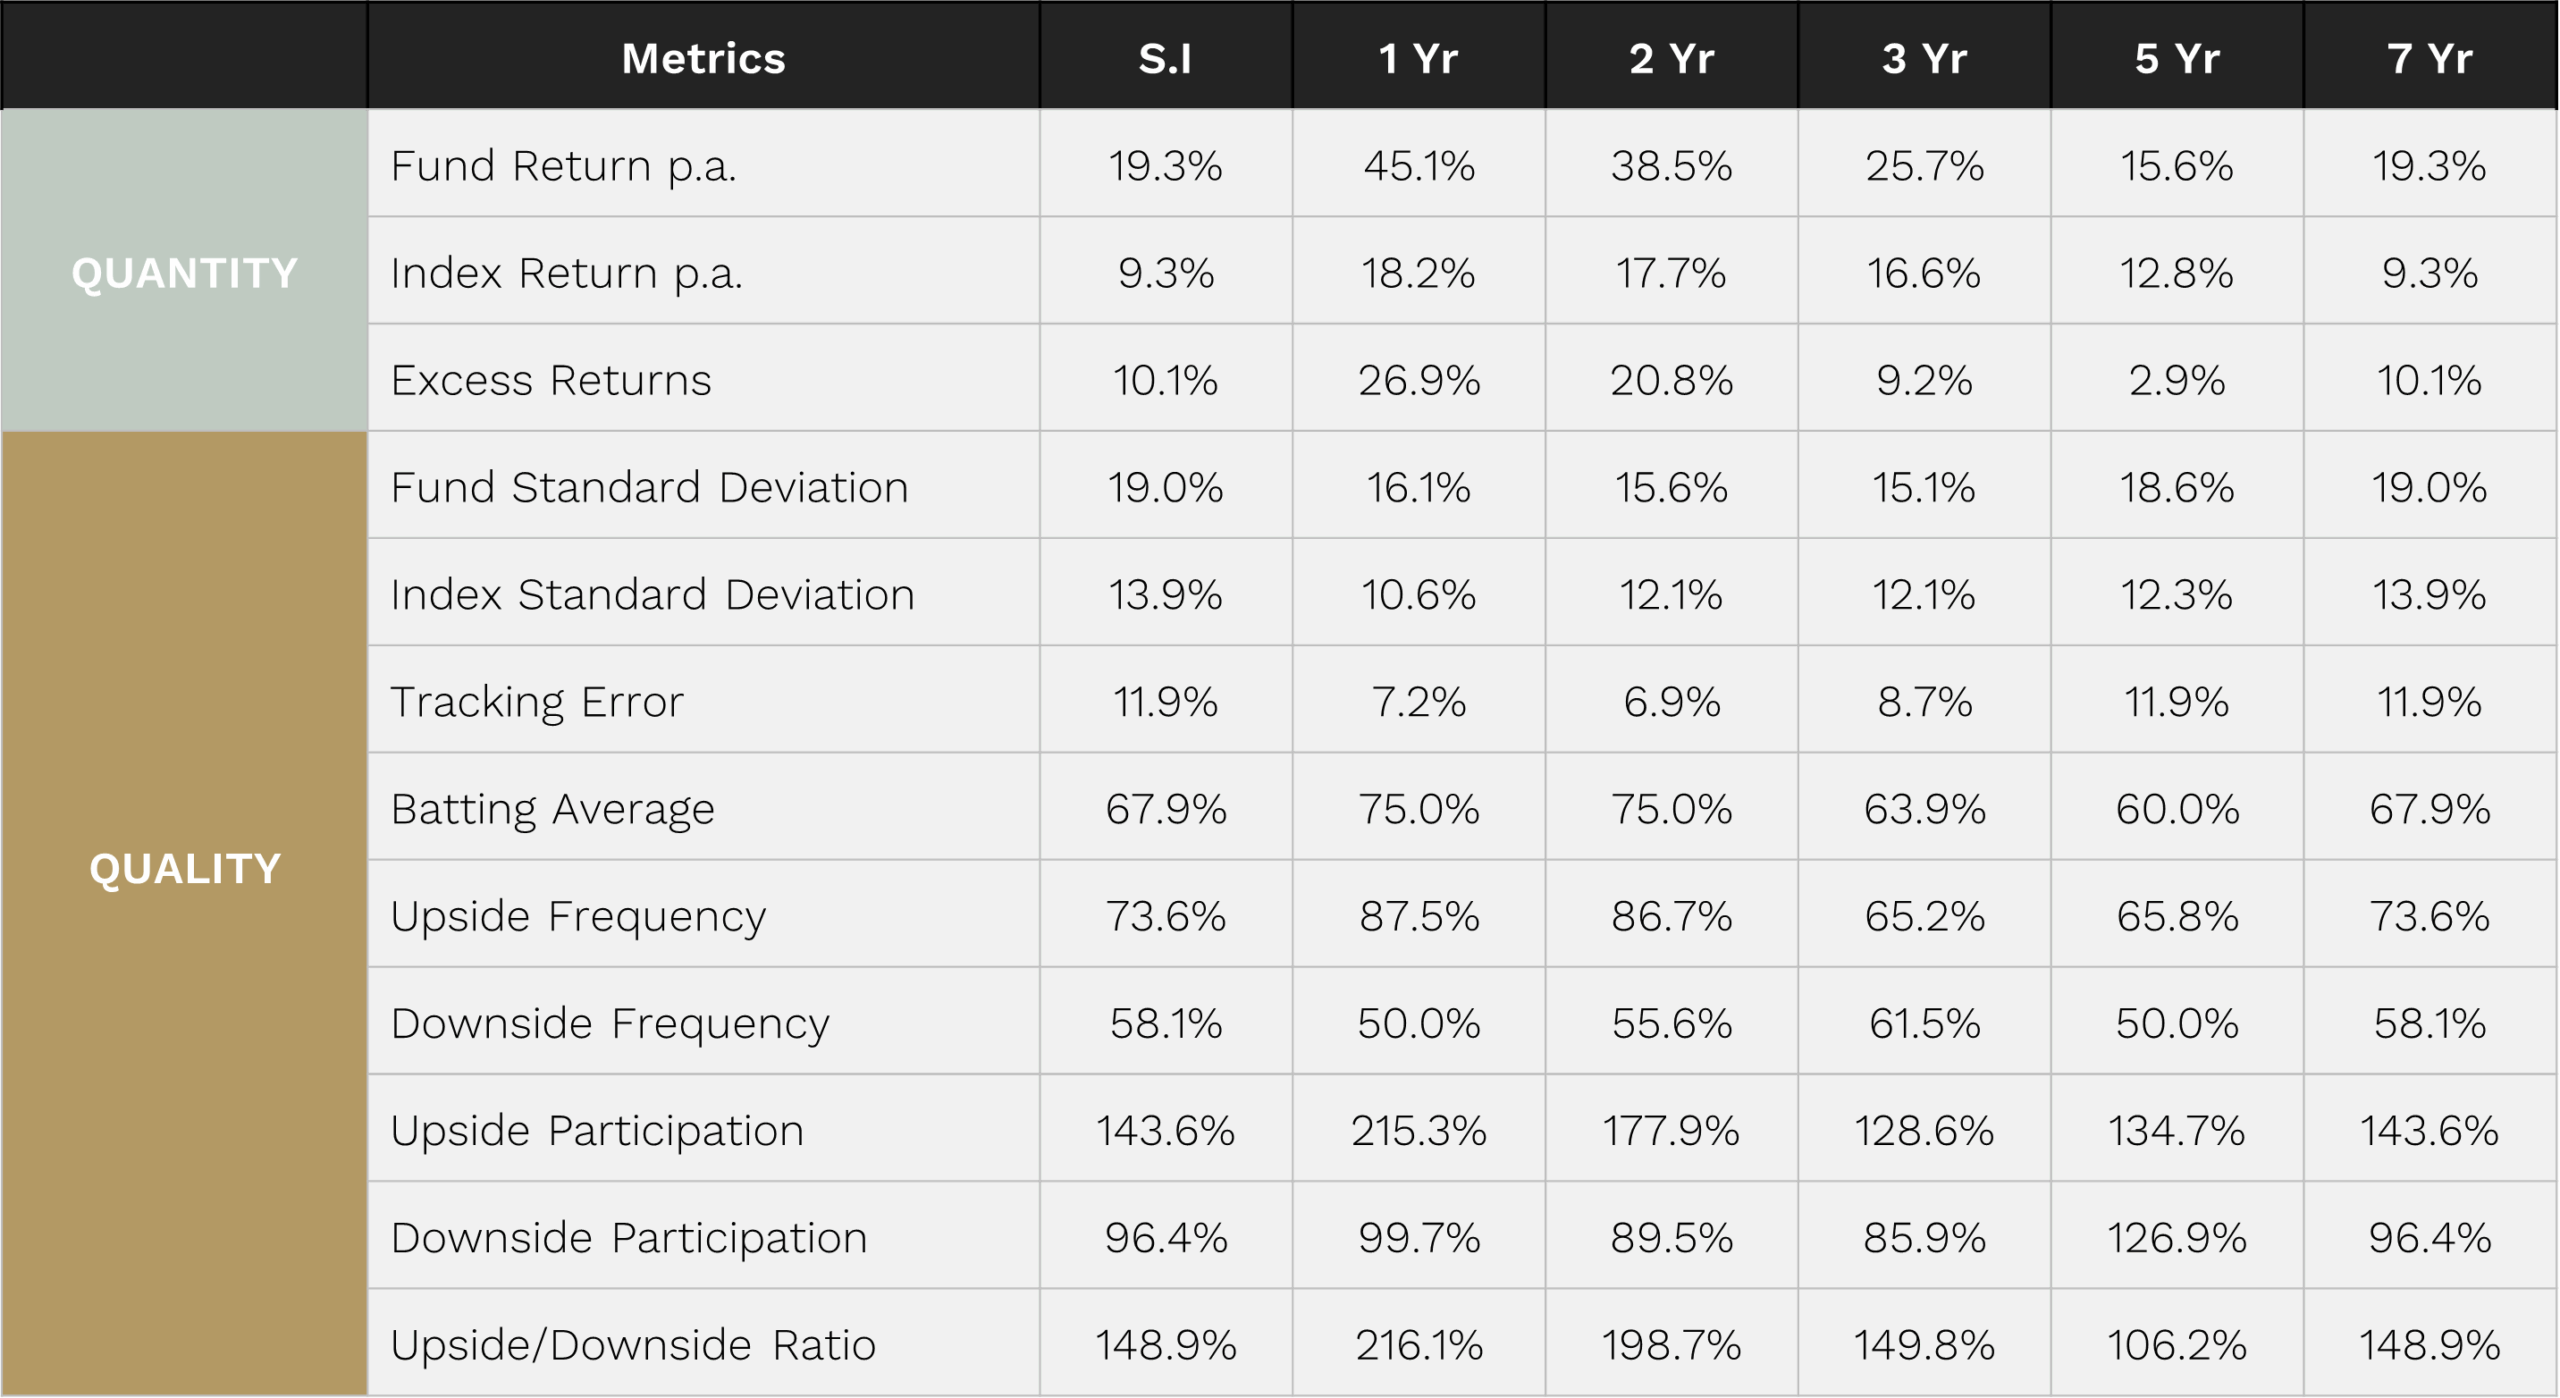
Benchmark: MSCI World SMID Cap Index NR (AUD). Inception October 2018. “S.I.” stands for Since Inception.
But those measuring quality include:
-
Standard Deviation
This measures volatility, that math term you might remember from high school, and shows how bumpy the return journey has been for the Global Opportunities Fund compared with its benchmark.
The higher the standard deviation, the bumpier the ride. And with a concentrated portfolio, that’s to be expected. Our benchmark covers nearly 5,000 small and mid-cap stocks globally, while the Global Opportunities Fund holds only 40–50.
That extra volatility is essentially the price of admission for trying to outperform such a broad universe of stocks.
-
Tracking Error
Now this might sound like a wonky finance term, but it’s simple: instead of measuring the volatility of the Fund’s returns, it measures the volatility of its outperformance or underperformance each month.
Everyone would love a nice, smooth outperformance ride every month. Bernie Madoff was one of the few people to produce that, and he went to jail! (because in reality his numbers were made up).
In reality, if two funds deliver the same headline performance, most investors would prefer the one that spreads it steadily across months, rather than giving it all in a single burst with flat or negative months elsewhere.
That’s what tracking error reveals: how smooth (or wild) the outperformance ride has been. And unless you’re a thrill junkie, the lower the better.
-
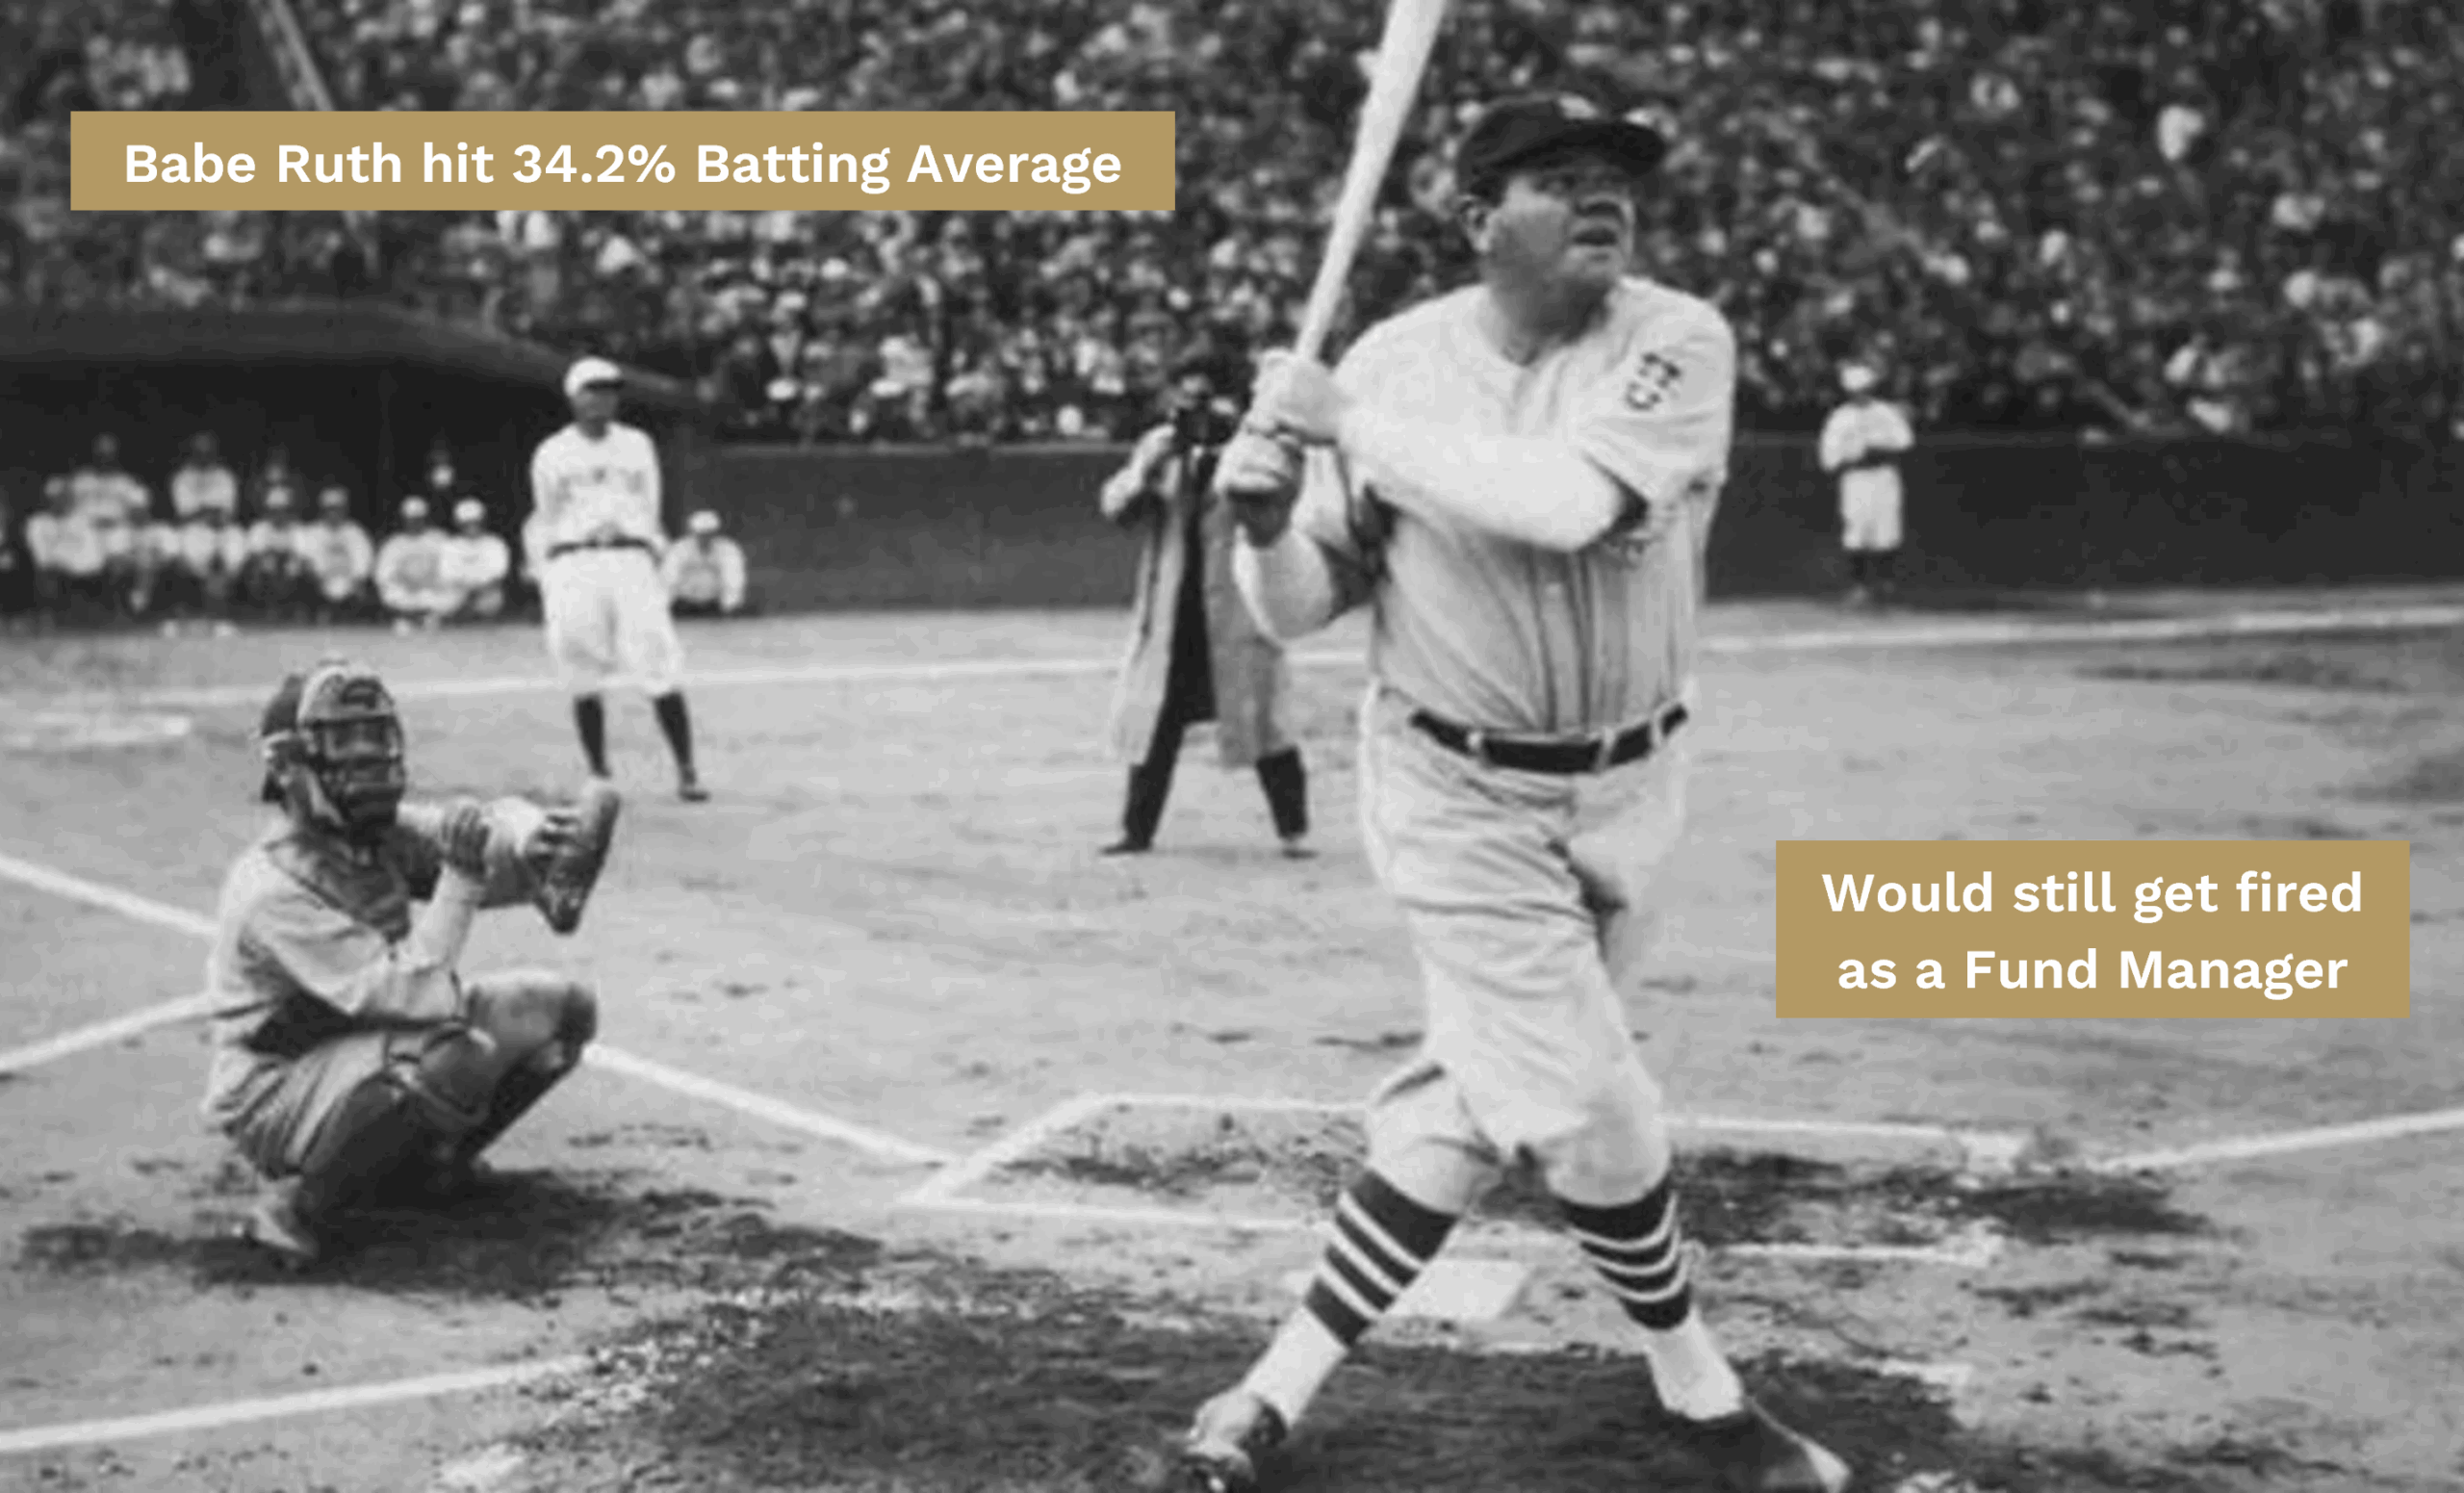
Batting Average
No, Aussie cricket fans, this one didn’t come from us. It’s borrowed from the Americans and their love of baseball.
Batting average measures the percentage of months the Fund has outperformed its benchmark. For example, a 75% batting average means outperformance in nine of twelve months.
Like tracking error, it’s a measure of consistency. In baseball, a .300 average (30% hits vs at-bats) is considered excellent.
In funds management, the benchmark is higher: a manager typically needs at least a 50% batting average to outperform over time.
Higher is better, and at above 60%, our Global Opportunities Fund is generally excellent.
-
Upside/Downside Frequency
This metric takes batting average a step further. It shows how often the Fund outperforms when the market is up (upside frequency) and when the market is down (downside frequency).
Think of it like a baseball player: “Sure, you’ve got a 30% batting average overall. But what’s your average when you’re facing a fastball versus a slow ball?”
Some batters struggle against certain pitches, just as some fund managers struggle to outperform in down markets or during selloffs.
For our Global Opportunities Fund, the Upside Frequency is higher than the Downside Frequency. In other words, we outperform more often in rising markets than falling ones, but still tend to outperform in both environments.
-
Upside/Downside Participation
This metric goes one step further. Instead of showing how often we outperform in up or down markets, it reveals by how much.
To stick with the baseball analogy: “It’s not just whether you hit the fastball or the slow ball — it’s how many bases you get when you connect.”
Since inception, the Ophir Global Opportunities Fund has shown:
-
When the market rises +1% in a month, the Fund has risen +1.43% on average (143% upside participation).
-
When the market falls –1%, the Fund has fallen only –0.96% on average.
In short: we outperform by more in up-market months than we do in down markets.
And that’s a good thing, because over the long term, markets rise more often than they fall. In fact, 63% of the months for our benchmark have been up since our Global Opportunities Fund started in 2018.
Celebrating a Great Birthday
As unfair as it might feel to put one of your “children” under the microscope on their birthday, we hope this has given you a clearer view of the quality behind the Global Opportunities Fund’s returns.
Since its launch in 2018, the Fund has delivered +19.3% per annum after fees, beating its benchmark by +10.0% per annum. It ranks No.1 in Australia for performance in the Global Small/Mid Cap asset class since inception (Morningstar data).
Yes, the ride has been a little more volatile than the market, but that comes with running a concentrated portfolio. And while we’ve outperformed the market more than half the time on a monthly basis, the real story is that we’ve done so more often and by a greater margin in up-market months than down ones.
And with that, we want to sincerely thank the whole Ophir team for making this a great birthday to celebrate.
There will, no doubt, be tougher birthdays ahead, and we must remember that. As a retired CEO once told us, the times you remember most in your working life are the tough times, and how you came through them together.
2022 was one of those times. And looking back on our 13-year journey, it’s the year we’re most proud of, because we came together, we got better, and we pulled through.
Finally, a heartfelt thank you to you, our investors. Without your support, there would be no birthdays for our Funds.
As always, thank you for entrusting your capital with us.
Kindest regards,
Andrew Mitchell & Steven Ng
Co-Founders & Senior Portfolio Managers
Ophir Asset Management
This document has been prepared by Ophir Asset Management Pty Ltd (ABN 88 156 146 717, AFSL 420082) (“Ophir”) and contains information about one or more managed investment schemes managed by Ophir (the “Funds”) as at the date of this document. The Trust Company (RE Services) Limited ABN 45 003 278 831, the responsible entity of, and issuer of units in, the Ophir High Conviction Fund (ASX: OPH), the Ophir Global Opportunities Fund and the Ophir Global High Conviction Fund. Ophir is the trustee and issuer of the Ophir Opportunities Fund.
This is general information only and is not intended to provide you with financial advice and does not consider your investment objectives, financial situation or particular needs. You should consider your own investment objectives, financial situation and particular needs before acting upon any information provided and consider seeking advice from a financial advisor if necessary. Before making an investment decision, you should read the relevant Product Disclosure Statement (“PDS”) and Target Market Determination (“TMD”) available at www.ophiram.com or by emailing Ophir at ophir@ophiram.com. The PDS does not constitute a direct or indirect offer of securities in the US to any US person as defined in Regulation S under the Securities Act of 1993 as amended (US Securities Act).
All Ophir Funds are deemed high risk within their respective Target Market Determination documentation. Ophir does not guarantee the performance of the Funds or return of capital. An investment may achieve a lower than expected return and investors risk losing some or all of their principal investment. Past performance is not a reliable indicator of future performance. Any opinions, forecasts, estimates or projections reflect our judgment at the date of this was prepared, and are subject to change without notice. Rates of return cannot be guaranteed and any forecasts, estimates or projections as to future returns should not be relied on, as they are based on assumptions which may or may not ultimately be correct.
Actual returns could differ significantly from any forecasts, estimates or projections provided.
The Trust Company (RE Services) Limited is a part of the Perpetual group of companies. No company in the Perpetual Group (Perpetual Limited ABN 86 000 431 827 and its subsidiaries) guarantees the performance of any fund or the return of an investor’s capital.