Spin cycle: October’s washing machine market
In this Letter to Investors, we look at:
- The RBA’s Cup Day hike, why that could be the last of this cycle, and what that means for a small-cap rebound.
- How Aussie small caps became the cheapest against large caps in 17 years.
- The wildest tech swings since the dot-com bubble, and how that drove the biggest month for Value over Growth in the US in three decades.
- What US small caps have done after the last 16 midterm elections, and why the Washington gridlock after Trump’s midterm ‘shellacking’ isn’t necessarily bad news for stocks.
- A reminder that, despite market mayhem and movement, two Ophir Funds still rank No.1 and No.2 of 495 Australian and global share funds since 2018.
The first Tuesday in November is the day Australia stops for a horse race.
This year the Reserve Bank of Australia (RBA) beat the horses to the jump. Half an hour before the Melbourne Cup, the RBA lifted the cash rate by +0.25% to 4.85%, the fifth hike of 2026 and taking rates to their highest level since 2008.
That night, while the Cup winner was still being hosed down, America voted. Within a day, the Democrats had taken the House and the Senate from the Republicans.
Both matter for small caps, and we’ll come back to them.
But we’ll first look at October, which ran like a Cup race where every favourite faded in the straight.
The favourites faltered
For most of 2026 the favourites were anything touching artificial intelligence (AI): chips, memory, data centres and the companies that build and power them.
Then in October, the market turned on them – with a vengeance. US semiconductor stocks fell around -17%. The Nasdaq Composite dropped -5.3%, its worst month since March 2025.
The US 10-year Treasury yield, last month’s villain, fell back below 5%.
And energy stocks rose more than +10%, as Brent crude climbed +11% to around US$113 a barrel amid ongoing Iran-war tensions and investors treated the sector as a safe haven.
The S&P 500 set a record high on 6 October and, despite the AI carnage, the index managed to finish the month just -0.9% lower.
But while the S&P 500 barely moved, underneath the churn was extraordinary.
On Société Générale’s count, about four in ten of the 124,750 possible pairs of S&P 500 stocks (all the pairs possible amongst the 500 names) have been negatively correlated over the past year, far more than the norm since 1995.
When stocks move against each other like this rather than together, it is rotation – investors moving from one type of stock to another – rather than selling. Think of a washing machine: the drum spins hard and the clothes churn and collide, but the machine itself never moves from its spot on the floor.
During the month, global small caps were not the problem. The Russell 2000 rose +0.5%. Our global benchmark, the MSCI World SMID Cap Index, was up roughly +1.5% in US dollars. (Though a +1.4% rise in the Australian dollar to around US$0.70 trimmed that to +0.1% for unhedged Australian investors.)
However, Australia – both small and large cap – was the odd market out.
The ASX 200 outperformed the S&P 500, rising +1.4% as banks, utilities and healthcare rallied.
But the ASX Small Ordinaries underperformed its global peers, falling -6.4%, dragged down by gold and mining stocks. Aussie small caps lagged the local big end of town by nearly 8 percentage points in a single month, the biggest since April 2013.
The RBA hike was a clear factor – more on that later.
How our Funds fared
All four of our Funds underperformed in October. That hasn’t happened for a long while, and we don’t like it one bit.
- The Ophir Opportunities Fund returned -6.9% net of fees against -6.4% for its benchmark, an underperformance of -0.5%. (Since inception in August 2012, the Fund has returned +22.0% per annum after fees.)
- The Ophir High Conviction Fund returned -4.4% net of fees, -1.6% behind its benchmark’s -2.8%. The ASX-listed units (ASX: OPH) returned -6.3%.
- The Ophir Global Opportunities Fund returned -3.3% net of fees against +0.1% for its benchmark, the MSCI World SMID Cap Index (NR, AUD), an underperformance of -3.4%. (Since inception in October 2018, the Fund has returned +17.4% per annum after fees.)
- The Ophir Global High Conviction Fund returned -3.8% net of fees, -3.9% behind the same benchmark.
October is a quiet month for company results, so almost none of this came from earnings news. Instead, the underperformance came from our Funds’ positioning in three ways:
-
The factors we always carry
Our Global Funds own growing companies, with the average holding growing earnings at around +20% a year. But since the end of June, within our global benchmark, Value has beaten Growth by around 11 percentage points, with October contributing about half of that difference. Size hurt too: the A$20 billion to A$50 billion end of the index outperformed, while our average holding is around A$6 billion.
-
Our AI holdings fell harder than their history said they should
We hold AI-related companies at close to index weight because we don’t believe we have an edge in calling the AI cycle. In October, the beta of our holdings (how much they move for a given move in the market) was above its past level. That cost us roughly another 1%.
-
The junk rally
And, thirdly, the stocks that rose most in October were the least-owned ones: companies that have been missing earnings and will probably miss again next year. In a rotation this violent, money comes out of what has worked and into what hasn’t, and for a few weeks earnings don’t matter. We don’t own those junk companies, by design. That was the single biggest reason we lagged.
One bright spot: CareDx, our best global performer, rose +34.5% after another guidance upgrade. We presented it in June at an investor event when it was US$22 a share. It is around US$88 at the time of writing.
Cup Day hike: have rates peaked, and have small caps bottomed?
Back to the Reserve Bank.
As mentioned, five hikes in 2026 have taken the cash rate from 3.60% to 4.85%. Aussie small caps have felt every one of them.
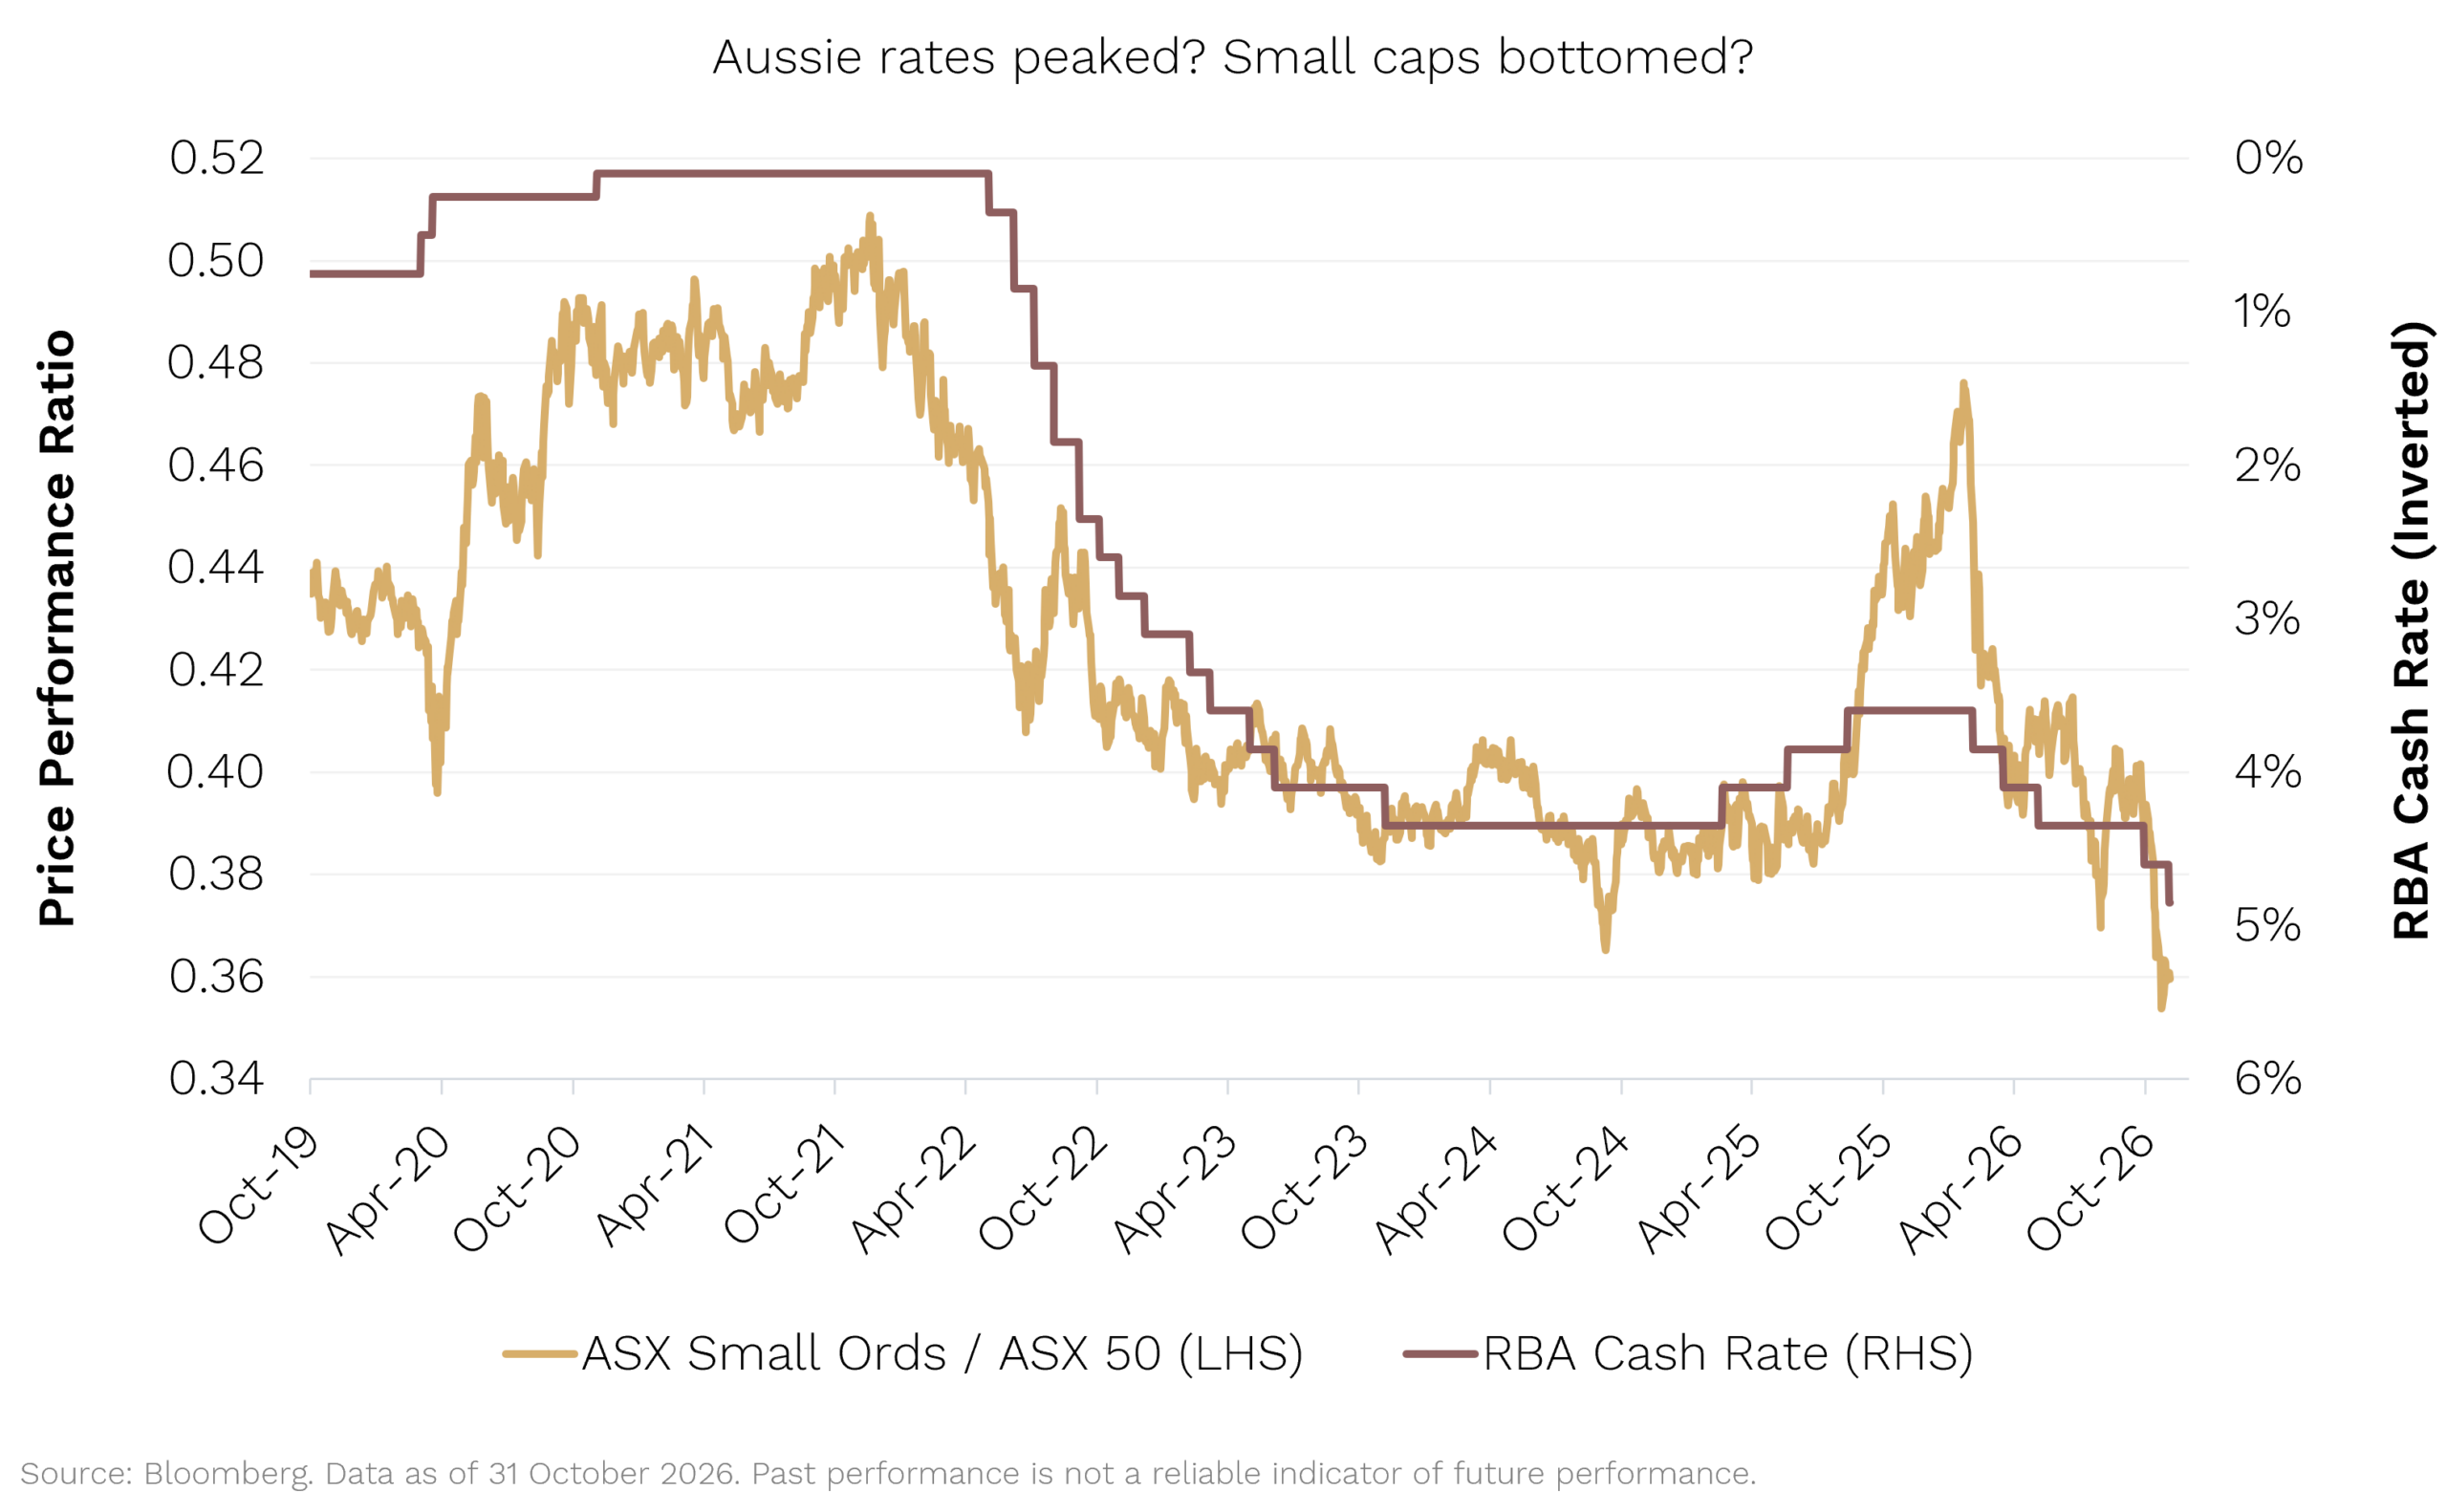
The chart above shows how Australian small caps have performed against large caps (the ASX Small Ordinaries divided by the ASX 50, left axis) alongside the RBA cash rate (right axis).
The cash rate is plotted upside down, so when the maroon line falls, rates are rising.
As you can see, the 2022 to 2023 hikes crushed Australian small caps relative to large; the brief cutting phase in 2025 saw small caps rip; and now the 2026 hikes have sent them to their lowest point against large caps in the seven years shown.
Why are Aussie small caps so rate sensitive relative to large? The big four reasons are:
- They have longer ‘duration’ cash flows (cash flows arrive later, so valuations are more sensitive to rate moves).
- They typically have more floating rate debt.
- They are less diversified and generally more domestically economically sensitive.
- They command a liquidity and risk premium so often get sold before large caps when financial conditions tighten.
Which brings us to THE question for Aussie small-cap investors: was Cup Day the last hike?
The market thinks so, and so do most economists: house prices are falling, unemployment has risen to 4.7% and three of the nine RBA board members voted to hold. The RBA still expects inflation to stay elevated through much of 2027, so cuts are not imminent.
But it’s important to remember that small caps don’t wait for the first cut. They move on the expectation of cuts, as when they bottomed in 2024 before 2025’s rate cuts.
And any Aussie small cap rally would be helped by the fact they are starting from a very low base.
The chart below shows how expensive Australian small caps are compared with large caps (the forward P/E of the ASX Small Ordinaries minus the forward P/E of the ASX 200).
When the line is below zero, small caps are trading at a discount.
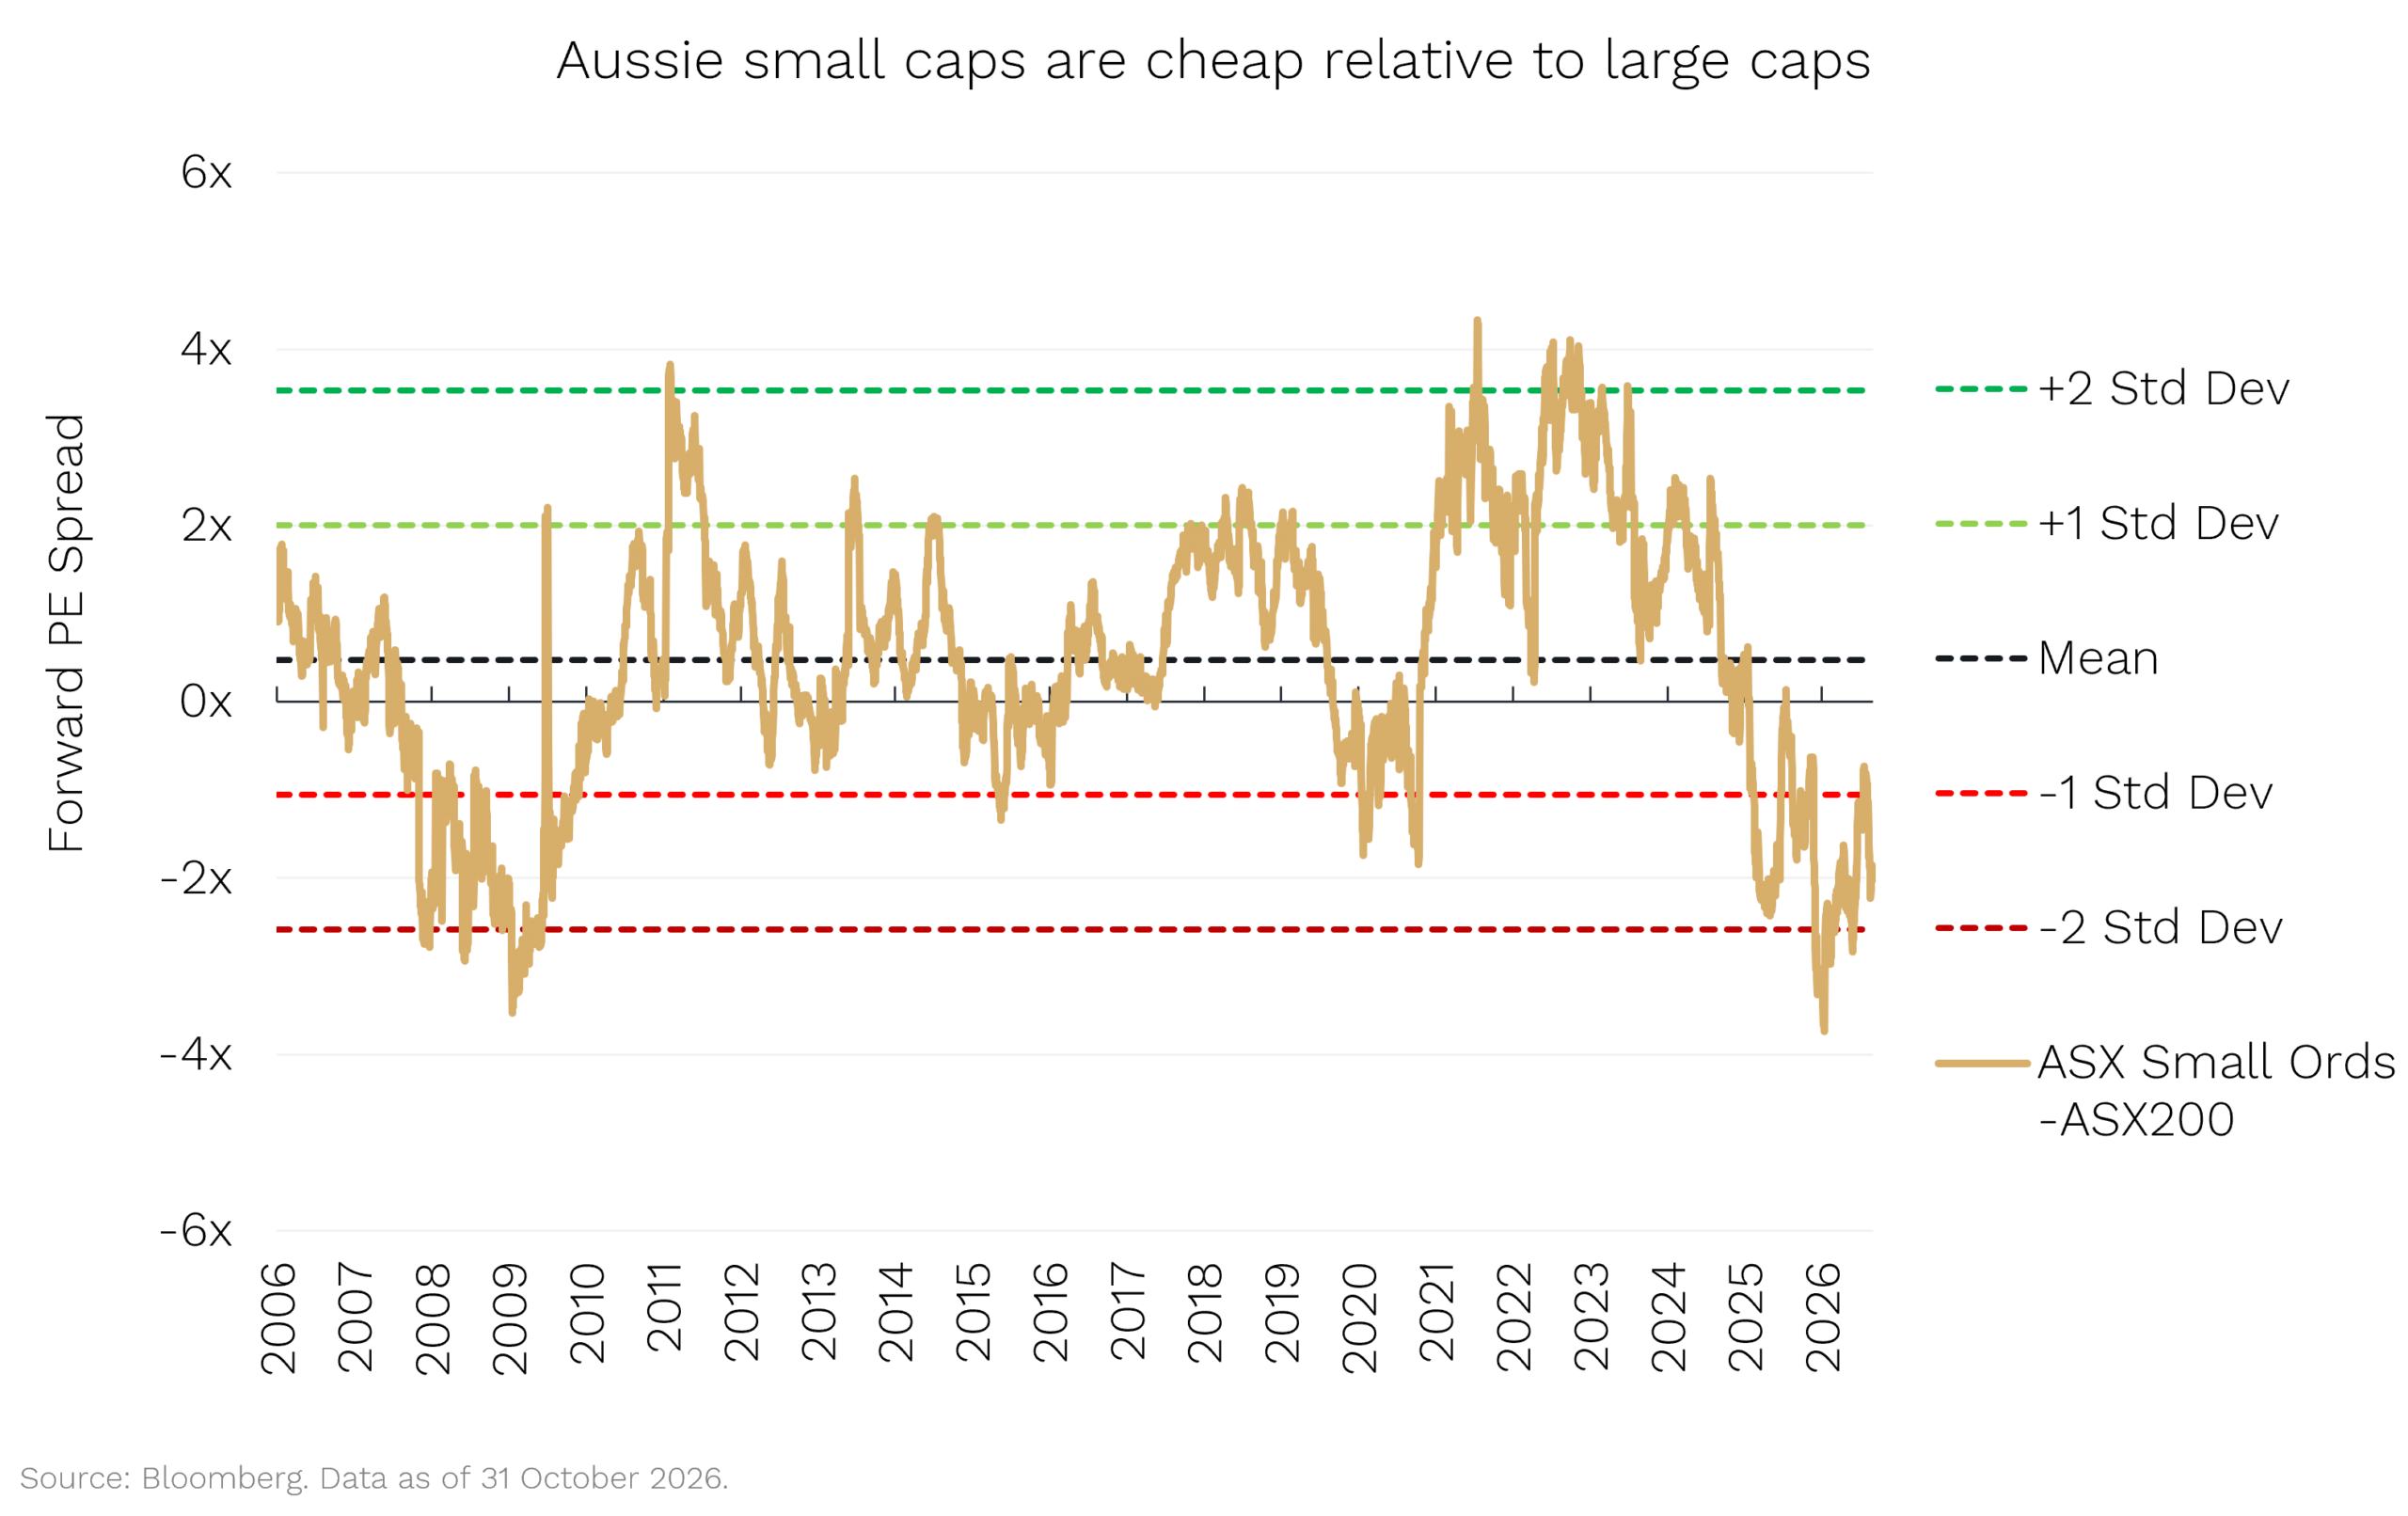
Aussie small caps now trade on a forward P/E (price-to-earnings ratio) around two points BELOW the ASX 200: roughly 15 times earnings against 17-18 times for the big end of town.
That discount is almost two standard deviations below its 20-year average and near the widest since 2009, in the depths of the GFC (Global Financial Crisis).
The last time the discount was this wide, small caps went on to outperform large caps for the next two years by more than 50%.
(As we’ve highlighted before, RBA rate hikes also tend to be a headwind for discounts to NTA for Listed Investment Vehicles like our Ophir High Conviction Fund (ASX: OPH). We also know that, like 2020 and 2025, RBA rate cuts tend to be a tailwind for the OPH discount to NTA to narrow, or a premium to emerge.)
Bottom line: if Cup Day was the peak in rates, history says Aussie small caps have done most of their underperforming, and they start from the cheapest point against large caps in 17 years.
It’s dynamite: the wildest tech swings since 1999
Now to the global picture, where October’s real drama played out with AI stocks cratering.
What drove the AI sell-off?
Alphabet’s earnings miss on 29 October, which wiped roughly US$1 trillion off chip stocks the following day, and a shocker from Intel (down 29% in a single session).
And that led to very wild swings.
The chart below counts the days each year on which the technology, media and telecom (TMT) momentum basket moved 5% or more in a single session. The basket is essentially a bet on the AI winners against the AI losers.
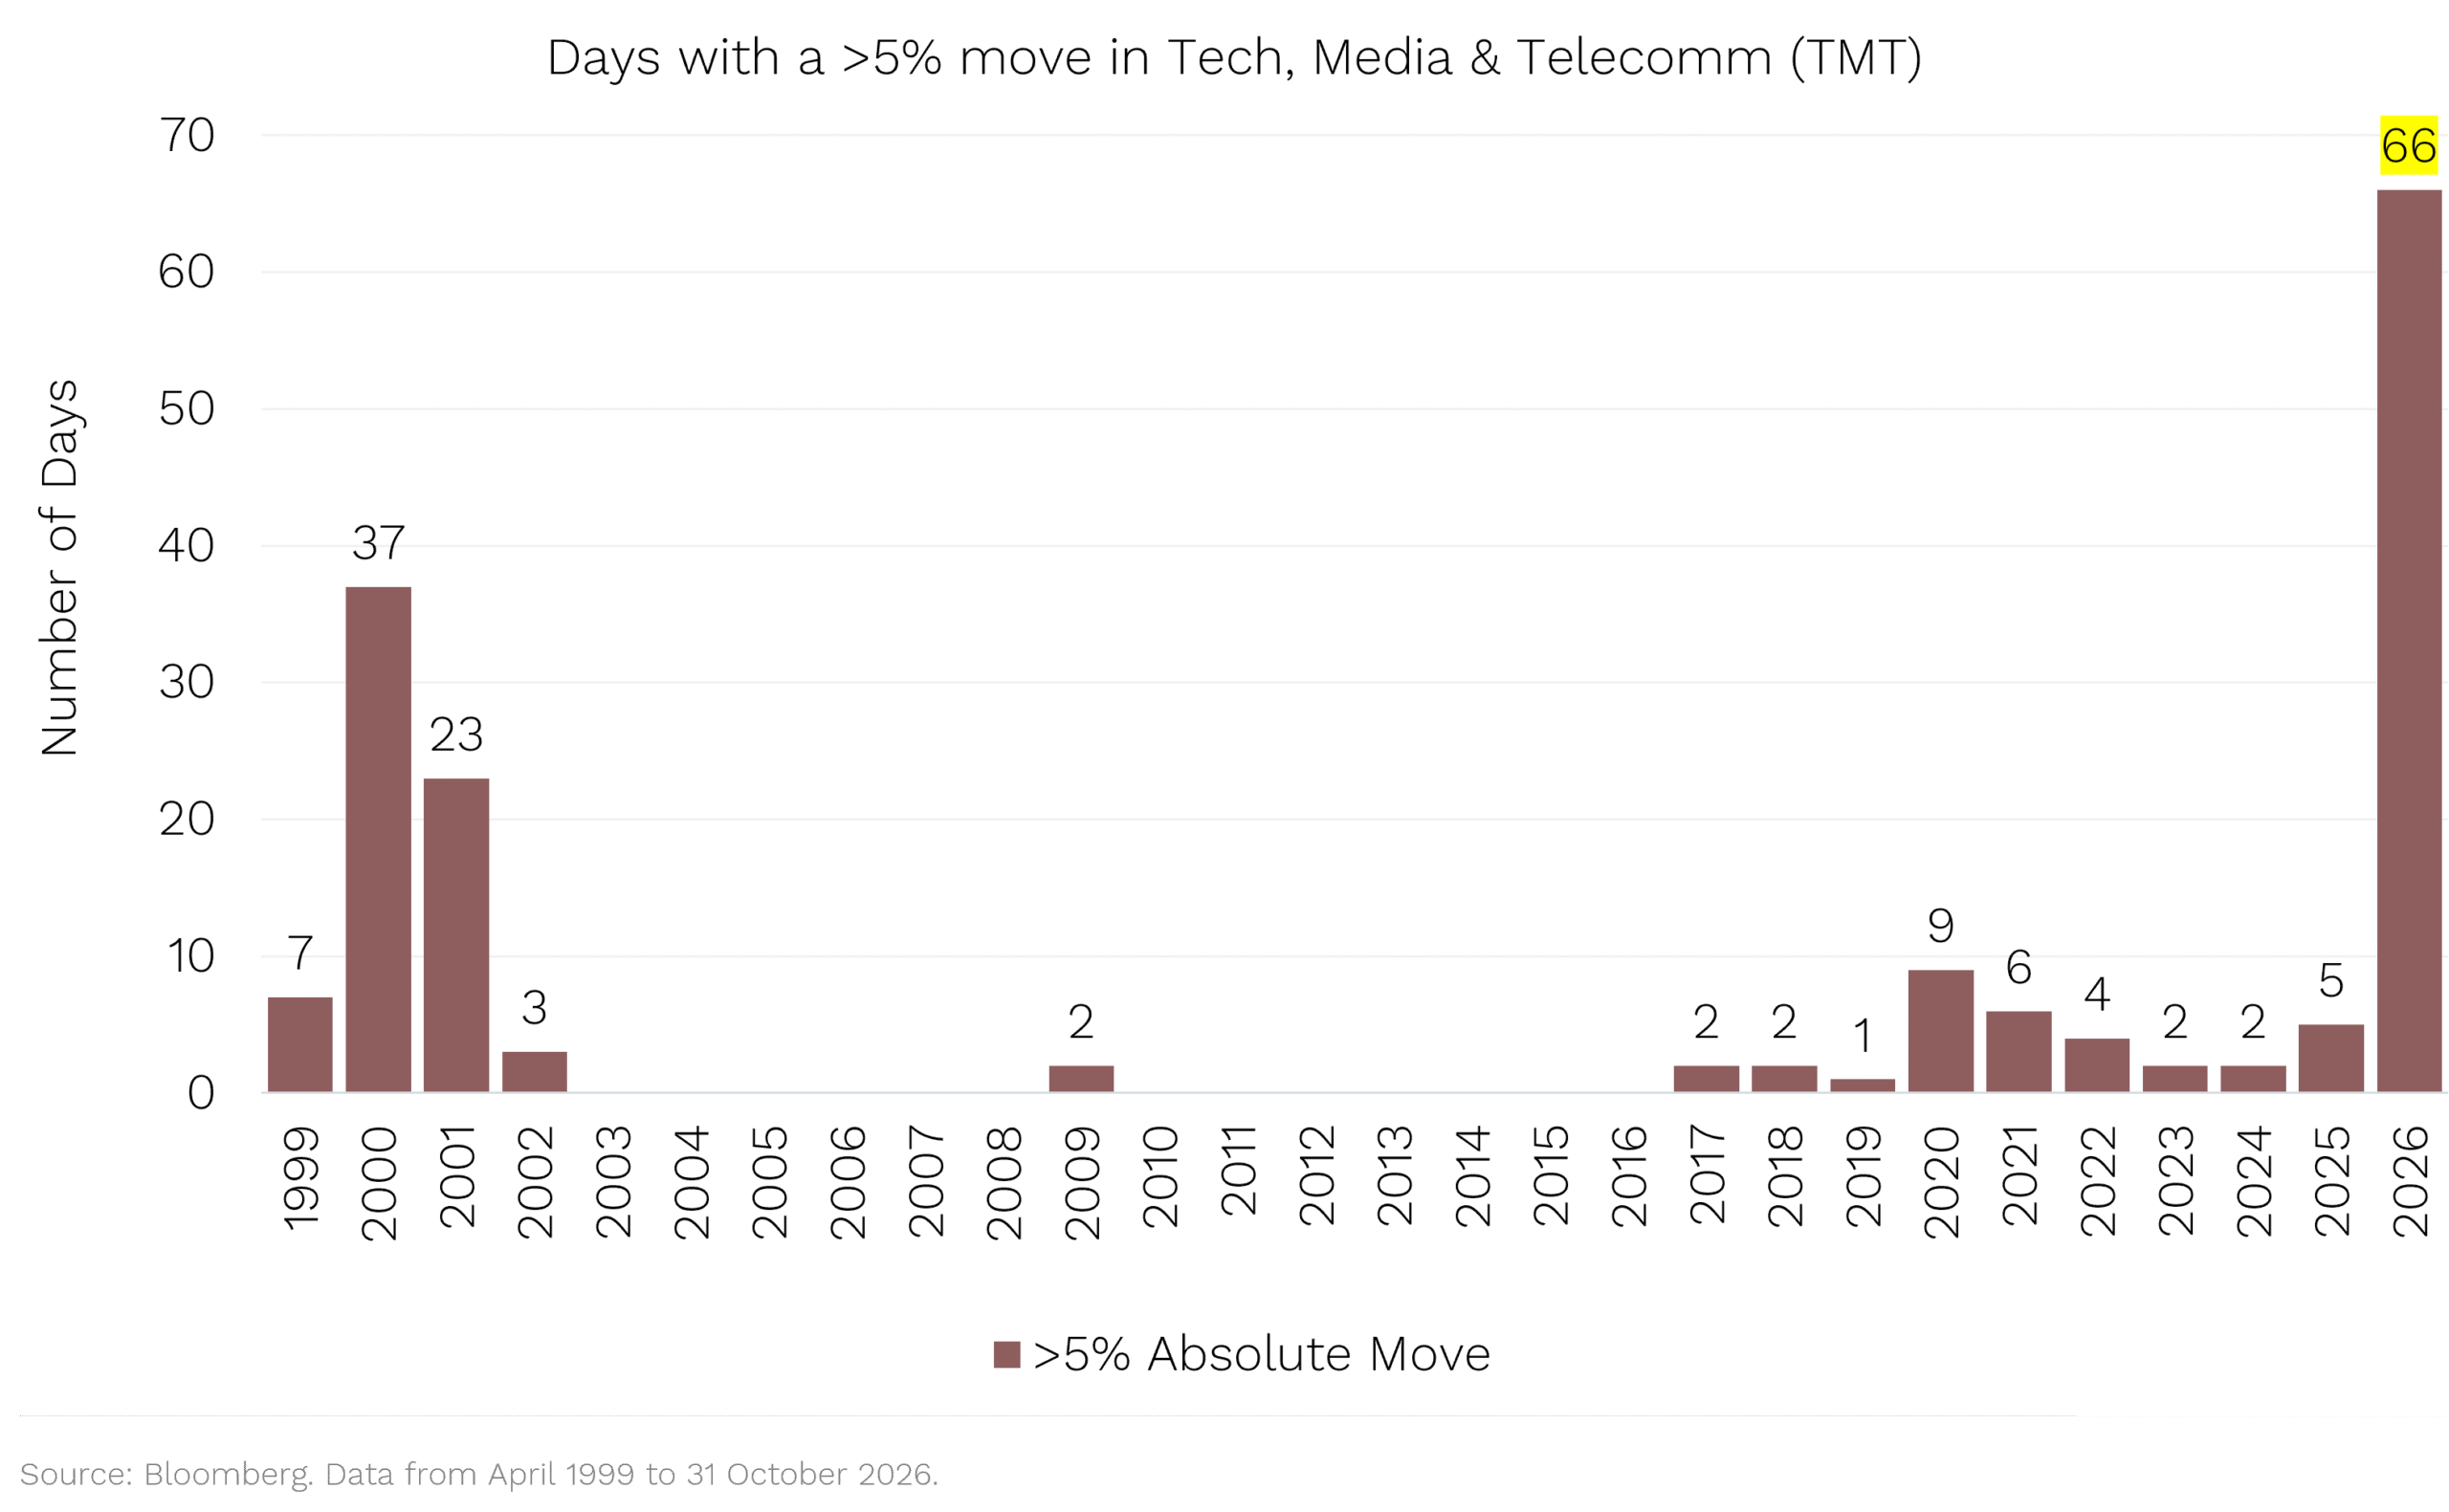
So far in 2026, there have been 66 such days, roughly one trading day in three. The previous record was 37, set in 2000 as the dot-com bubble burst.
What is the market telling us? Basically, that it has no idea. Mr Market wakes up one morning convinced AI capital spending will pay for itself, and the next morning convinced it won’t.
That indecision meant that, for a month at least, many investors turned to value stocks.
In the chart below, each bar shows one month’s gap between Value and Growth in the S&P 500. Bars above zero are months when Value beat Growth.
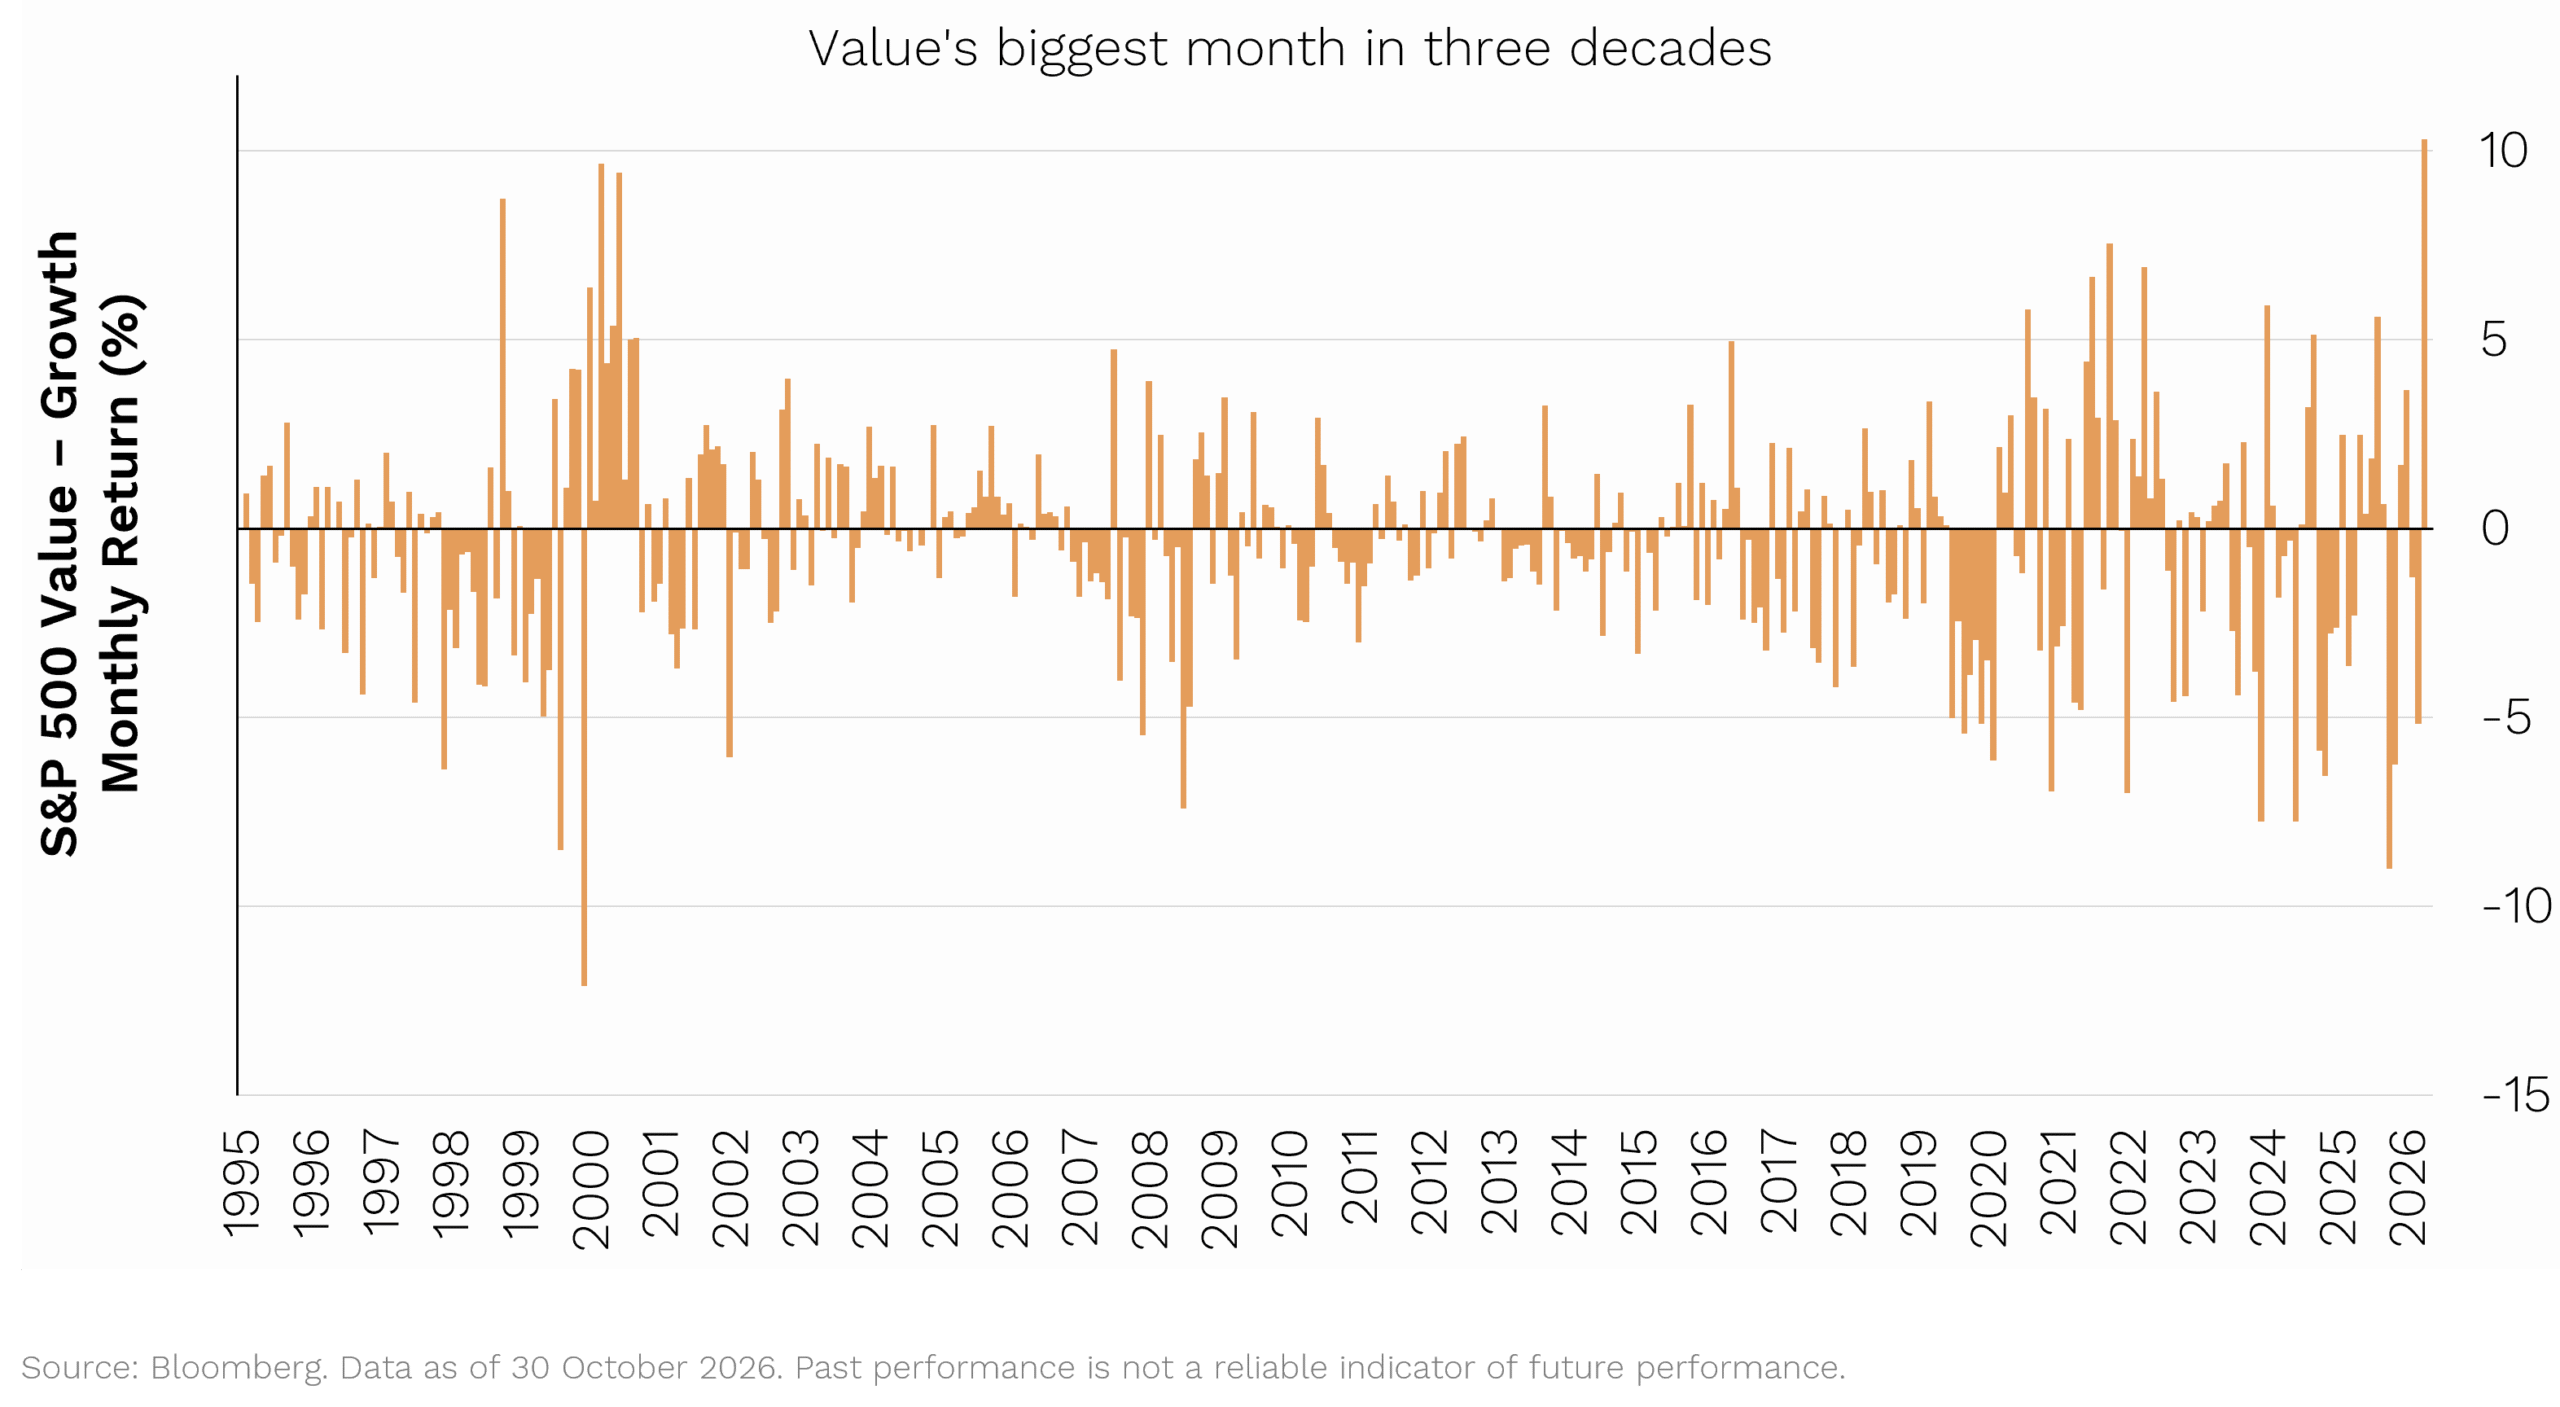
October 2026 is the tallest on the chart at +10.3% in Value’s favour. The data runs back to the mid-1990s, and the next biggest months in Value’s favour were September and December 2000.
Money left the AI complex and headed for energy, banks, staples (Value sectors) and anything that hadn’t been working.
For a growth-biased small-cap manager, a month like that is a headwind you cannot sidestep without changing who you are. We would, however, rather own companies growing earnings at +20% and wear the occasional Value month than own the other kind and wait for a rotation to rescue us.
Blue wave. Green wave for small caps?
Which brings us back to the other event of 3 November: the US midterm elections.
Midterms have always had a big effect on small-cap performance.
In the chart below, the dark bars show US small caps in the six months leading into each midterm election since 1962. The light blue bars show the six months after.
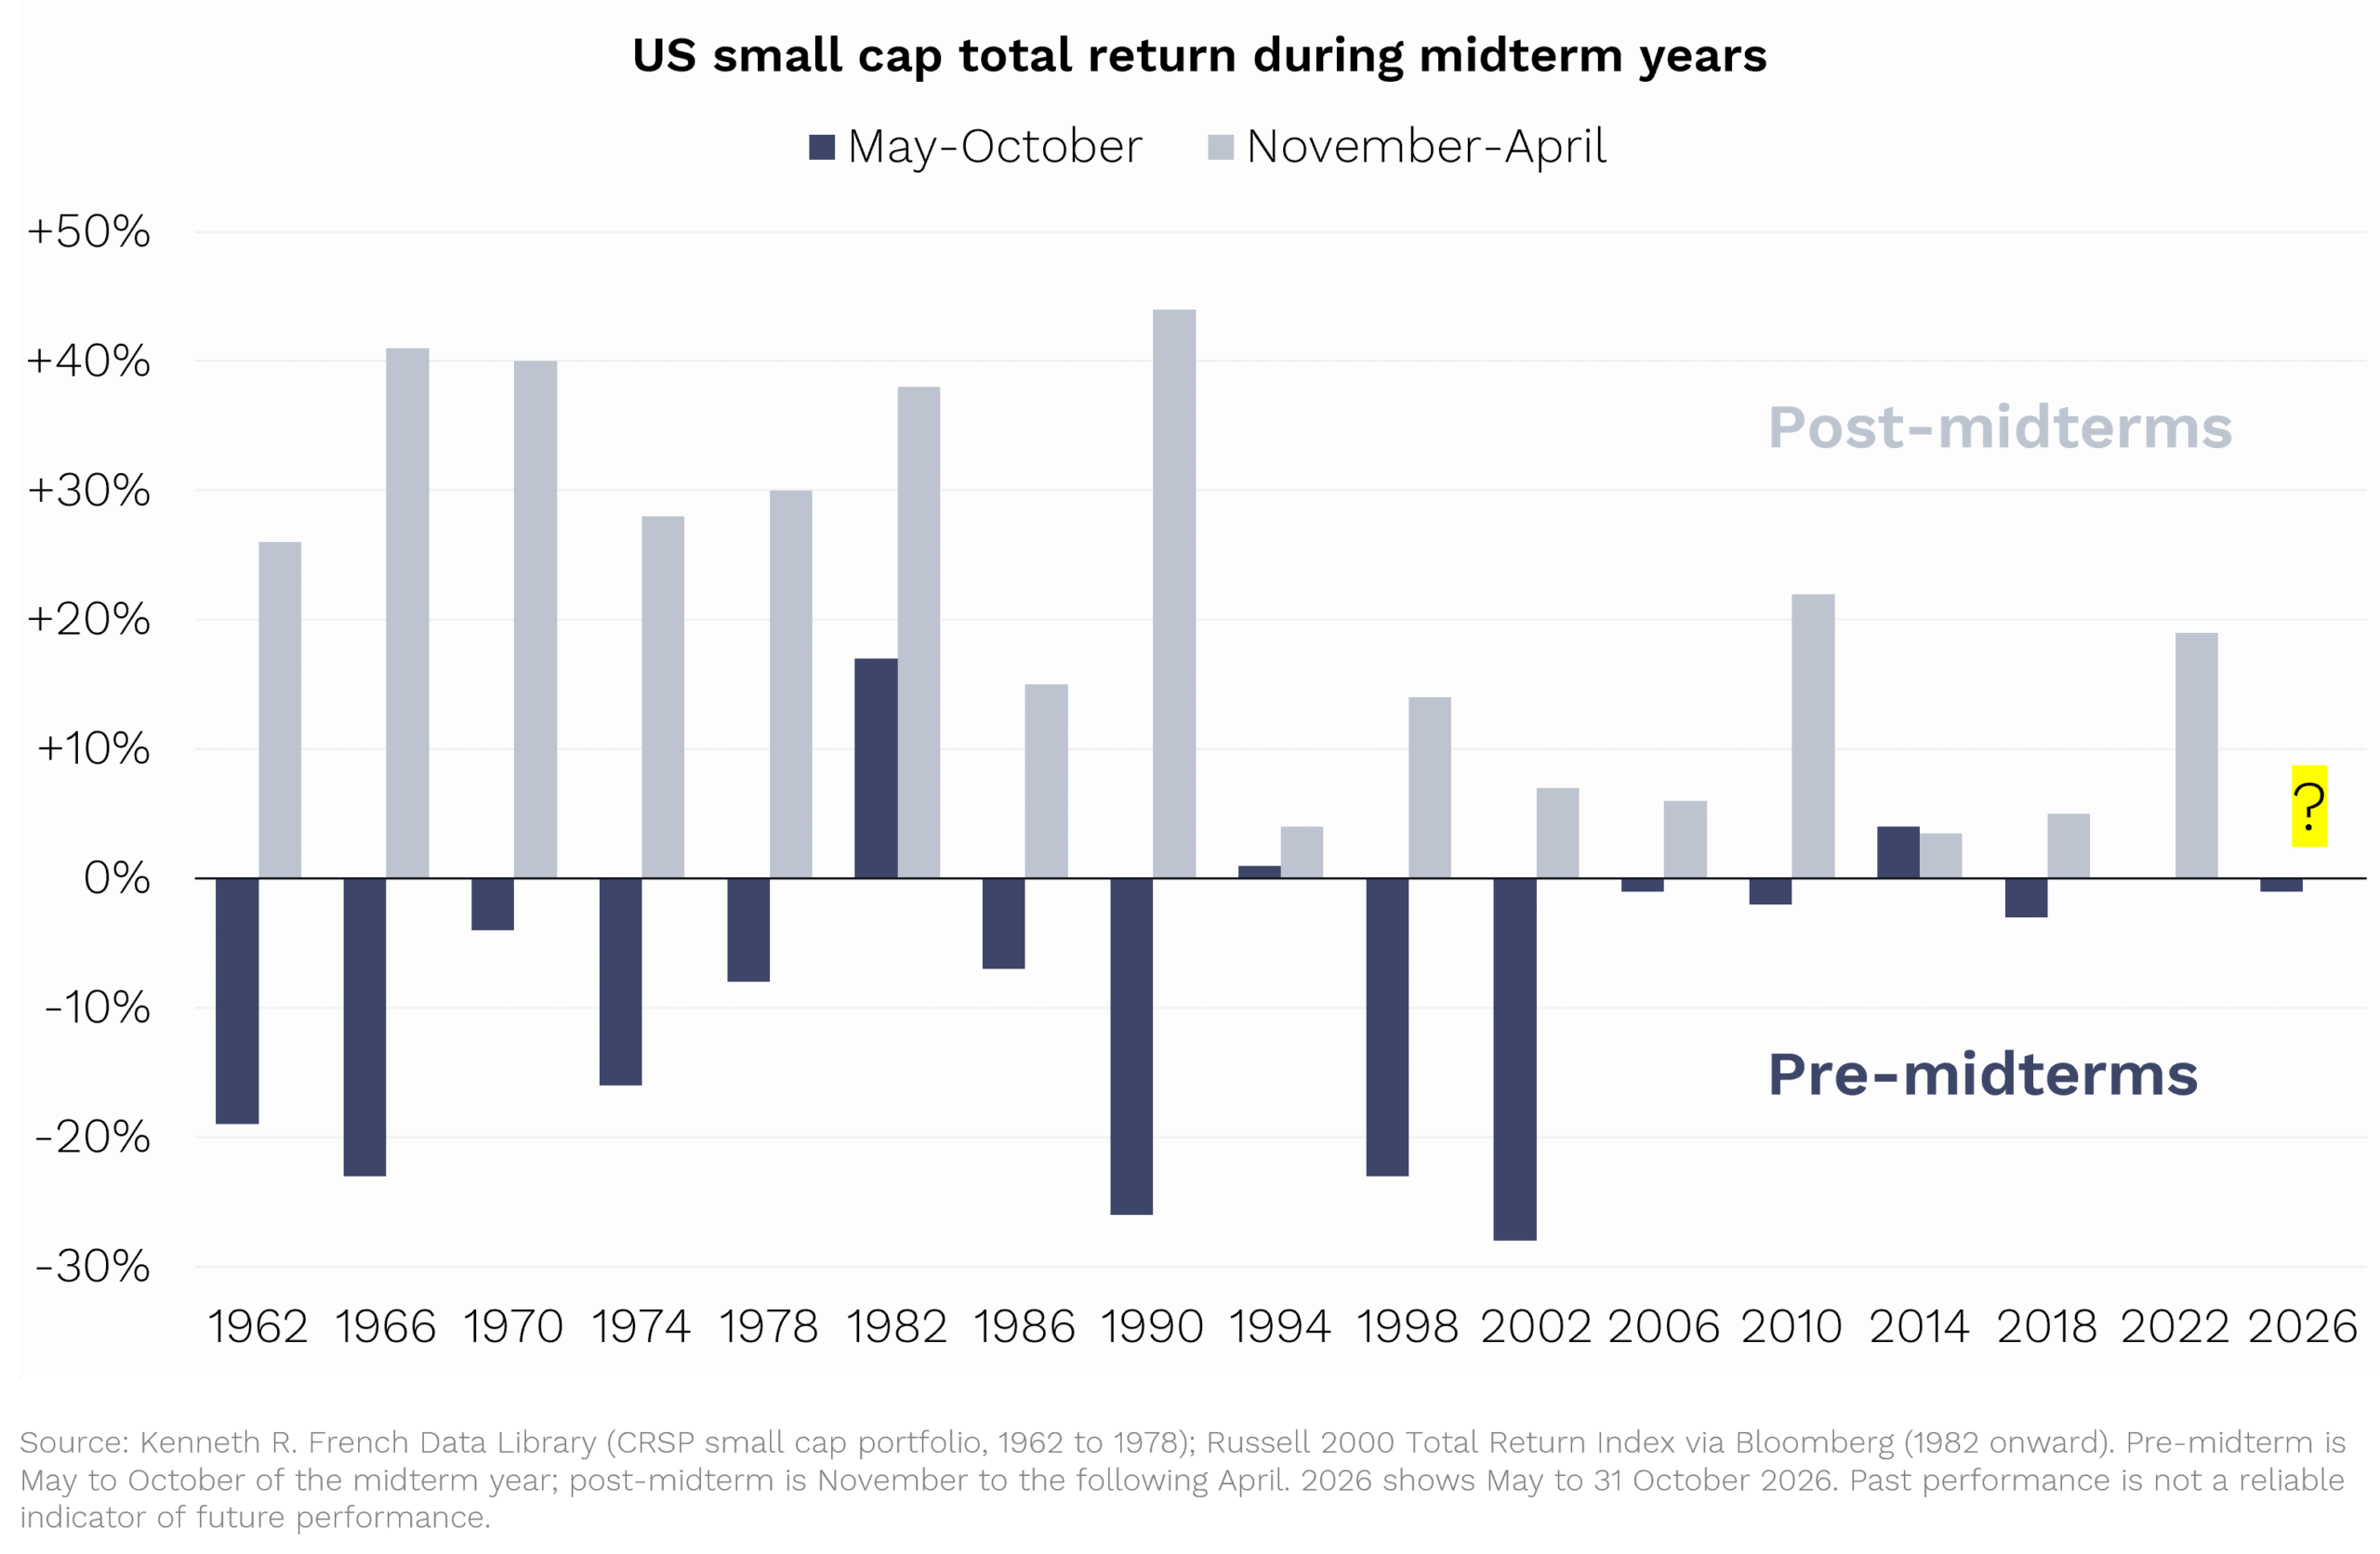
It’s clear that historically the run-in to midterms has been a grind, averaging -7.6% and negative in most cycles. The six months after, however, have averaged +21.5%, with gains in 15 of the 16.
Why? Uncertainty. Markets hate not knowing who will control Congress, and they tend to reward the moment that question is answered, whichever way it goes.
This year the answer is a Democratic Congress facing a Republican White House. Gridlock. Not much gets done … and not much gets broken!
We are not foolish enough to pencil in +21.5% for the next six months; sixteen elections is a small sample. What we can say is that the uncertainty has lifted and valuations are where opportunities are usually found.
US small caps trade on roughly 14 times forward earnings; in recessions they have typically bottomed at around 11 to 12 times forward earnings.
The Global Opportunities Fund’s portfolio trades on about 16 times earnings with around +20% earnings growth (higher than market). That valuation is around its lowest P/E since 2023, when the market was convinced a recession was coming.
That, to us, is asymmetry: valuations not too far from where they bottom in recessions, with plenty of earnings left to deliver.
The long-term form guide
After a frustrating month, it probably pays to step back and look at the whole race that our Funds and our investors are running.
The chart below shows every generalist Australian and global share fund in Morningstar’s main categories (495 of them) since the Global Opportunities Fund launched in October 2018.
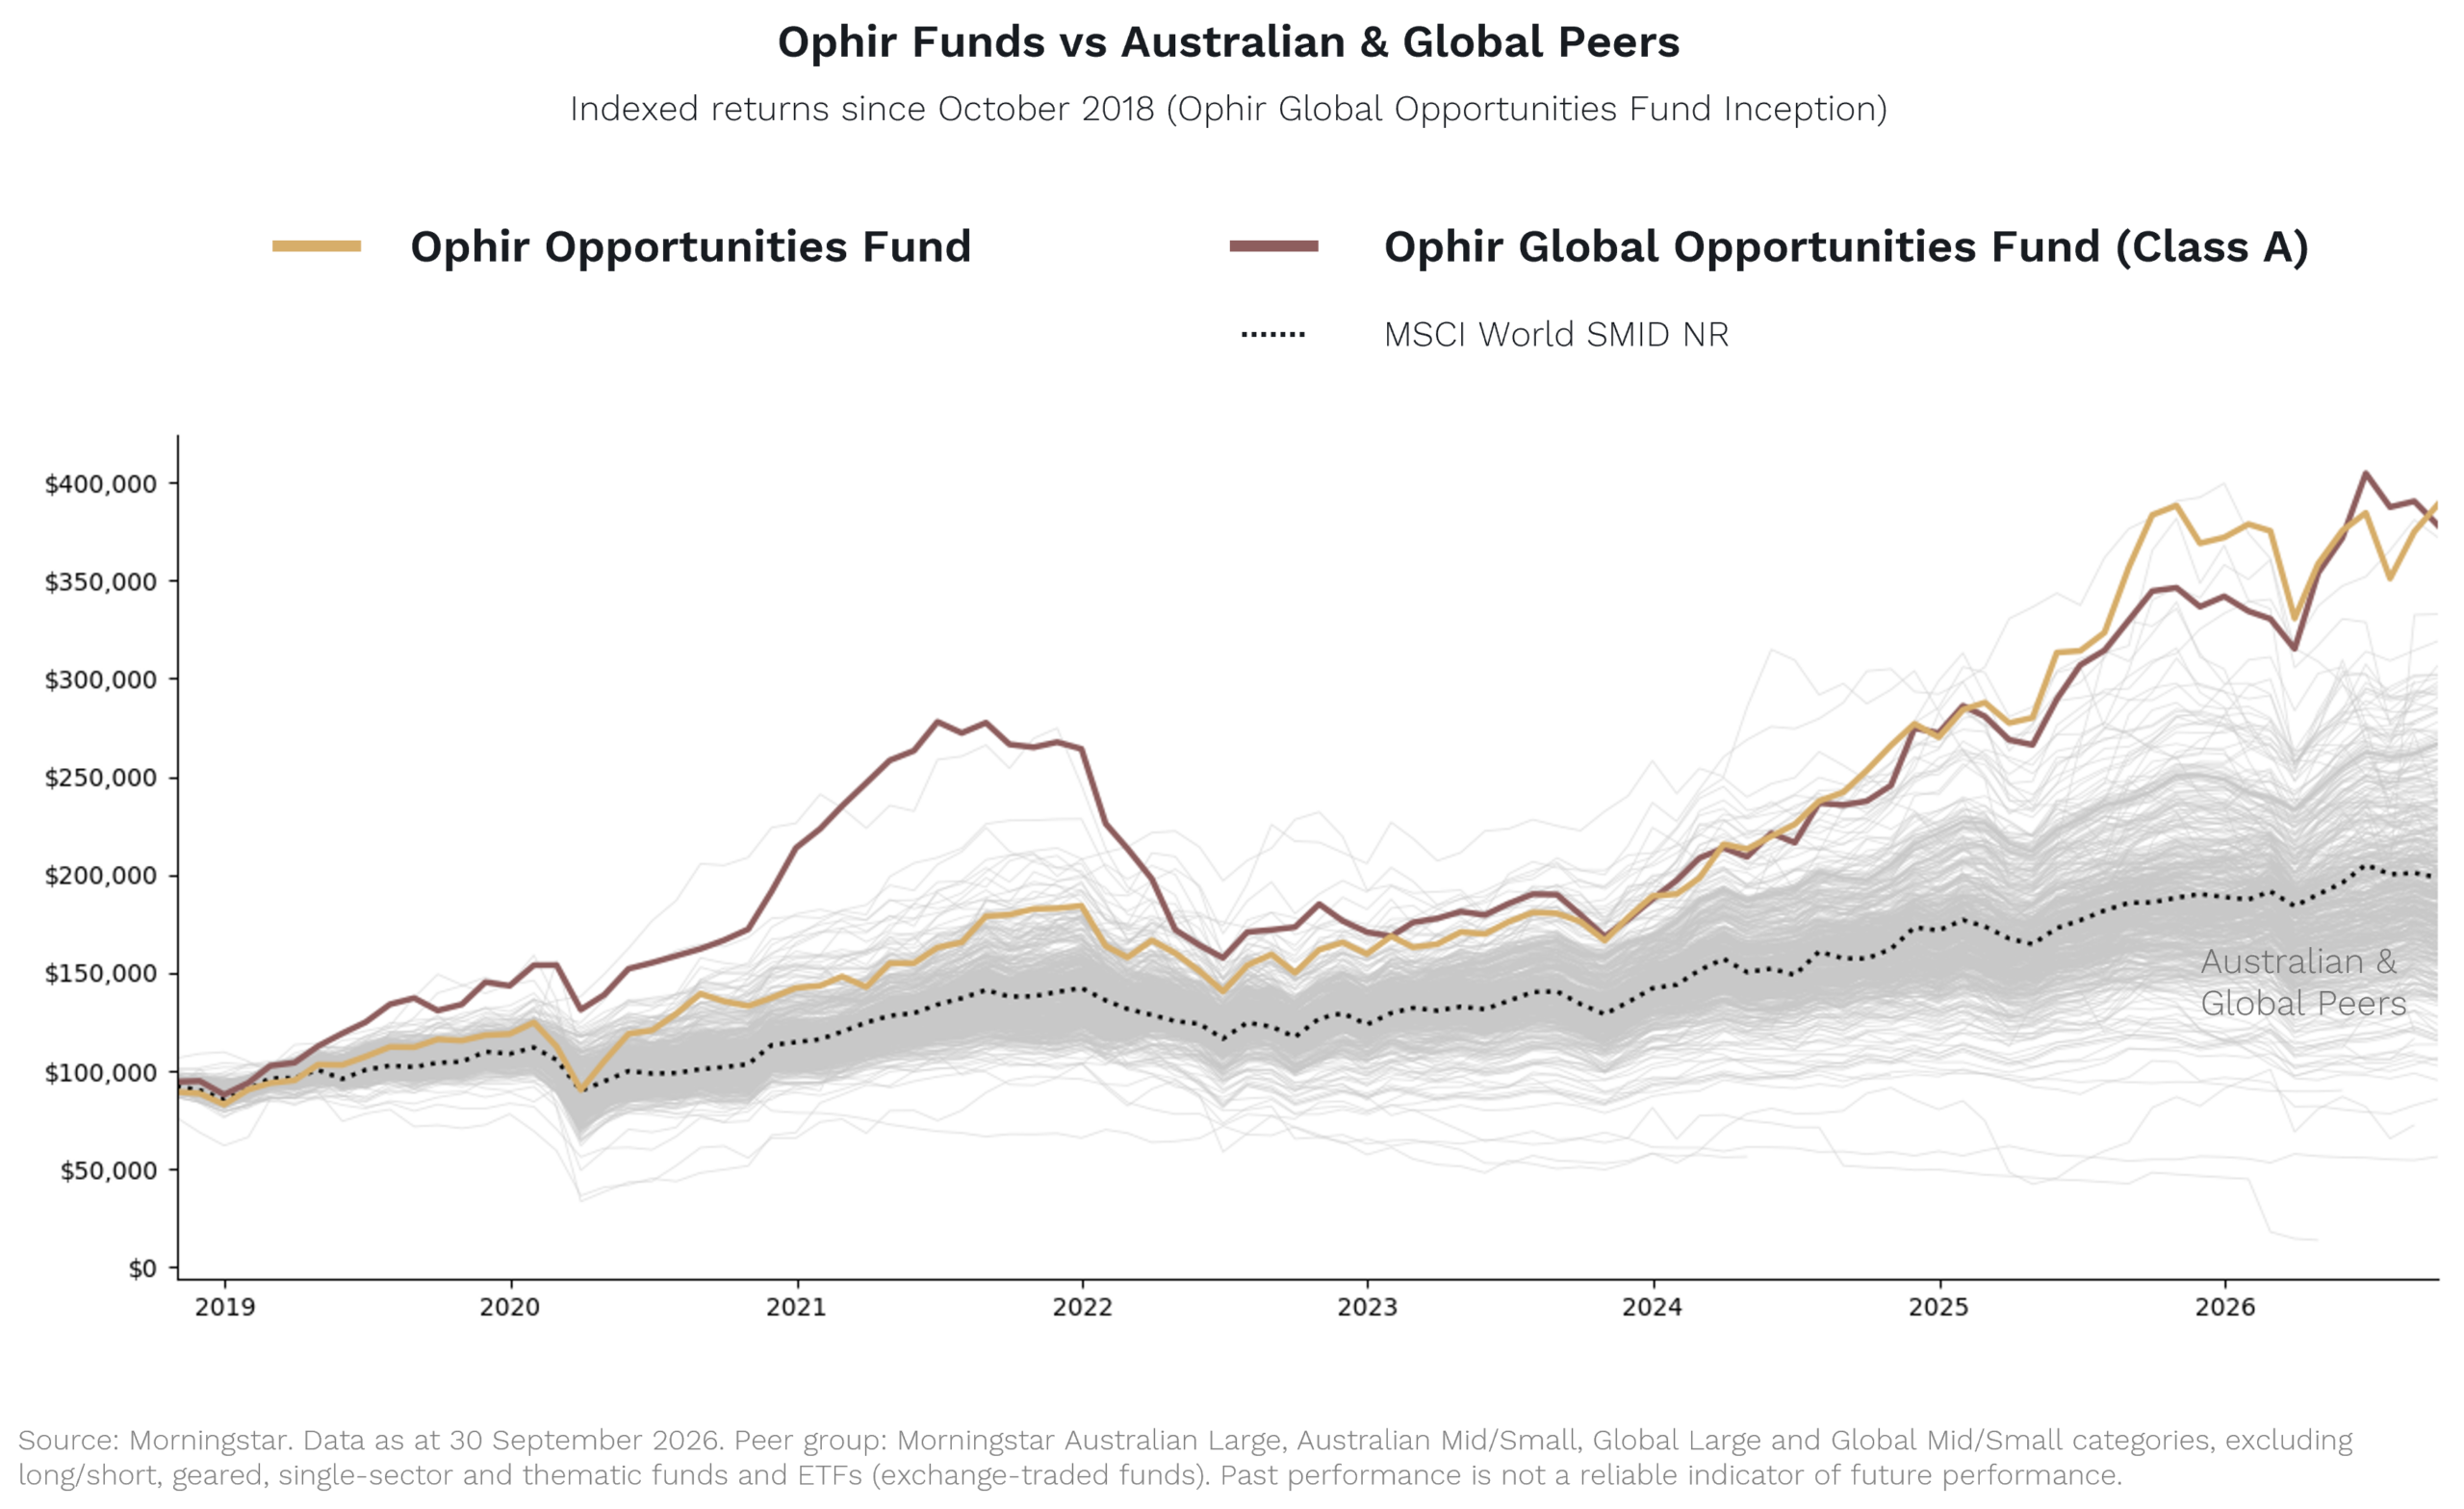
As you can see, the Ophir Opportunities Fund and the Ophir Global Opportunities Fund rank No.1 and No.2.
By the end of September, $100,000 invested in either Fund at the start of that period had grown nearly four times. (The same amount invested in our global benchmark has only roughly doubled.)
The Australian and global markets are two very different markets, but we have achieved the same result. Why? Because both Funds are built on finding companies whose earnings will beat expectations.
In the short term, as October reminded us, sentiment takes the reins. But as Peter Lynch has said, a company’s earnings and its share price are 100% correlated in the long term.
Staying with the stayers
The Melbourne Cup is run over 3,200 metres. Nobody wins it in the first 200 metres.
October was a furlong in which the favourites faded and the roughies saluted. It cost us, and hopefully we have told you why.
But the horses we own are the ones growing earnings, and over eight years, they are the stocks that have consistently won the race.
We have again put our own money where our mouth is: we continued to add personal capital to the Funds on 1 November.
We would not expect any investor to do the same without a time horizon of at least five years, because months like October will happen again.
Rates may have peaked. US midterms are done. Small caps are cheap. The washing machine may keep spinning for a while yet, but we continue to get out on the road, meeting companies, their customers and their competitors, working out whose earnings will surprise next year.
The stayers are only just warming up.
As always, if you’d like to chat to us about any of the Funds, please feel free to call us on (02) 8188 0397 or email us at ophir@ophiram.com.
Thank you for entrusting us with your capital.
Kindest regards,
Andrew Mitchell & Steven Ng
Co-Founders & Senior Portfolio Managers
Ophir Asset Management