By Andrew Mitchell & Steven Ng
Co-founders and Senior Portfolio Managers

In our October 2019 Letter to Investors we highlight how better news on a trade deal between the US and China, as well as further monetary easing globally helped lift most sharemarkets, though the local bourse was conspicuously left behind. We also provide a business update on our activities to close the discount to Net Tangible Assets for the Ophir High Conviction Fund.
Dear Fellow Investors,
Welcome to the October 2019 Ophir Letter to Investors – thank you for investing alongside us for the long term.
Business Update
1. High Conviction Fund (ASX:OPH) – our strategy to close the discount to NTA
As many of our investors in the Ophir High Conviction Fund (“the Fund”) would be aware, we converted the Fund from an open-ended unlisted investment trust to a closed-ended listed investment trust (LIT) in December 2018. This conversion required 75% unitholder approval and was undertaken due to the benefits we believe that this structure provides in our ability to meet our investment return objectives for the Fund over the long term. Importantly, through the conversion we didn’t raise any new capital from investors.
In our monthly Investment Strategy piece this month we go into more detail on why we undertook the conversion and address some questions we have received on this topic. We touch on the benefits of a stable capital base for a manager from which to generate performance, and how a similar environment helped us generate strong outperformance compared to peers at our previous employer during the GFC. We also cover why we didn’t seek to raise any new capital in the conversion, as we believe the bigger a fund gets, the harder it is to generate superior long-term performance.
More recently there has been increased commentary in the financial media about the trading of Listed Investment Companies (LICs) and LITs and how discounts to Net Tangible Assets (NTA) for many are at cyclical highs. As can be seen in the chart below, discounts started appearing or increasing earlier this year. Historically though, discounts have not been uncommon. Importantly, the larger the LIC or LIT, the smaller the discount has tended to be, generally due to its superior trading liquidity. Many reasons have been given for why this opening up in discounts has occurred including the pre-Federal election policy position of the ALP to scrap refundable franking credits, tax loss selling in June, and an influx of supply of LIC/LIT products through IPOs in the last couple of years.
Chart: 5 Year Historical Premium/Discount to Net Tangible Assets by Market Capitalisation
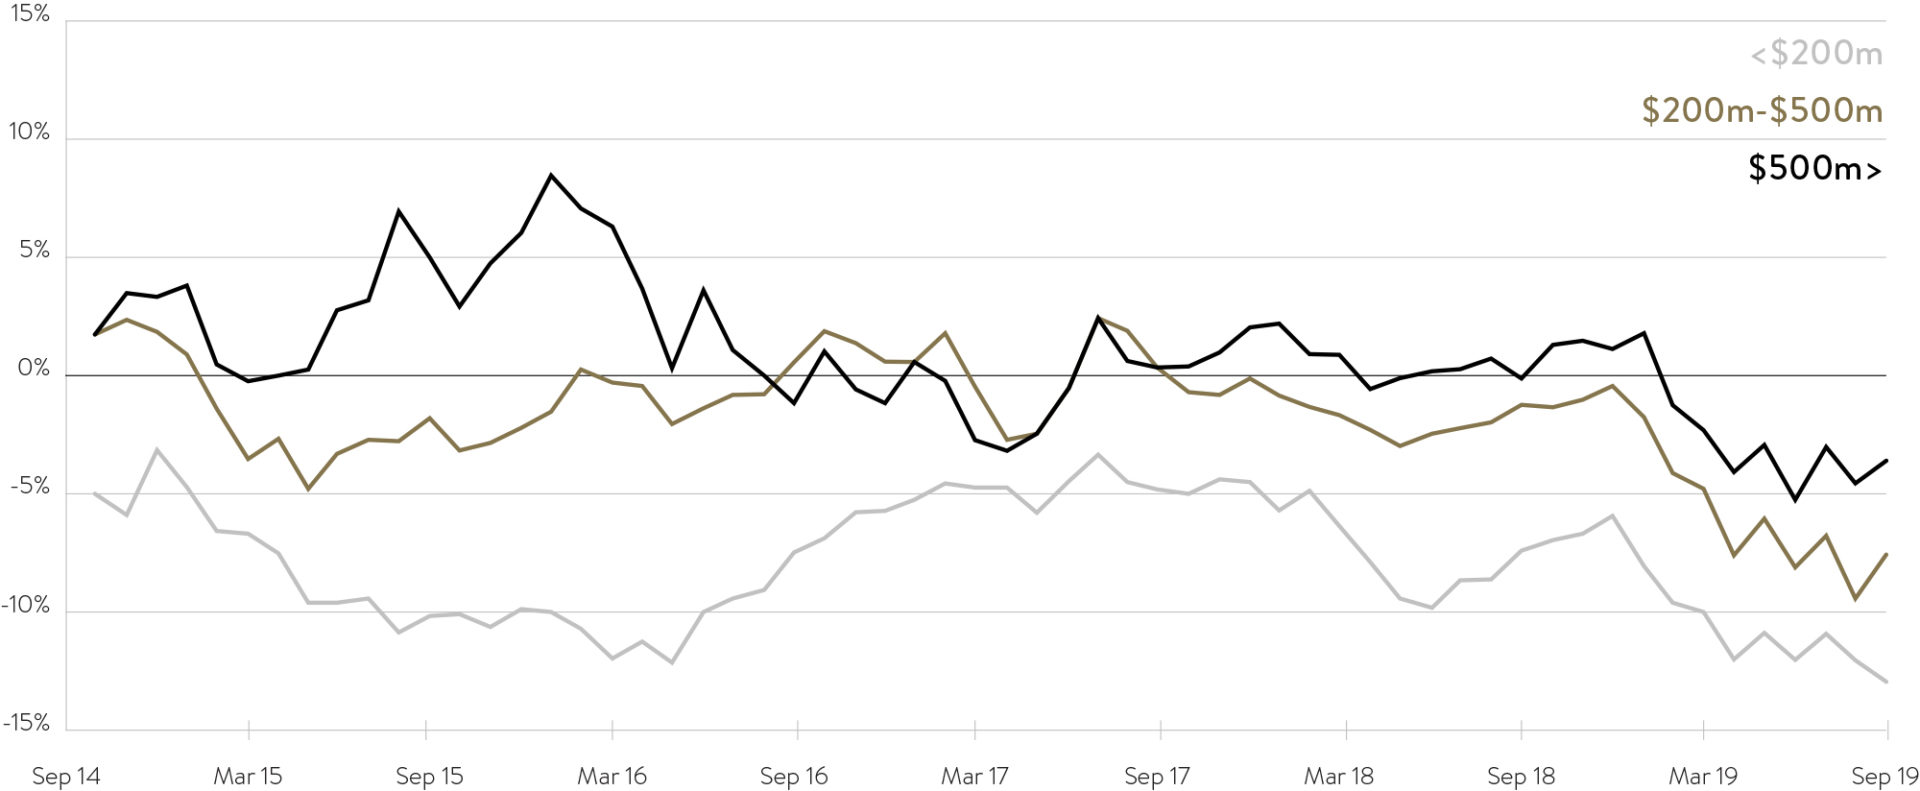
Source: Bell Potter
The Fund has also been trading on a discount to NTA more recently in the 6-9% range. There are no doubt market wide factors at play here though we consider ourselves an outlier based on our size (at circa $540mil making us the second largest Australian equity small/mid cap LIC/LIT in the market) and performance (strong absolute returns of 19.6% p.a. net of fees since inception) which alone would suggest the discount should be smaller, or should trade on a premium.
The vast majority of our fellow investors share our long-term investing philosophy, however should they decide for whatever reason to liquidate part of their holdings then we would like them to be able to do so as close to NTA as possible. We have set out below the strategy that we have committed to and are busily executing and would like to stress that this is a key focus for us.
One of the key reasons for the Fund trading at its current discount is the limited marketing and distribution efforts to financial advisors and private investors historically. The Ophir Funds, including the High Conviction Fund, have grown over time by word of mouth and reached capacity relatively quickly. Over recent months we have focussed on further enhancing our marketing and distribution capability.
There are two key actions that we need to deliver on to ensure that OPH’s unit price on the ASX trades as close to its NTA as possible:
- Continue to deliver strong long-term investment performance.
- Broaden out our distribution of the fund to more financial advisers and private investors.
The investment team, including ourselves, are working as hard as ever to ensure that (1) above continues.
In terms of (2), to drive further buying support for the Fund we have hired 2 x additional distribution resources in the last four months to drive sustained engagement with existing and prospective investors. Going forwards Ophir will be dedicating significantly more time and money to our marketing and distribution efforts, focusing on increasing our engagement with financial advisers, a group that we have not largely engaged historically. Our experience to date is the discount to NTA has closed to around zero when we have engaged with advisers.
In our view, the current discount represents a strong buying opportunity to us given the Fund’s market leading long-term performance and size relative to its listed Australian small and mid-cap competitors.
We have committed further significant personal investment recently into the High Conviction Fund over October and November given the value we see on offer through the discount. Other staff have also been buying given the opportunity of the discount to buy a $1 worth of assets in the Fund for $0.91 to $0.94 at present.
Should the discount persist despite the sustained increase in marketing and communications, we will signal to the market that we will be personally buying further units in the High Conviction Fund, and then will subsequently make further significant personal investments.
If this does not close the discount, then we will signal to the market that we will buy back stock within the Fund. If signalling does not close the discount sufficiently, then we will activate the buy back and shrink the size of the fund in an effort to bring the discount towards the NTA.
The only other thing that we would ask our investors is to judge us over the long term. There will be times when the fund trades at a discount and others when it will trade at a premium. We believe over the long-term horizon of the fund the stable capital base of a listed structure provides a net benefit to investors, as we have found from previous experience. Academic evidence tends to support this proposition that closed end funds don’t suffer the performance drag from having to fund investor redemptions at inopportune times.[1] Our single largest investment is our monies in the Fund, and our staff are also significant investors, so we are all working hard to ensure it trades as close to the NAV as possible.
2. High Conviction Fund – Changing the Net Tangible Asset (NTA) backing disclosure from Daily to Weekly
Upon converting the Ophir High Conviction Fund from an unlisted unit trust to an ASX listed unit trust, we were eager to provide ongoing transparency on the value of the underlying investments to our fellow investors. As part of these efforts we committed to disclosing the NTA of the Fund on the ASX and on our website on a daily basis.
After engaging with a number of long-term investors, it has become apparent that this disclosure frequency is not consistent with the long-term nature of the Fund’s investment strategy i.e. a minimum five years investment horizon.
As a result, we will be changing the disclosure of the NTA of the Fund to the ASX, and on our website, from daily to weekly. We believe this change in disclosure frequency is more likely to strike the right balance between keeping the focus on longer term investment returns of the portfolio (as reflected in the NTA), whilst providing ongoing transparency on the value of the underlying investments.
This weekly disclosure will occur on Monday morning to the ASX and on our website, providing the previous Friday’s closing NTA.
3. Additional personal investments into the Ophir Funds
As Co-Founders and 50% owners each in Ophir Asset Management, one of our guiding principles and differentiating factors when establishing the business was that we would be highly aligned with our underlying investors. To this end, we have been continually investing funds from our business back into the Ophir Funds since we commenced in 2012. In October and November this year we have been investing further significant funds totalling approximately more than $1 million into our two strategies available for investment, being the High Conviction Fund and the Global Opportunities Fund. All our liquid personal wealth remains invested in the Ophir Funds. We see Ophir Asset Management and the Ophir Funds as the Family Office for our respective families, close friends and our staff. We will continue to re-invest in the Ophir Funds as our chosen wealth creation vehicles as we seek to compound investment returns over the long term for ourselves and our fellow investors.
[1] Edelen, R 1996, Investor flows and the assessed performance of open-ended mutual funds, Journal of Financial Economics.
Month in review
The month of October was generally risk on for markets, spurred on by news of a potential “phase one” trade deal between the world’s two largest economies, the US and China, as well as a further rate cut by the US Fed. Major sharemarkets generally advanced with gains fairly broad based across most sectors. The largest bond markets typically saw long sovereign bond yields increase and further term premium inserted into yield curves, pushing away from yield curve ‘inversion’ levels that had been worrying investors of a potential impending global recession.
The MSCI World Developed Market Index was up 2.5% (in USD), underperforming the Emerging Markets Index which was up a strong 4.1% (in USD). Regionally, almost all of the major markets were up over the month in local currency terms with Japan (+5.4%) leading the way and logging its best monthly gain over the last 12 months, followed by the NASDAQ (+3.7%) in the US and Germany (+3.5%). The only major market to fall was the UK (-2.2%) giving back most of last month’s gains as an appreciating British Pound (up 5.3% on the month) provided a headwind. Emerging Markets were a mixed bag with Russia (+7.8%), Brazil (+5.9%) and China (+4.0%) providing most of the support whilst Argentina (-5.3%) reversed a large portion of last months rise and the volatile Turkey sharemarket (-7.5%) took another tumble.
The local S&P/ASX200 Index in Australia continued to underperform developed markets for the third month in a row, falling -0.4% and not participating in the broad-based gains seen in most other major markets. The Small Ordinaries index also had a tough time falling -0.7% for the month. 12 month total returns for the S&P/ASX200 stand at a very healthy +19.3% with Japan (+6.9%) and the UK (+6.5%) the relative underperformers. All sectors of the Australian sharemarket have had 15%+ gains over the last year with the exception of Energy (+2.0%) that has struggled on the back of an oil price that is at similar levels to where it was a year ago.
Ophir Fund Performance
The Ophir Opportunities Fund returned -0.6% for the month after fees, underperforming its benchmark by -0.1%. Since inception, the Fund has returned +26.3% per annum after fees, outperforming its benchmark by 18.6% per annum.
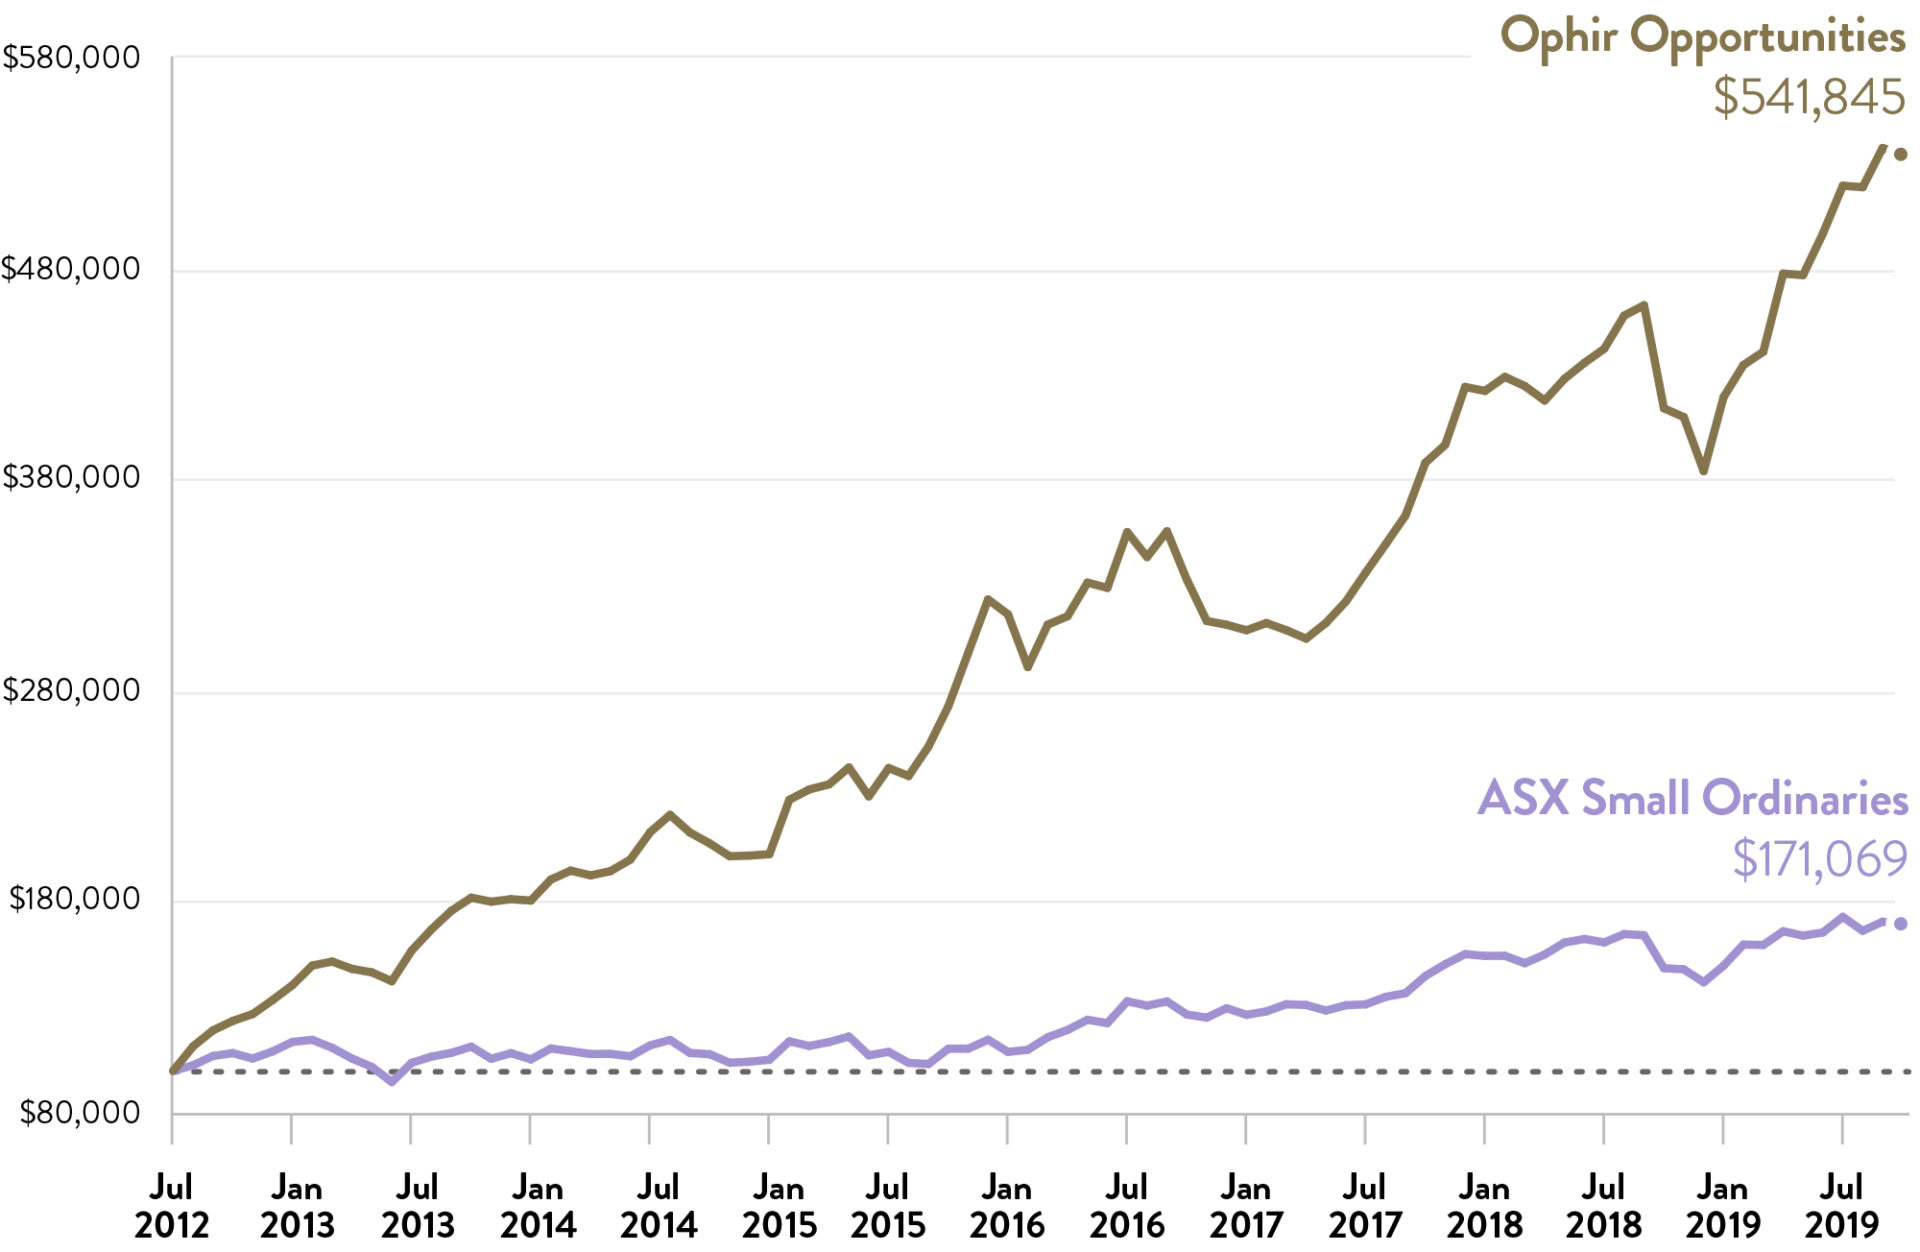
Growth of A$100,000 (after all fees) since Inception
| 1 Month | 3 Month | 1 Year | 3 Year (p.a.) | 5 Year (p.a.) | Since Inception (p.a.) | |
| Ophir Opportunities Fund* | -0.5% | 4.4% | 34.9%p.a. | 19.9% | 25.4% | 33.2% |
| Benchmark* | -0.5% | -1.8% | 14.4% | 10.4% | 9.6% | 7.7% |
| Value Add (Gross) | 0.0% | 6.2% | 20.5% | 9.5% | 15.8% | 25.5% |
| Fund Return (Net) | -0.6% | 2.9% | 29.2% | 17.2% | 20.9% | 26.3% |
* S&P/ASX Small Ordinaries Accumulation Index (XSOAI). Past performance is not a reliable indicator of future performance
![]()
The Ophir High Conviction Fund investment portfolio returned -1.5% for the month after fees, underperforming its benchmark by -1.1%. Since inception, the Fund’s investment portfolio has returned +19.6% per annum after fees, outperforming its benchmark by 8.0% per annum. ASX:OPH returned 0.0% for the month.
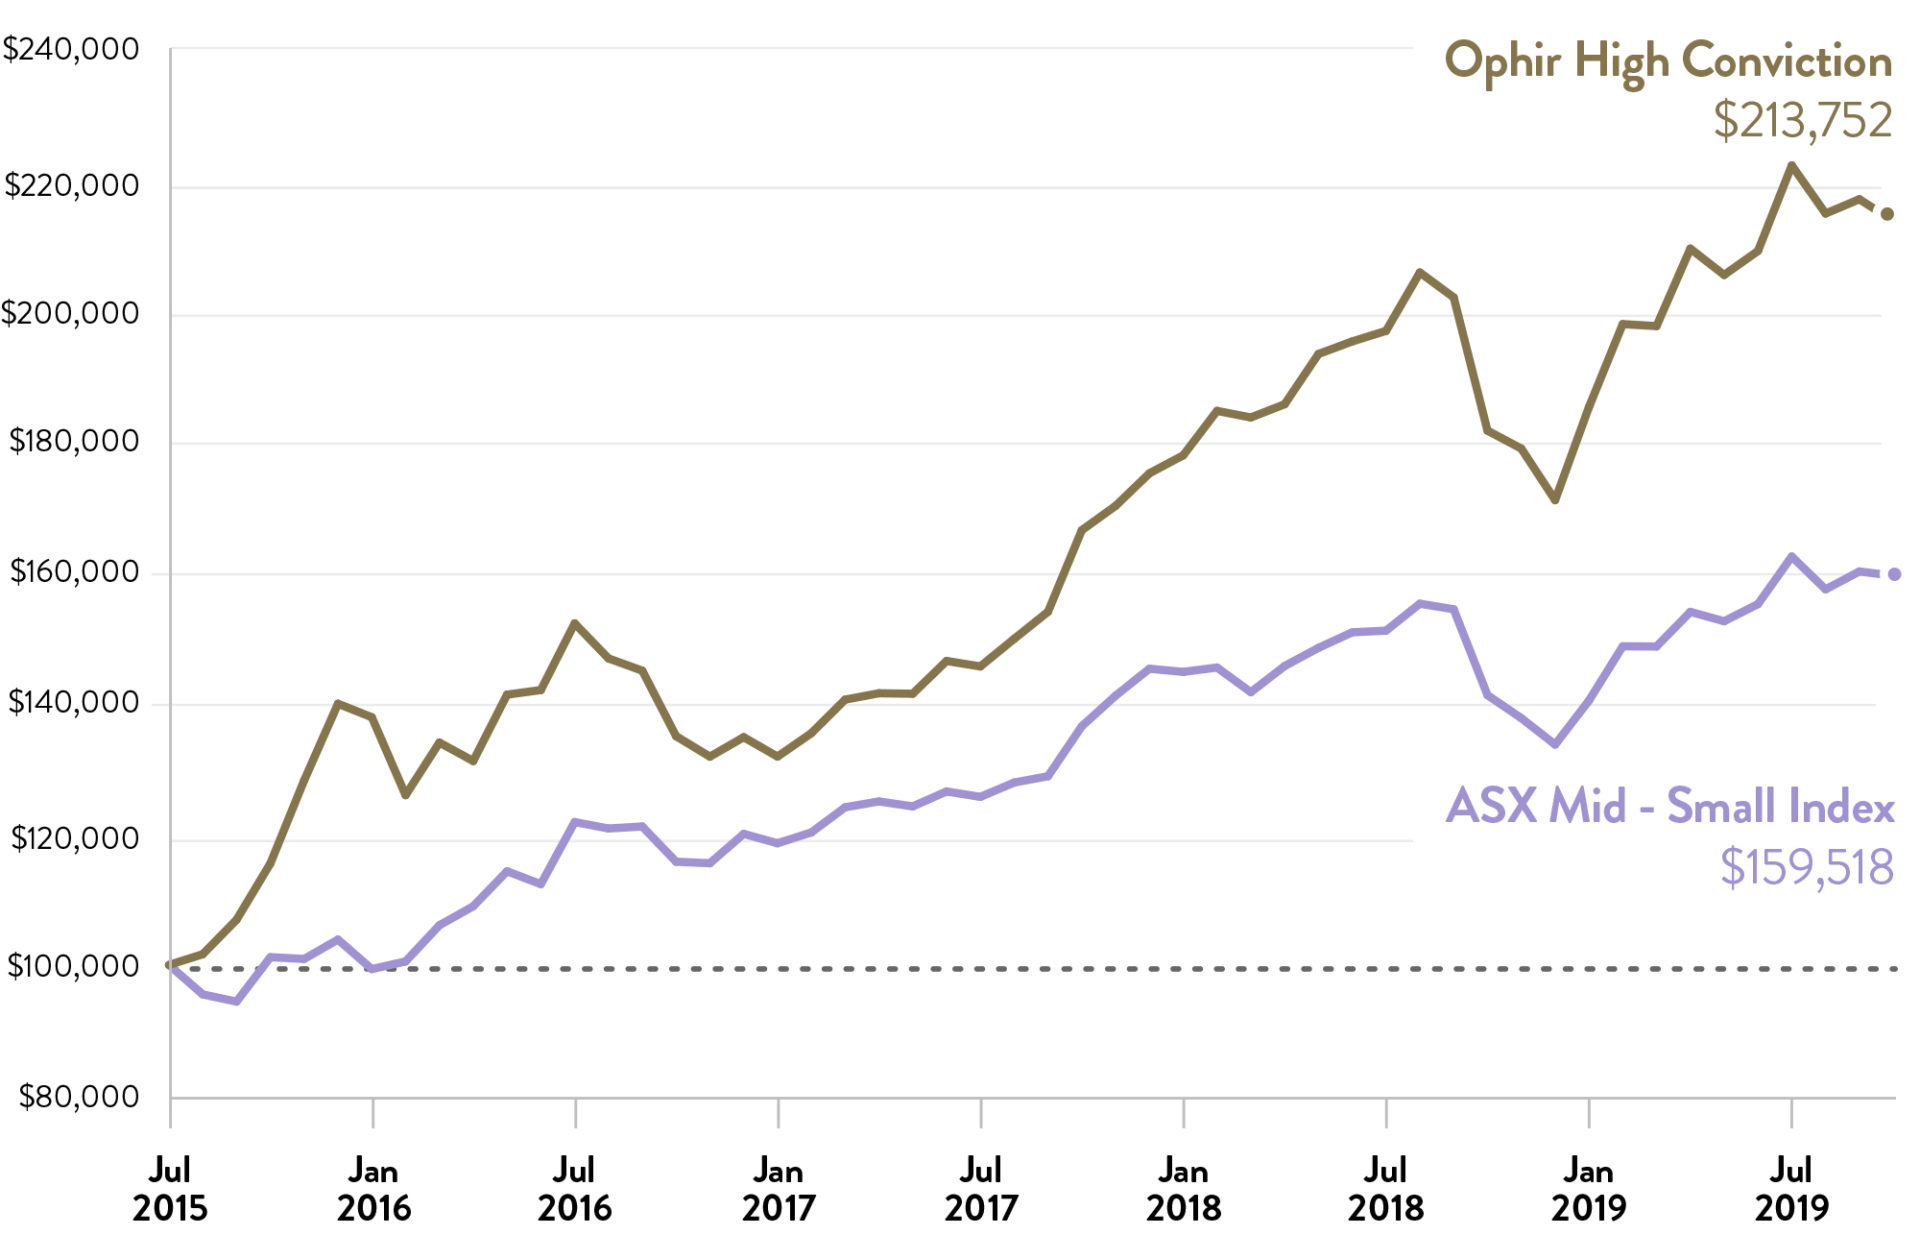
Growth of A$100,000 (after all fees) since Inception
| 1 Month | 3 Month | 1 Year | 3 Year (p.a.) | Since Inception (p.a) | |
| Ophir High Conviction Fund (Gross) | -1.6% | 3.9% | 20.2% | 19.0% | 24.1% |
| Benchmark* | -0.4% | -1.8% | 12.9% | 11.3% | 11.6% |
| Gross Value Add | -1.2% | -2.1% | 7.3% | 7.7% | 12.5% |
| Ophir High Conviction Fund (Net) | -1.5% | -3.8% | 17.6% | 16.6% | 19.6% |
| ASX:OPH Share Price Return | 0.0% | -3.5% | n/a | n/a | n/a |
* S&P/ASX Mid-Small Accumulation Index. Past performance is not a reliable indicator of future performance
![]()
The Ophir Global Opportunities Fund investment portfolio returned 2.4% for the month after fees, outperforming its benchmark by 2.0%. Since inception, the Fund’s investment portfolio has returned +31.6% per annum after fees, outperforming its benchmark by 31.7% per annum.
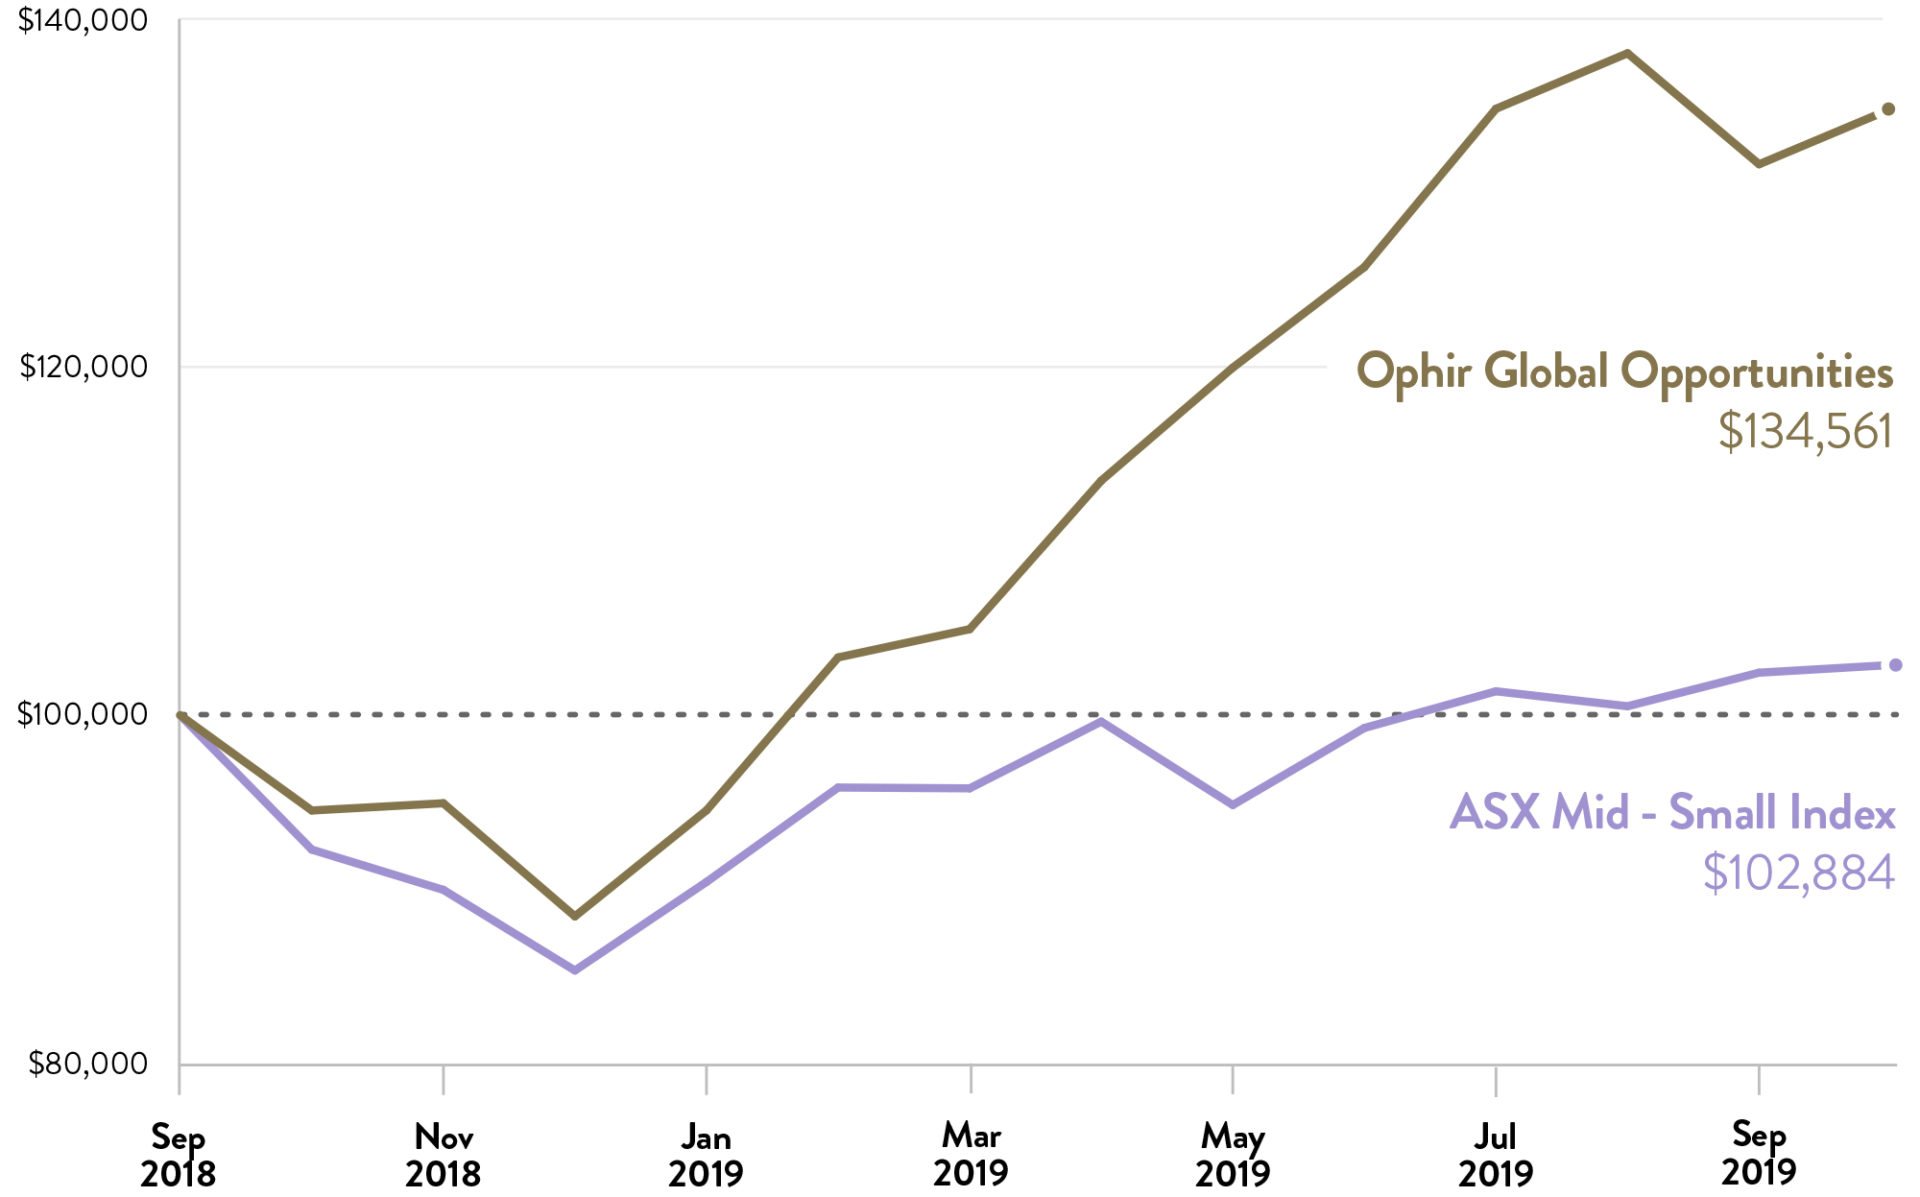
Growth of A$100,000 (after all fees) since Inception
| 1 Month | 3 Month | 6 Month | 1 Year | Since Inception (p.a) | |
| Ophir Global Opportunities Fund (Gross) | 2.6% | -0.1% | 23.4% | 53.0% | 41.5% |
| Benchmark* | 0.4% | 1.5% | 3.3% | 11.5% | 2.7% |
| Gross Value Add | 2.1% | -1.6% | 20.1% | 41.5% | 38.9% |
| Ophir Global Opportunities Fund (Net) | 2.4% | 0.0% | 18.8% | 42.3% | 31.6% |
* MSCI World SMID Index TR (Net) (AUD). Past performance is not a reliable indicator of future performance
![]()
Macroeconomic Highlights
The month of October saw the RBA and US Fed cut interest rates to 0.75% and 1.50% respectively to counter downside risks to the economy and to stoke demand and inflation. This came as the International Monetary Fund in October cut its forecast for global economic growth in 2019 to 3.0%, compared to its 3.3% forecast back in April this year, its slowest pace since the GFC. This lower forecast was primarily the result of rising trade tariffs and higher trade uncertainty impacting trade and business investment levels as well as some isolated factors affecting some emerging market economies. Post the release of the forecasts however, positive news of a potential initial trade deal between the US and China has emerged as well as more promising signs for Brexit with the risk of a No-deal exit fading. Global manufacturing PMIs also seem to have stabilised with some suggesting the worst of the economic slowdown may be near and odds of reflation in the global economy in 2020 may be increasing.
The US Federal Reserve cut interest rates again at the end of October, taking its key Federal Funds Rate to 1.50% as well as announcing a program of buying short dated treasury securities that it has been at pains to stress “is not QE”. More positively it sees a pause in rate cuts now and potentially the bottom of this rate cutting cycle if its economic forecasts play out. In Australia, after cutting rates to 0.75% in October, the RBA held rates steady in early November though maintains an easing bias. Markets are only ascribing about a 50% probability of another 0.25% cut this cycle by mid next year. However, we still think further cuts are a distinct possibility with the banks not passing rate cuts through in full and unemployment and inflation forecasts remaining above and below (respectively) the RBA’s desired levels. Quantitative easing in Australia also remains a possibility in 2020 though it is too soon to confidently make this call.
Australian house prices are complicating this picture after rising 1.2% in October, the fastest since 2015. Nationally house prices have risen for three consecutive months now at an 11% annualised pace with the gains mostly concentrated in Sydney and Melbourne (up 1.7% and 2.3% respectively in October). This however has been on weak volumes with reduced spillover to renovation activity expected. The RBA is likely to leave the heavy lifting on constraining any excess housing price or credit growth to APRA through macroprudential measures if necessary.
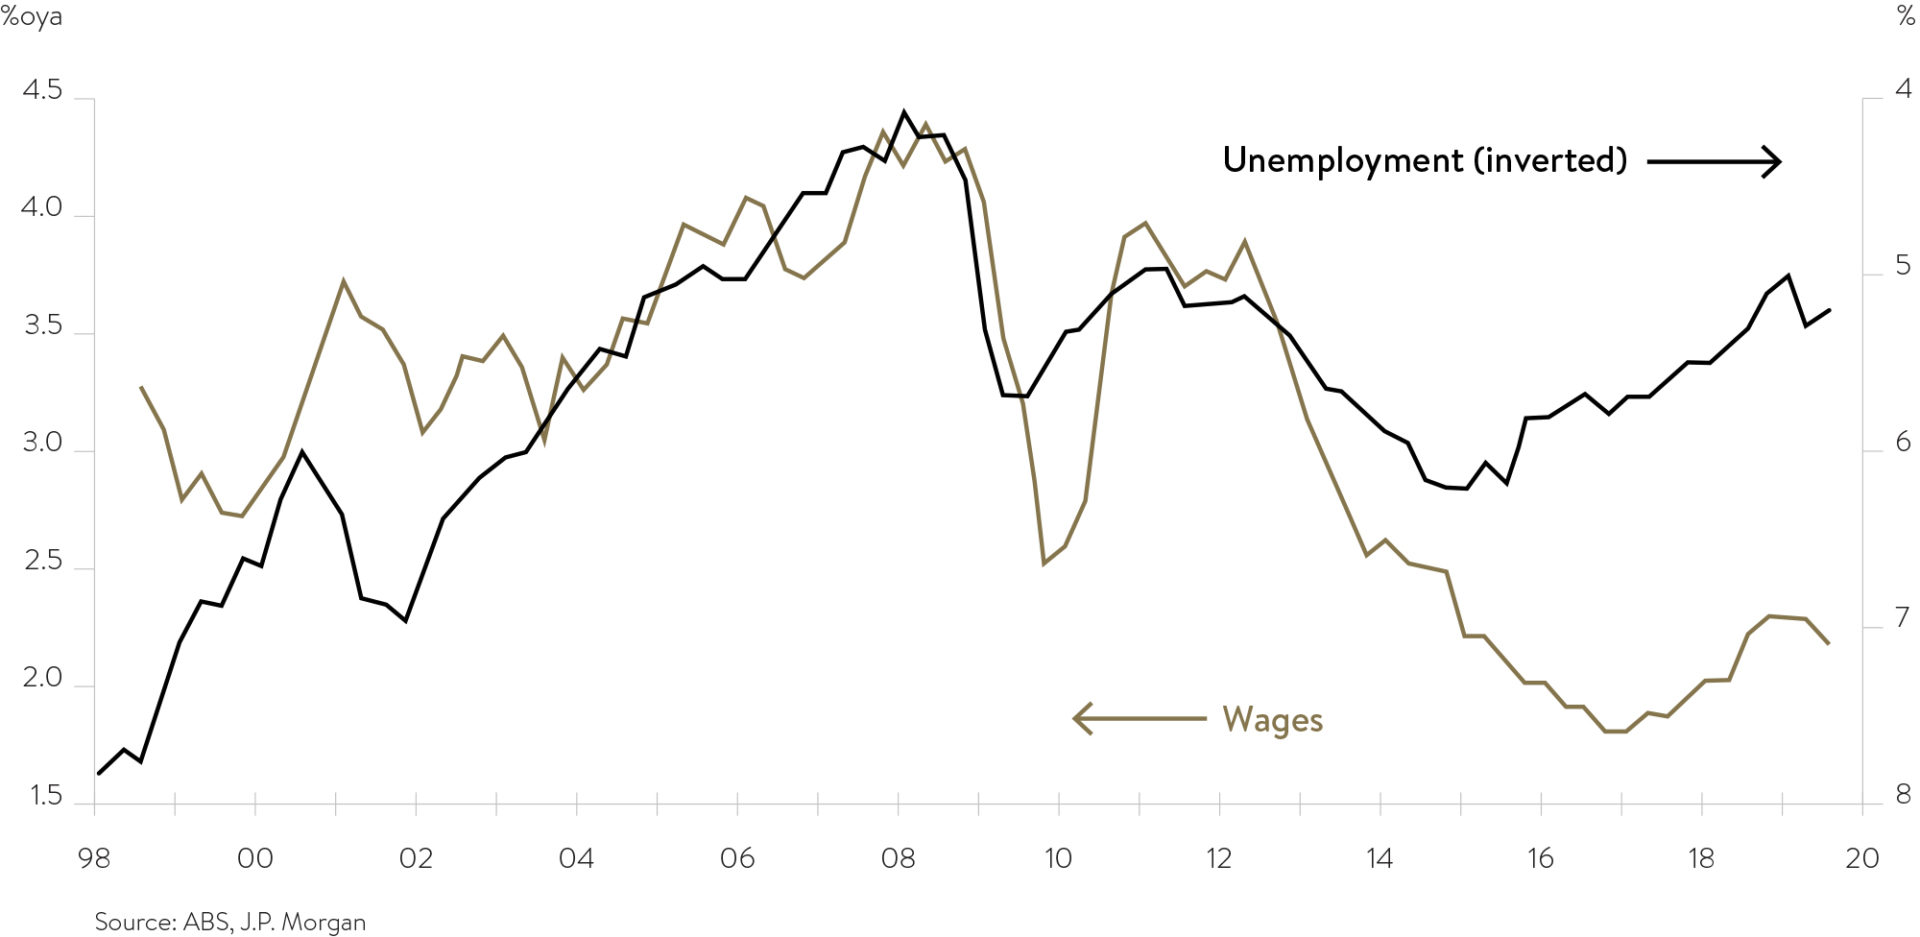
The retail sales picture in Australia also remains sluggish with sales spending increasing just 0.2% in September and retail volumes actually going backwards (-0.1%) over the September quarter. This is disappointing in light of RBA rate and tax cuts as well as rebounding house prices. Retail sales and more broadly household consumption is being constrained by still slow wages growth that will require a tighter labour market before it picks up sustainably (refer chart below). We do expect however retail sales to improve, albeit slowly, over the rest of the year.
Chart: Australian Wage Growth and Unemployment
Key Market Moves
As better trade and geopolitical news has filtered through over the last couple of months and leading indicators of economic growth have improved, or at least not worsened, the reflation theme affecting markets continued in October. Long term sovereign bond yields in advanced economies have tended to lift, yield curve inversion worries have tended to dissipate and beaten up value and cyclical stocks have tended to perform better. As expected in this type of environment bond proxies sectors globally such as Utilities, REITs and Consumer Staples have tended to underperform and typical Value sectors such as Banks have outperformed. Performance of Australian sharemarket sectors have been more nuanced however. A stronger Australian dollar has held back the Australian sharemarket versus global peers this month as well falls in the Banks post reporting season and the large miners going backwards on iron ore price falls in October.
At the smaller end of the Australian sharemarket telco Amaysim (ASX: AYS) (+30.4%) was a top performer for October after the company improved its remuneration structure for its executives. Clinuvel Pharmaceuticals (ASX:CUV) (+24.2%), a company we have performed detailed due diligence on and held in our Australian equity funds rose after receiving FDA approval for its lead product for the treatment of vitiligo. Conversely, Southern Cross Media (ASX:SXL) (-33.2%) fell heavily after a market update detailed a soft media market in the first quarter of this financial year.
In key stocks news for the Australian equity Ophir Funds both Cleanaway Waste (ASX:CWY) (-5.4%) and Afterpay (ASX: APT) (-19.5%) lost ground on AGM and broker report announcements respectively.
Cleanaway Waste, Australia’s largest waste management company, provided a trading update at its AGM towards the end of October which was below market expectations with 1H20 earnings forecast to be flat compared to the previous period last year. This was on the back of weak economic activity, reduced recycled cardboard prices and lower Queensland landfill volumes after the introduction of state levies in July this year.
After a strong run up in price prior to its full year results released in mid-August, it is now trading back around levels of early in the year. Longer term we remain attracted to Cleanaway’s market leading position in an industry undergoing transformation at the present, partly in response to China’s National Sword policy that was implemented almost two years ago. This policy sees China no longer accepting contaminated waste from western countries. This is providing shorter term headwinds for the industry, but it also provides Cleanaway with the opportunity to consolidate smaller uneconomic competitors, helping it to grow market share and to benefit from the structural trends of a growing population and popularity of single use products.
Cleanaway is also leading the evolution of the Australian waste management industry in creating a circular waste management economy that isn’t reliant on China. An example being the manufacturing in-house for Sharpsmart containers that manage healthcare waste. Here Cleanaway can control the recycling of Australian plastic bottles all the way through to the production of the end repurposed sharps containers without input from raw materials recycled in China (see diagram below for overview of the process). We also like the barriers to entry in certain waste streams (commercial and municipal) which require very large scale to make the economics work. Moreover, waste has a lot of potential to be repurposed for the benefit of the community including through Waste-to-Energy projects that Cleanaway is leading the market on in Australia.
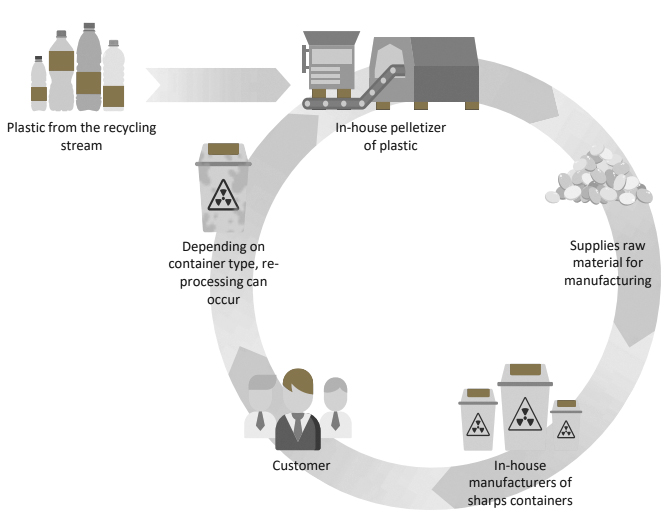
Source: Cleanaway 2019 Annual Results Presentation
Afterpay, which continues to receive much media attention, has seen more volatile trading over September and October, unrelated to any fundamental news flow from the company about its underlying operations. After rising on the back of a broking analyst upgrade report during September, it fell during October after a downgrade from another analyst, as well as concerns that have been highlighted around the RBA’s 2020 review of payments regulation, including surcharging practices in Australia. Whilst volatility in share prices of fast growing business is inevitable as investors try to conduct price discovery, we are looking through the noise and remain focussed on conducting research on the drivers of operational performance of the company. On this score, we continue to remain impressed with its growth trajectories in the US and UK markets and are keeping a keen eye on regulatory, competition and financing risks that the company faces.
A strong positive return was seen by cloud-based accounting software provider Xero (ASX: XRO) (10.8%) over the month of October. This came ahead of its first half result for financial year 2020 which was released in early November. On the day of release the share price jumped more than 10% as revenue and earnings growth beat expectations. The result detailed strong software subscriber growth in the UK and Australia which are its two key markets at present.
![]()
Source: Xero 1H20 results presentation
UK subscriber growth at 51% was a standout. This is especially pleasing given cloud accounting adoption in the UK is underpenetrated at 28%, providing a long run way for growth in the cloud market for Xero to be able to compete in.
Revenue growth of 30% over the year has been complemented by expanding gross margin which is now 85.2%, up 2.4% on the same period last year. This is feeding through to profitability where net profit became positive this first half.
It was also pleasing to see sales of adjacent products outside of core accounting are becoming a larger part of the business and growing rapidly, diversifying its revenue streams. This is important as Australia and New Zealand subscriber’s growth for core accounting software matures and Xero shifts to emphasising its goal of being “beautiful business software” which includes other modules for sale on its software platform (such as for payroll, expense and compliance needs). We look forward to seeing its future success in the larger US market, which provides longer term upside for the company.
Xero represents an example of the type of structurally growing company that we like to identify early and hold, as long-term owners of the business. It operates a market leading software solution that can grow into big markets globally. This is the type of exciting opportunities we are continually searching the market for, both in Australia and overseas, to own in the Ophir Funds.
As always, thank you for entrusting your capital with us.
Kindest regards,
Andrew Mitchell & Steven Ng
Co-Founders & Portfolio Managers
Ophir Asset Management
This document is issued by Ophir Asset Management Pty Ltd (ABN 88 156 146 717, AFSL 420 082) (Ophir) in relation to the Ophir Opportunities Fund & the Ophir High Conviction Fund (the Funds). Ophir is the trustee and investment manager for the Ophir Opportunities Fund. The Trust Company (RE Services) Limited ABN 45 003 278 831 AFSL 235150 (Perpetual) is the responsible entity of, and Ophir is the investment manager for, the Ophir High Conviction Fund. Ophir is authorised to provide financial services to wholesale clients only (as defined under s761G or s761GA of the Corporations Act 2001 (Cth)). This information is intended only for wholesale clients and must not be forwarded or otherwise made available to anyone who is not a wholesale client. Only investors who are wholesale clients may invest in the Ophir Opportunities Fund. The information provided in this document is general information only and does not constitute investment or other advice. The information is not intended to provide financial product advice to any person. No aspect of this information takes into account the objectives, financial situation or needs of any person. Before making an investment decision, you should read the offer document and (if appropriate) seek professional advice to determine whether the investment is suitable for you. The content of this document does not constitute an offer or solicitation to subscribe for units in the Funds. Ophir makes no representations or warranties, express or implied, as to the accuracy or completeness of the information it provides, or that it should be relied upon and to the maximum extent permitted by law, neither Ophir nor its directors, employees or agents accept any liability for any inaccurate, incomplete or omitted information of any kind or any losses caused by using this information. This information is current as at the date specified and is subject to change. An investment may achieve a lower than expected return and investors risk losing some or all of their principal investment. Ophir does not guarantee repayment of capital or any particular rate of return from the Funds. Past performance is no indication of future performance. Any investment decision in connection with the Funds should only be made based on the information contained in the relevant Information Memorandum or Product Disclosure Statement.


