By Andrew Mitchell & Steven Ng
Co-founders and Senior Portfolio Managers

We discuss the key theme from the recent Q3 U.S. reporting season and why we believe U.S. small caps in particular might outperform when markets eventually recover.
Welcome to the November Ophir Letter to Investors – thank you for investing alongside us for the long term.
A month in a day
Sometimes share markets do nothing for months except bumble along sideways. And then, in one day, they put on a month’s worth of gains. The 10th of November was such a day, which saw global equities (MSCI World) rise by a massive +5.1%.
So, what triggered such a sudden surge in confidence?
The October US CPI report was released, showing headline inflation up +0.4% for the month versus 0.6% expected, taking the annual figure to +7.7% versus 7.9% expected. Clearly, it doesn’t take much to get the market excited when it comes to public enemy No.1 for central bankers, investors, and the general public.
Cyclicals, value stocks and large caps rallied the hardest on the day and for the month as markets priced in a greater chance of an economic soft landing in the world’s largest economy. However, stocks in the highest and spiciest growth segments didn’t do so well, with bitcoin-linked equities, recent IPOs, non-profitable tech and US growth microcaps all generally losing ground over the month.
The Aussie share market, with its fair share of cyclicals and value stocks via the Financials and Materials sectors, kept up during the month and held on to its relative outperformance over the last year, rising +6.8% for November (ASX200).
In this letter we’ll take a look at why big one-day rallies in share markets tend to happen at the worst time and what the 70s might have to teach us about a potential rebound in small caps when markets recover. We’ll also cover our Q3 global equities reporting season and explain how it drove some of this month’s underperformance.
November 2022 Ophir Fund Performance
Before we jump into the letter in more detail, we have included below a summary of the performance of the Ophir Funds during November. Please click on the factsheets if you would like a more detailed summary of the performance of the relevant fund.
The Ophir Opportunities Fund returned +2.3% net of fees in November, underperforming its benchmark which returned +4.9%, and has delivered investors +21.9% p.a. post fees since inception (August 2012).
Download Ophir Opportunities Fund Factsheet
The Ophir High Conviction Fund investment portfolio returned +4.8% net of fees in November, underperforming its benchmark which returned +5.0%, and has delivered investors +13.6% p.a. post fees since inception (August 2015). ASX:OPH provided a total return of -7.1% for the month.
Download Ophir High Conviction Fund Factsheet
The Ophir Global Opportunities returned -4.6% net of fees in November, underperforming its benchmark which returned +2.1%, and has delivered investors +14.6% p.a. post fees since inception (October 2018).
Download Ophir Global Opportunities Fund Factsheet
Why it pays to be circumspect about one-day rallies
This month, many were wondering whether the one-day rally that followed the soft US inflation data might be the start of a new bull market for equities. After all, the Nasdaq had its 14th best day ever, up an incredible 7.4%! But perhaps surprisingly, the best days in the share market tend to happen at the worst times.
In fact, 16 of the 20 best days for the Nasdaq have happened during bear markets (see table). And let’s not forget bear markets are relatively rare.
What’s the lesson here?
More often than not, “big days” don’t signal the start of a new bull market. The bounce is simply a reversal of the extremely depressed sentiment that caused the bear market in the first place. In other words, “less bad” seldom equals “good”.
Share markets will inevitably recover from this bear market, but a one-day record is not a reliable starter’s gun.
NASDAQ Largest One-day Increases
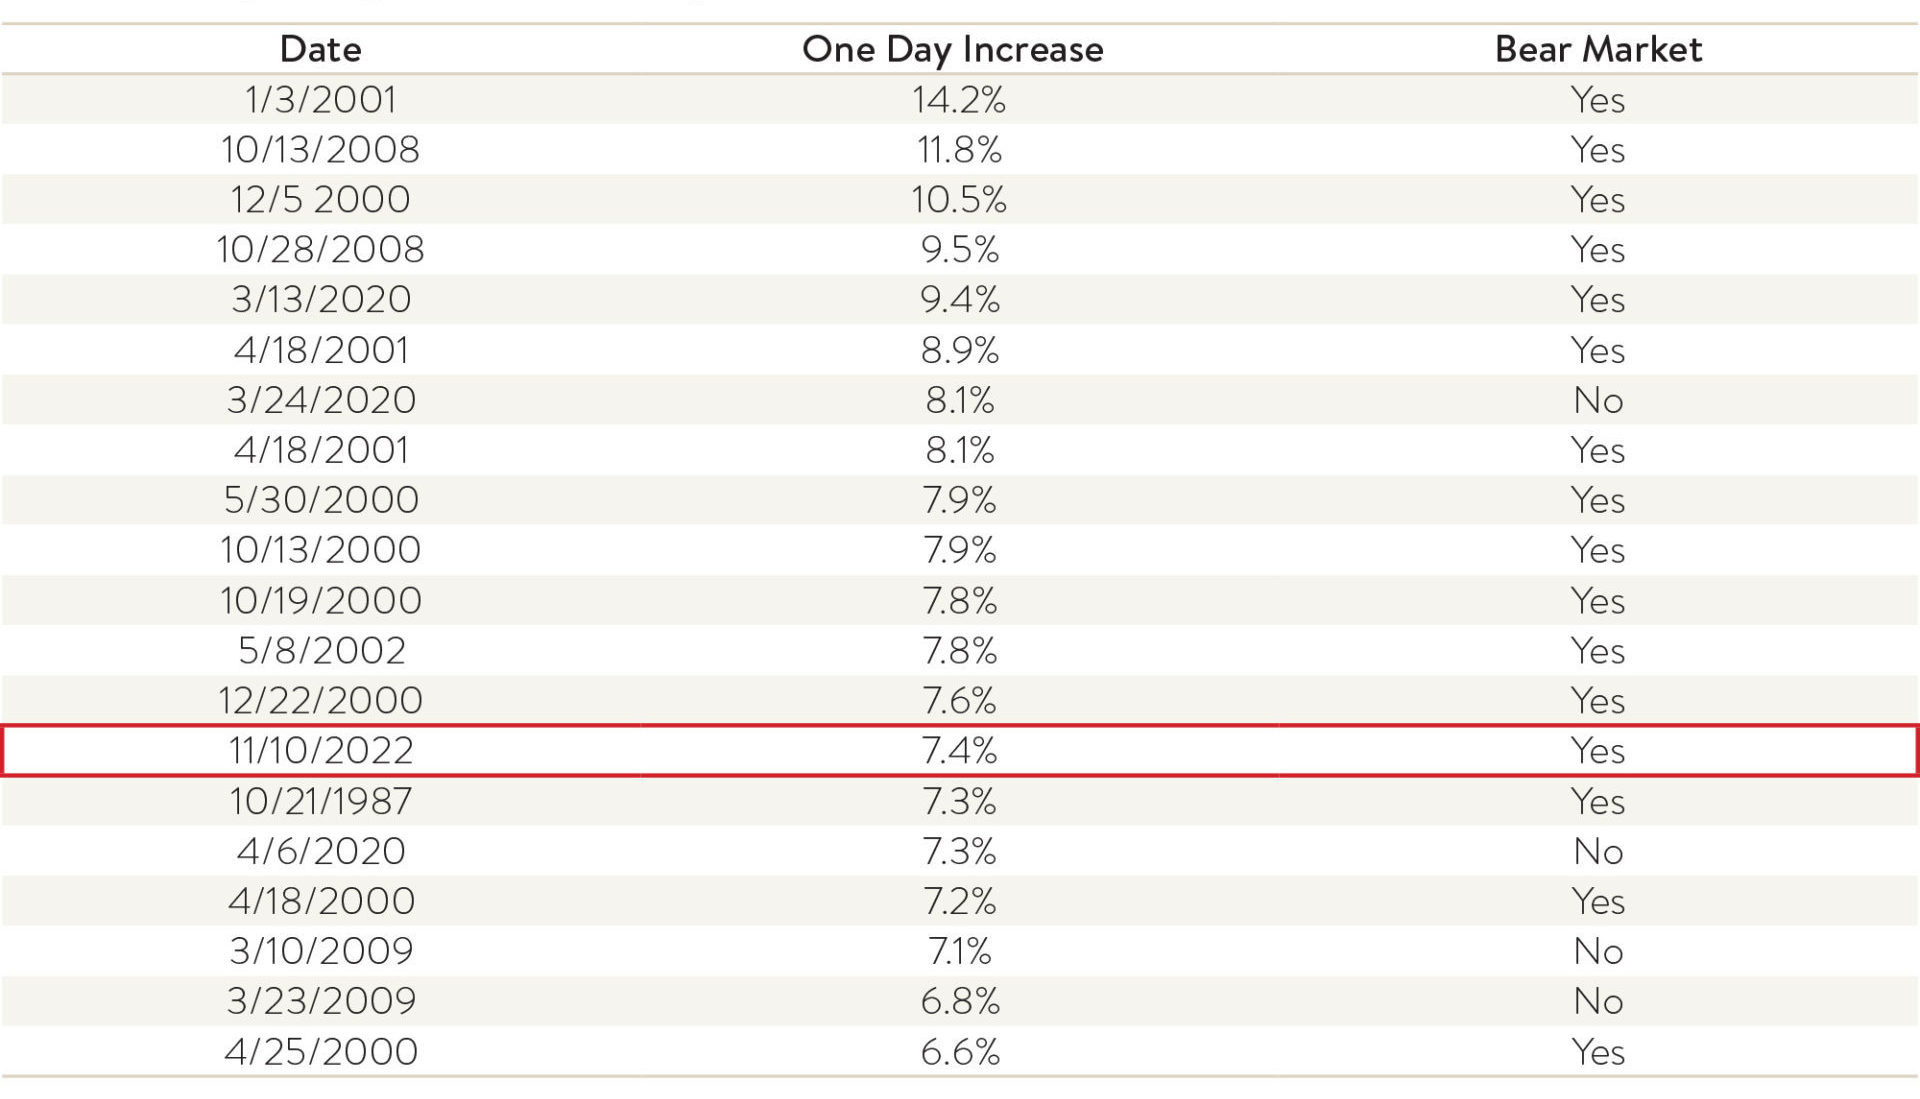
Source: Charles Schwab, Bloomberg. NASDAQ data as of 1971-11/10/2022.
Q3 reporting season – left field misses hurt
As many readers will know, in March and April we adjusted our portfolios to skew towards businesses with more resilient earnings growth and cleaner balance sheets as it became clear that the war in Ukraine would drive higher inflation and interest rates. We did this in anticipation of an economic slowdown caused by central banks seeking to whack demand to tame the inflation beast. History has taught many investors that inflation is a little like toothpaste – once it is out, it is hard to get back in!
In general, our adjustment has been prudent, and we have been satisfied with the performance of the Ophir strategies over the last 6 months or so since. This is despite underperformance in November, most of which was borne by our global equity strategies.
While we caution against getting caught up in short-term results – small caps can be notoriously volatile – there are three things worth mentioning about the November performance of our global equity strategies:
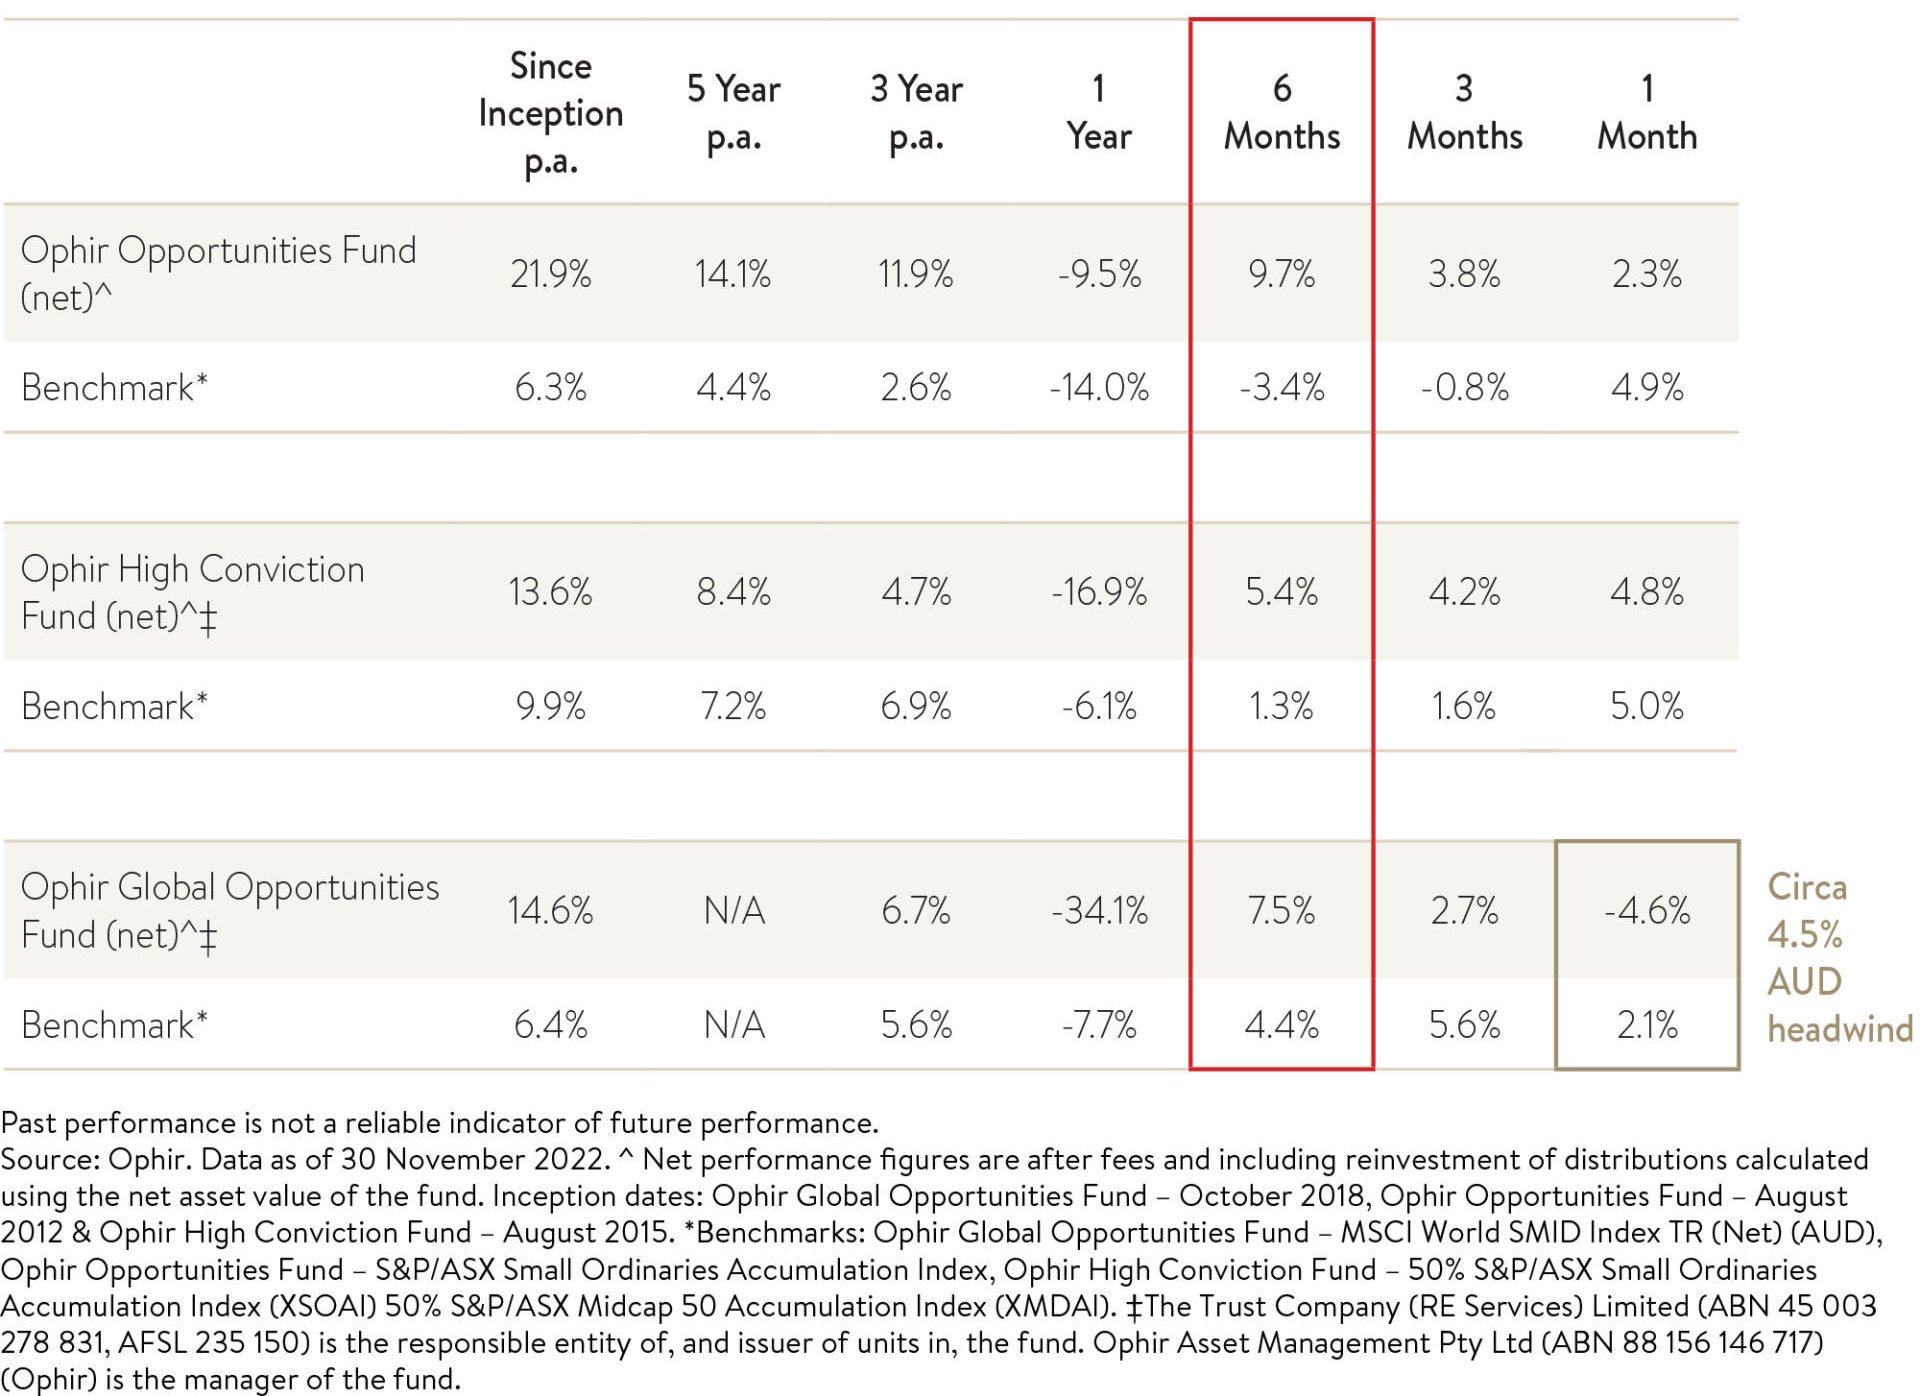
1. Being unhedged for currency can sometimes be a tailwind and sometimes a headwind. Generally, it tends not to matter too much over the long term either way. But as a default, we like unhedged as it ordinarily protects you when equity markets sell off because the Australian dollar typically depreciates. November happened to be one of those months where being unhedged (as the fund is) was a headwind, given the AUD appreciated against several major currencies, mostly notably 6.1% against the USD, as expected interest rate differentials fell. At a portfolio level, this created a 4.5% performance headwind and explains almost all of the -4.6% negative return for the Global Opportunities Fund during the month (see table below). It should be highlighted that it was also a circa -4.5% headwind for the benchmark too which is also unhedged.
Ophir Funds – Performance at 30 November 2022
2. Turning to relative performance compared to our benchmark, some of November’s underperformance was caused by being underweight in cyclical and bond proxy sectors (like Materials, Consumer Discretionary, Utilities and Real Estate) that outperformed the market as the softer U.S. inflation data increased the small chance of an economic soft landing. It’s important to restate that we aren’t going to change our investment style which has served us so well over the long term and start investing meaningfully in Utilities, Real Estate or Materials and Energy. And we aren’t going to chase cyclical sectors that did well during the month, but we believe may face headwinds as we progress further into an economic slowdown. In a macro driven market though we will have to accept that our style of investing can be buffeted from month to month with headwinds and tailwinds. As an extreme example, the average small cap growth company in the US is down about -45% from its high, whilst the domestic ASX 100 index (heavily influenced by the large cap Banks and Resource companies in Australia) is only down about -4%. Is this because Australia has better businesses, or is it due to the sector composition of the Australian share market, which is benefiting at this point in the cycle? Our conviction remains high that over the longer term, earnings growth that exceeds the market’s expectations will ultimately win out in driving share price performance, as it always has.
3. Finally, Q3 reporting season in the US, where companies report their financial results for the three months ending in September, was a more challenging one for us here at Ophir for our global strategies. Despite beats still comfortably outpacing misses, as a percentage of our global portfolios the level of earnings beats was lower and the level of earnings misses was higher in comparison to the Q2 (June) reporting season. This was not so much due to a lower (higher) number of beats (misses) but more due to some of the misses being in larger weight positions in our global strategies that were dealt with harshly by the market.
It is never pleasant when this happens during a reporting season and causes significant reflection by us and the team. We pride ourselves on getting our earnings calls right and limiting the misses (of which there will always be some) to smaller weight positions. A couple of key misses were from left field that we believe were largely unavoidable. This will sometimes happen where relatively unforecastable good or bad luck helps or hurts you during a reporting season. Over time these types of events tend to balance themselves out and what you are left with more is the outcome of your invest process.
Global Opportunities Fund Reporting Season Outcomes – Q3 2022
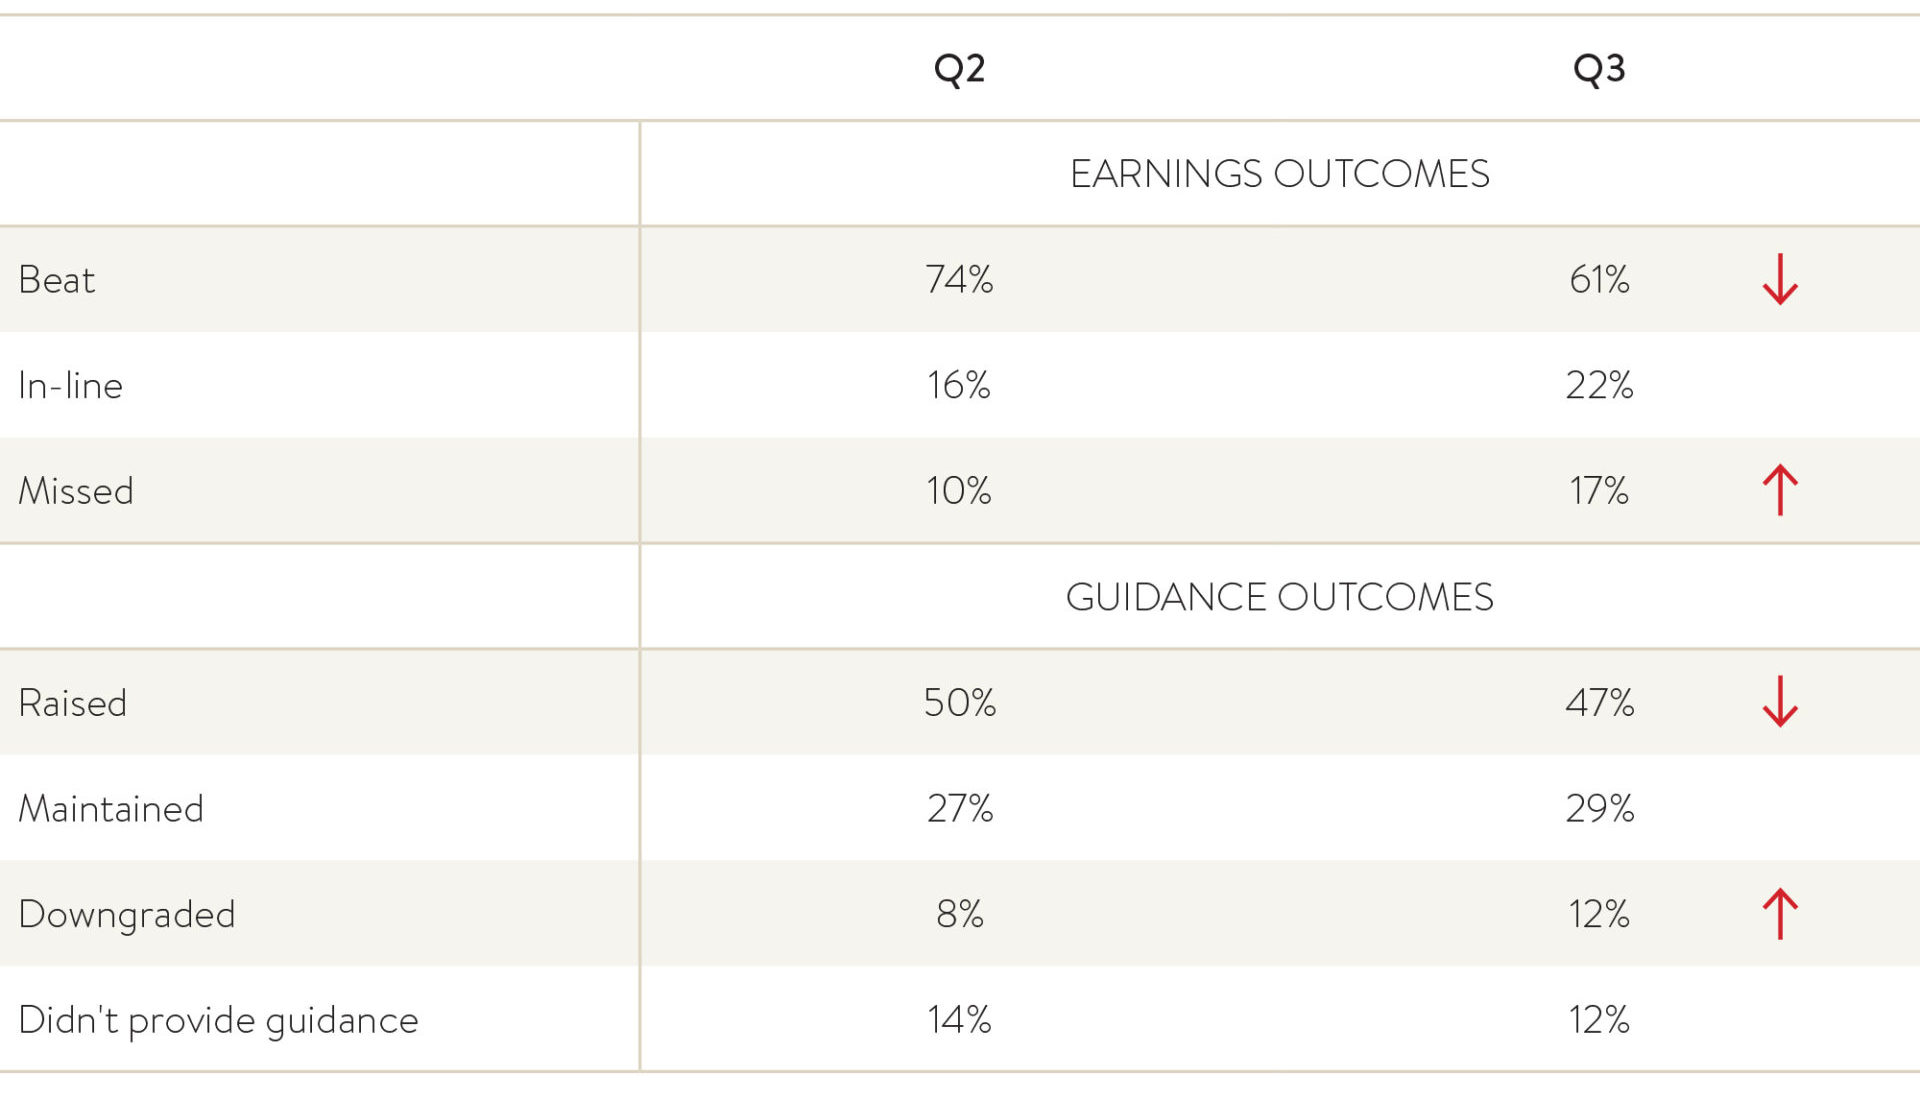
Source: Ophir
For example, our largest detractor across our global equities strategies in November was R1 RCM, a $6.7 billion market cap US business listed on the Nasdaq and was a 4% weight in our funds. It provides outsourced revenue cycle management for hospital systems and provider networks in the US. The company missed its quarterly EBITDA figure by approximately 13% due primarily to staffing issues at health insurers, meaning forecast incentive payments were not received on three hospital contracts. Guidance was also lowered for full year 2022 EBITDA by 10-15%. Unrelatedly, the CEO resigned to focus on his family after a decade with the company. As a result, the share price fell -51.2% in November. The downgrade was disappointing, given management reaffirmed earnings guidance just two weeks out from quarter end (see chart/commentary below). In our opinion, the share price reaction was outsized, but it speaks volumes to the stage we are at in the broader market earnings cycle.
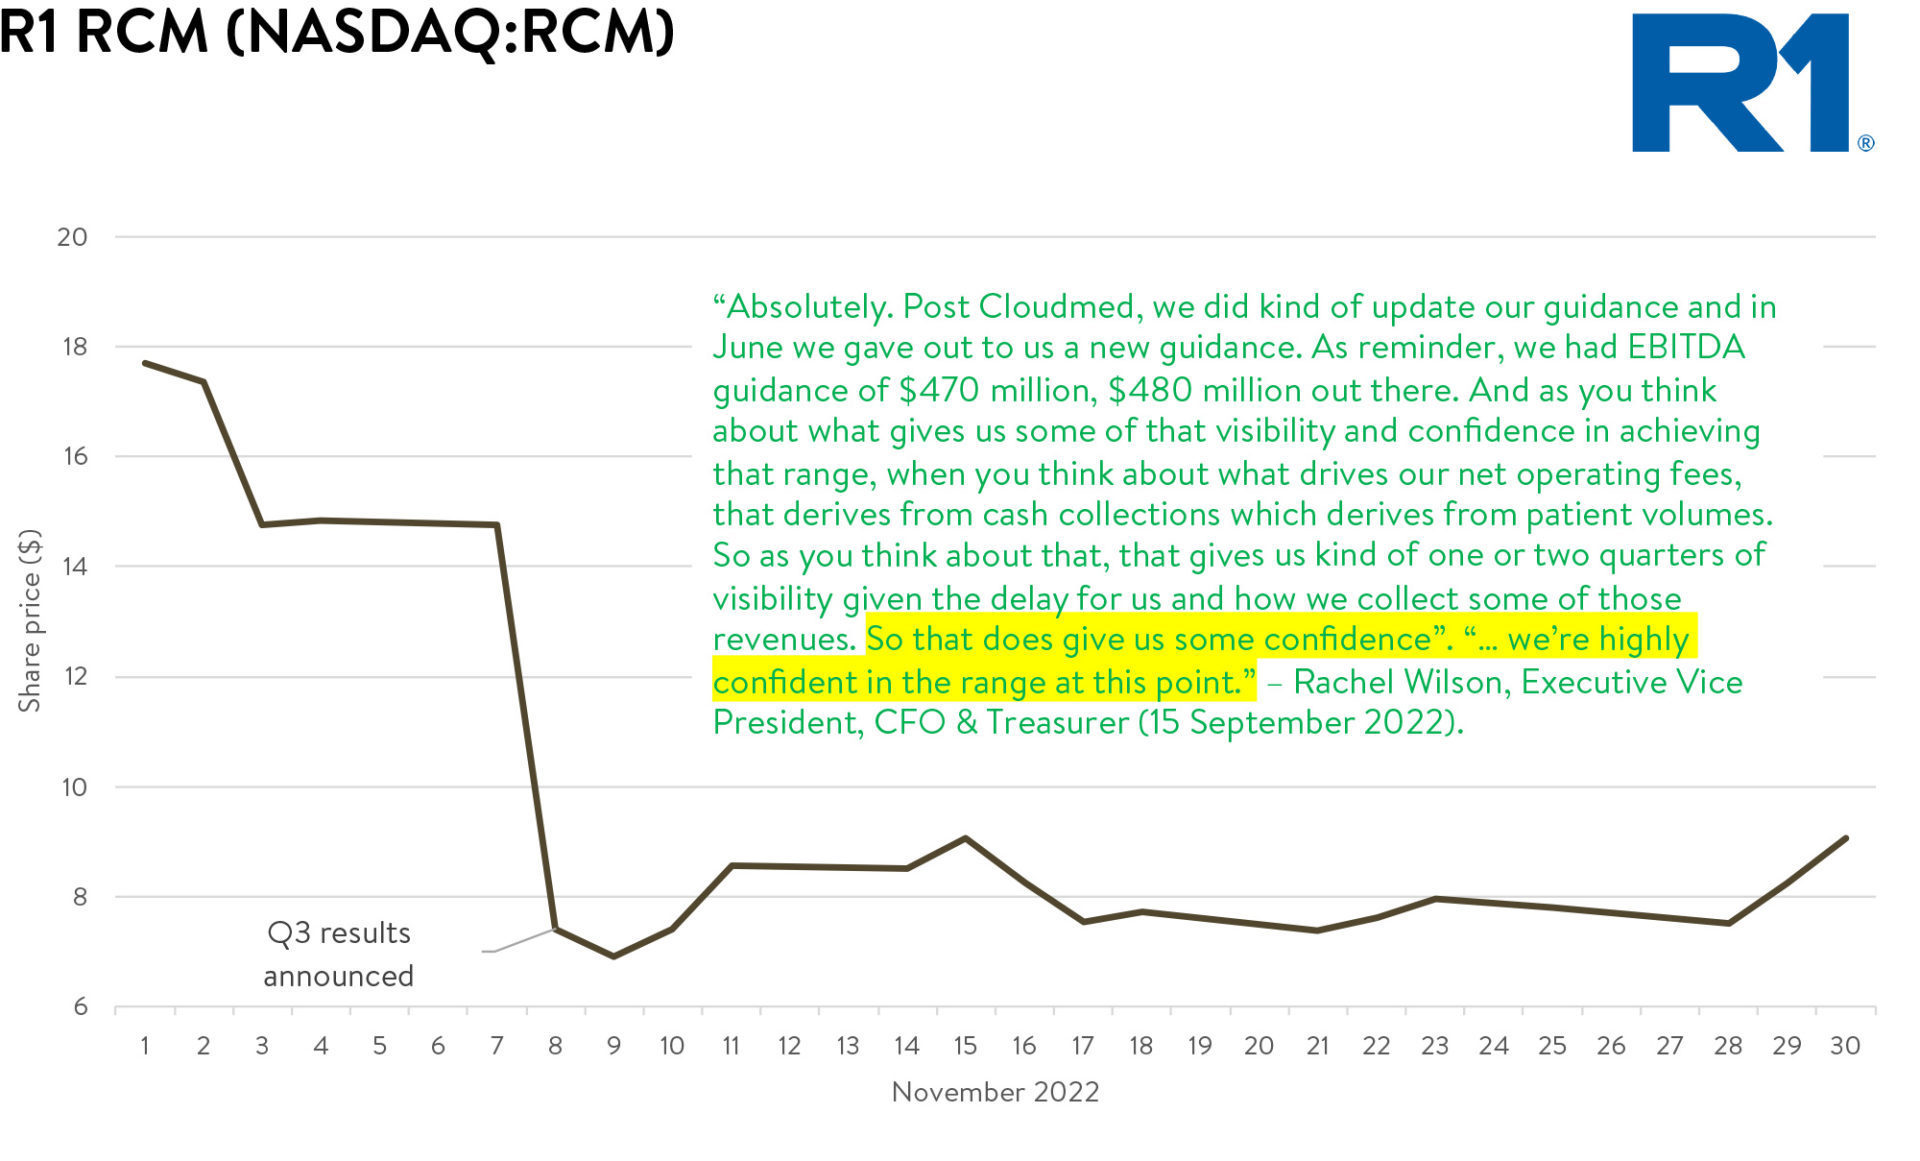
Source: Company Data & Factset. Data from 1 November 2022 to 30 November 2022.
It also illustrates how violent the share price sell offs in US small caps can be at this stage of the cycle when earnings miss and non-fundamental investors hiding in stocks in defensive sectors bail out.
For comparison, Australian listed company Bravura (not held), which provides software-based administration solutions to the pension, investment management and life insurance industries, cut full year EBITDA guidance in November by 70% and is now predicting a net loss and suspension of dividends as people costs rise following a strategic pivot. Comparatively, the stock was “only” down 35.3% on the month.
On the flip side, one of our best-performing Q3 earnings results for our global strategies was Pure Storage. This US-based business provides enterprise-grade data storage hardware and software solutions to manage data infrastructure in the cloud for businesses. Founded in 2009 and taken public in 2015, it now counts more than half the Fortune 1000 as customers. Its quarterly earnings beat by more than 20% and upgraded its earnings outlook by 30%, yet the share price was only up 3.6% on the news.
So, what gives?
We are at a stage of the cycle where downgrades, especially those of companies where some investors were hiding due to what they thought was a defensive sector, are dealt with harshly, whilst some investors are using beats/upgrades as liquidity events to sell small caps and reposition portfolios.
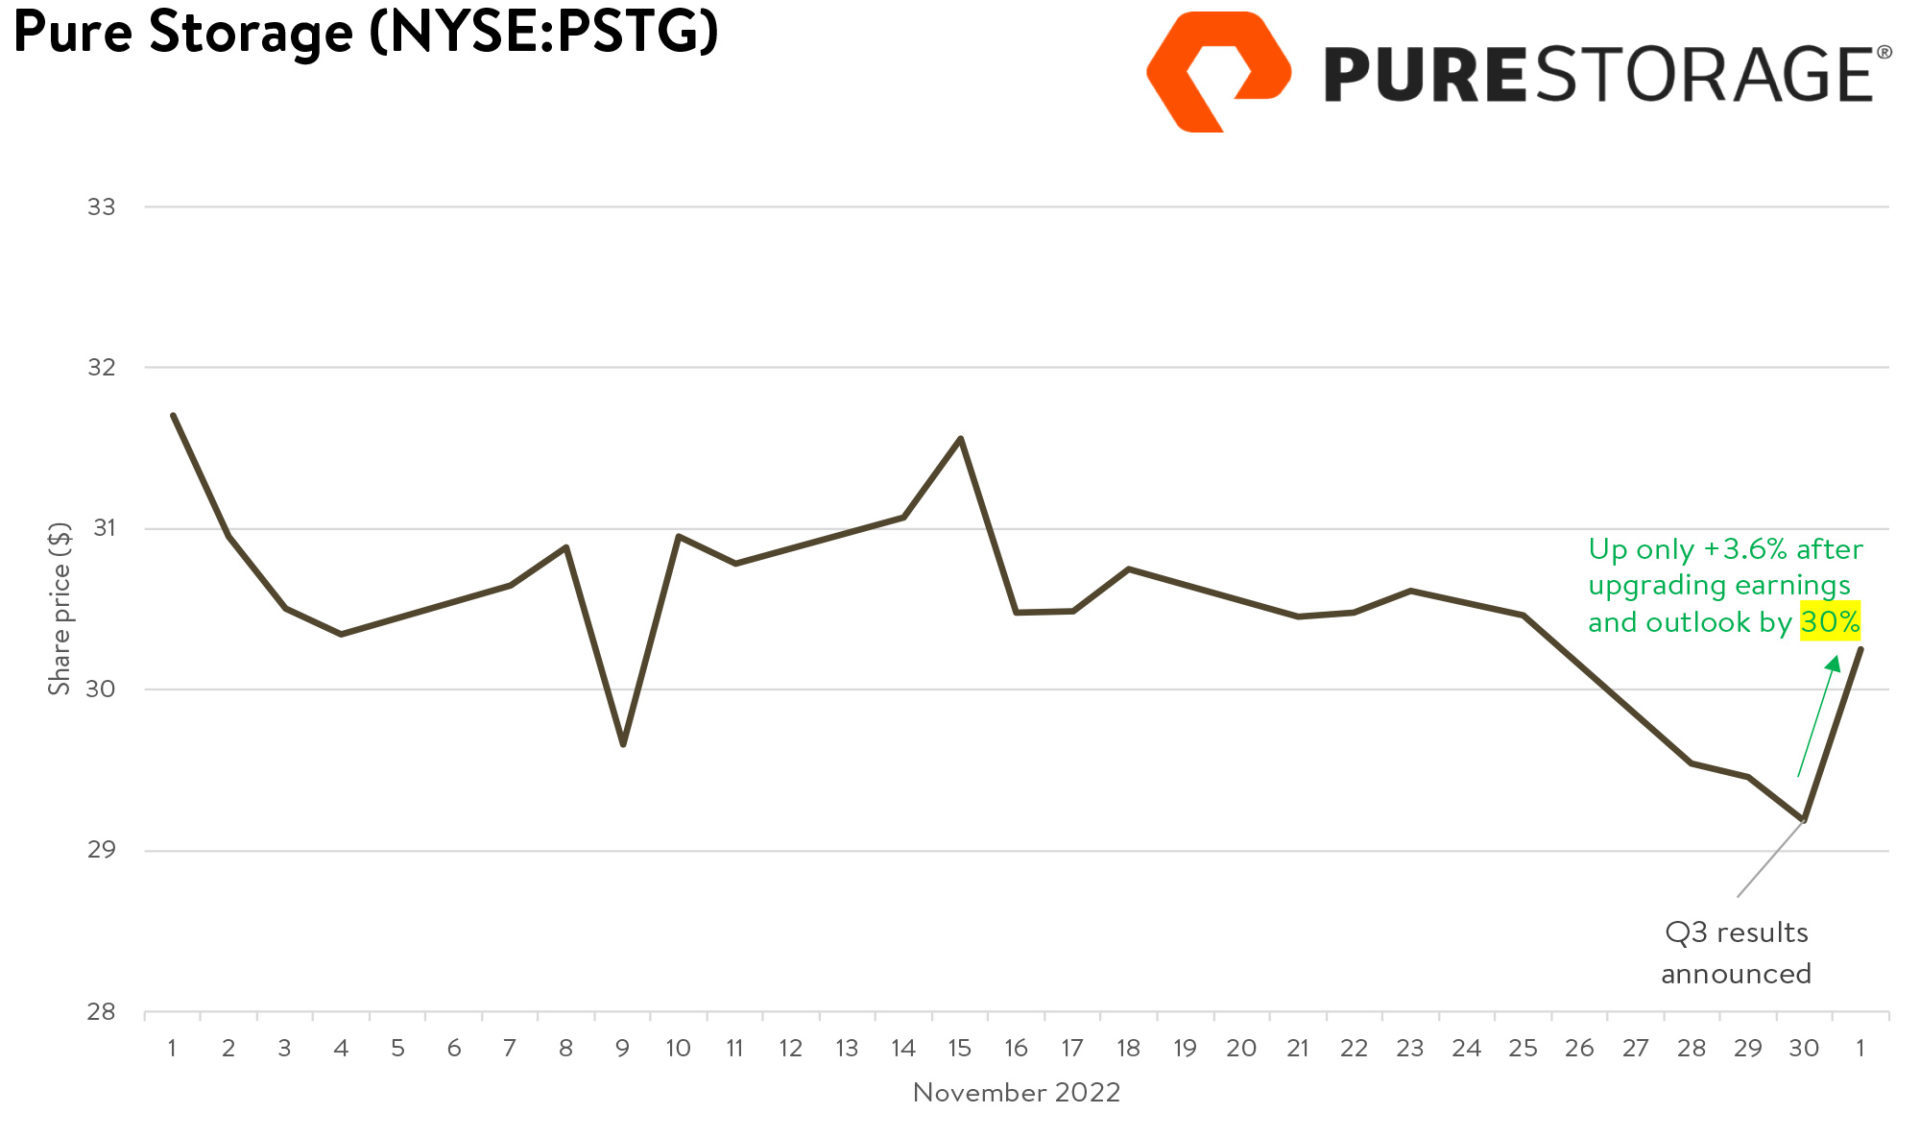
Source: Company Data & Factset. Data from 1 November 2022 to 1 December 2022.
This is not unexpected and is, in some sense, normal, given where we are in the market cycle. But it also is an opportunity. When share prices don’t move in line with fundamentals like earnings because macro events or liquidity are driving price action, bargains can be had for careful investors. While earnings will win the day ultimately, this may not be until there is greater clarity on when central banks plan to pivot rates and how much demand destruction they finally cause.
That 70s show
“The farther back you can look, the farther forward you are likely to see” – Winston Churchill
Naturally, many investors are looking for historical parallels to today’s events to get a read on how they may play out.
The most frequently cited analogy is the 1970s where the similarities run deep. Sky high inflation, low growth, stop-and-go economic policies, political instability, war, oil shocks, the list goes on.
Investors are asking themselves if share market returns will be a rerun of the 1970s too. In December 1974, the Fed began a sustained pivot as GDP fell sharply during the recession and unemployment rose. The share market was down around -40%. What happened next was one of the greatest ever bull runs for US small caps, topping the performance tables for the next 5 years in a row, up a staggering 428%! (see chart).
It’s a phenomenon we often see in recessions. The US entered a recession in 1973, and US small caps fell first and farthest. But once the Fed pivoted in the latter part of 1974, they came back rallying the hardest.
History, and our experience, suggest such volatility is part of small cap investing. Weak hands can often get shaken out of the asset class at just the wrong time. Personally, we have a long time horizon and are familiar with the outsized ups and downs of small caps. This makes us comfortable investing all our liquid personal wealth in the Ophir small cap funds that we specialise in. For others, though, we suggest allocating no more than you’d be comfortable holding through a -50% or even -60% drawdown, as history shows, is possible.
Equally, the returns on the other side of drawdowns can be similarly steep, as the historical experience during the late 70s shows.
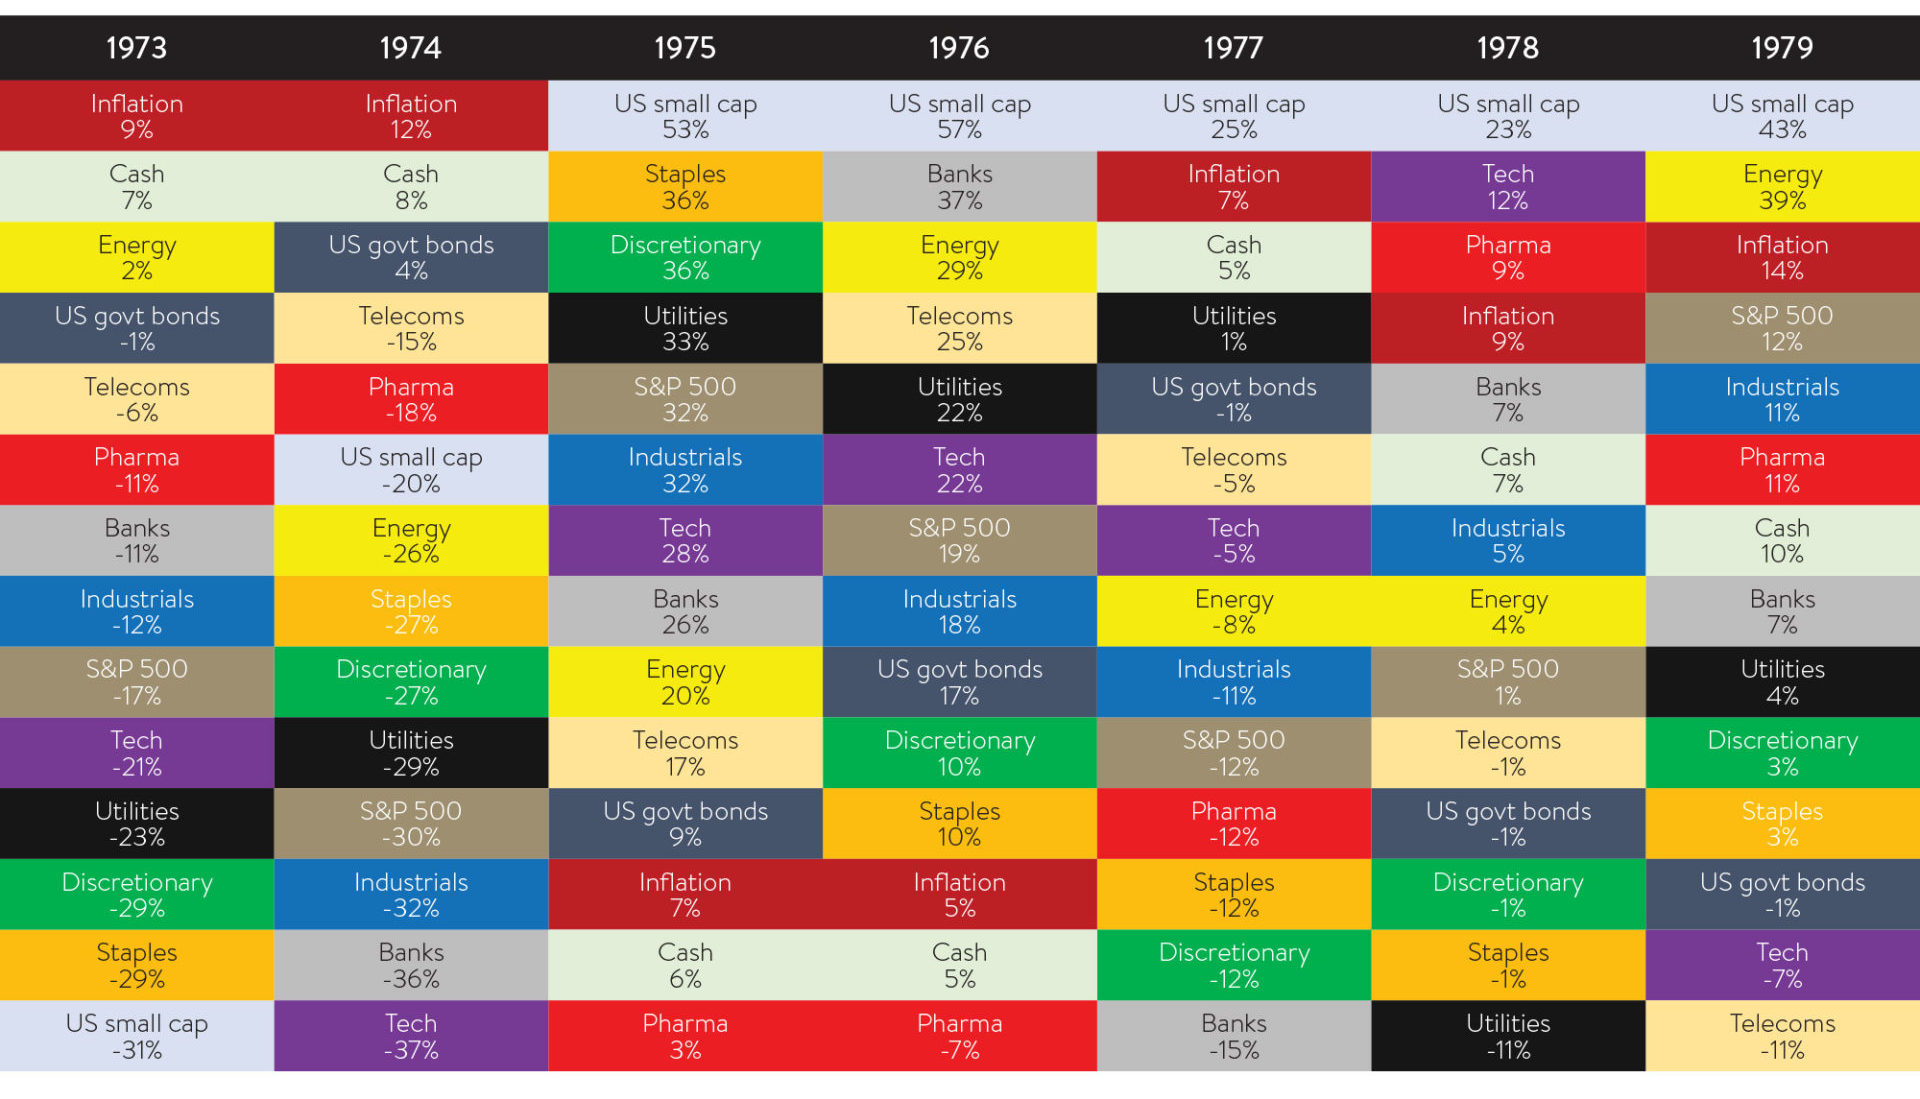
Source BofA Global Investment Strategy, Bloomberg.
We think there are a number of reasons to believe US small caps might outperform other asset classes in the eventual recovery and subsequent period. Two most important being US small cap valuations are trading at multi-decade lows versus large caps and they are more leveraged to an economic rebound so generally rally harder out of bear markets and recessions.
As seen below from Morningstar, US small cap valuations are back down around their GFC lows, well below their 10 year average and already seem to be discounting in a pretty serious recession ahead. The same cannot be said for US large caps which are still almost twice their GFC low valuations.
Price/earnings ratios by market cap
Trailing 12-month p/e ratios
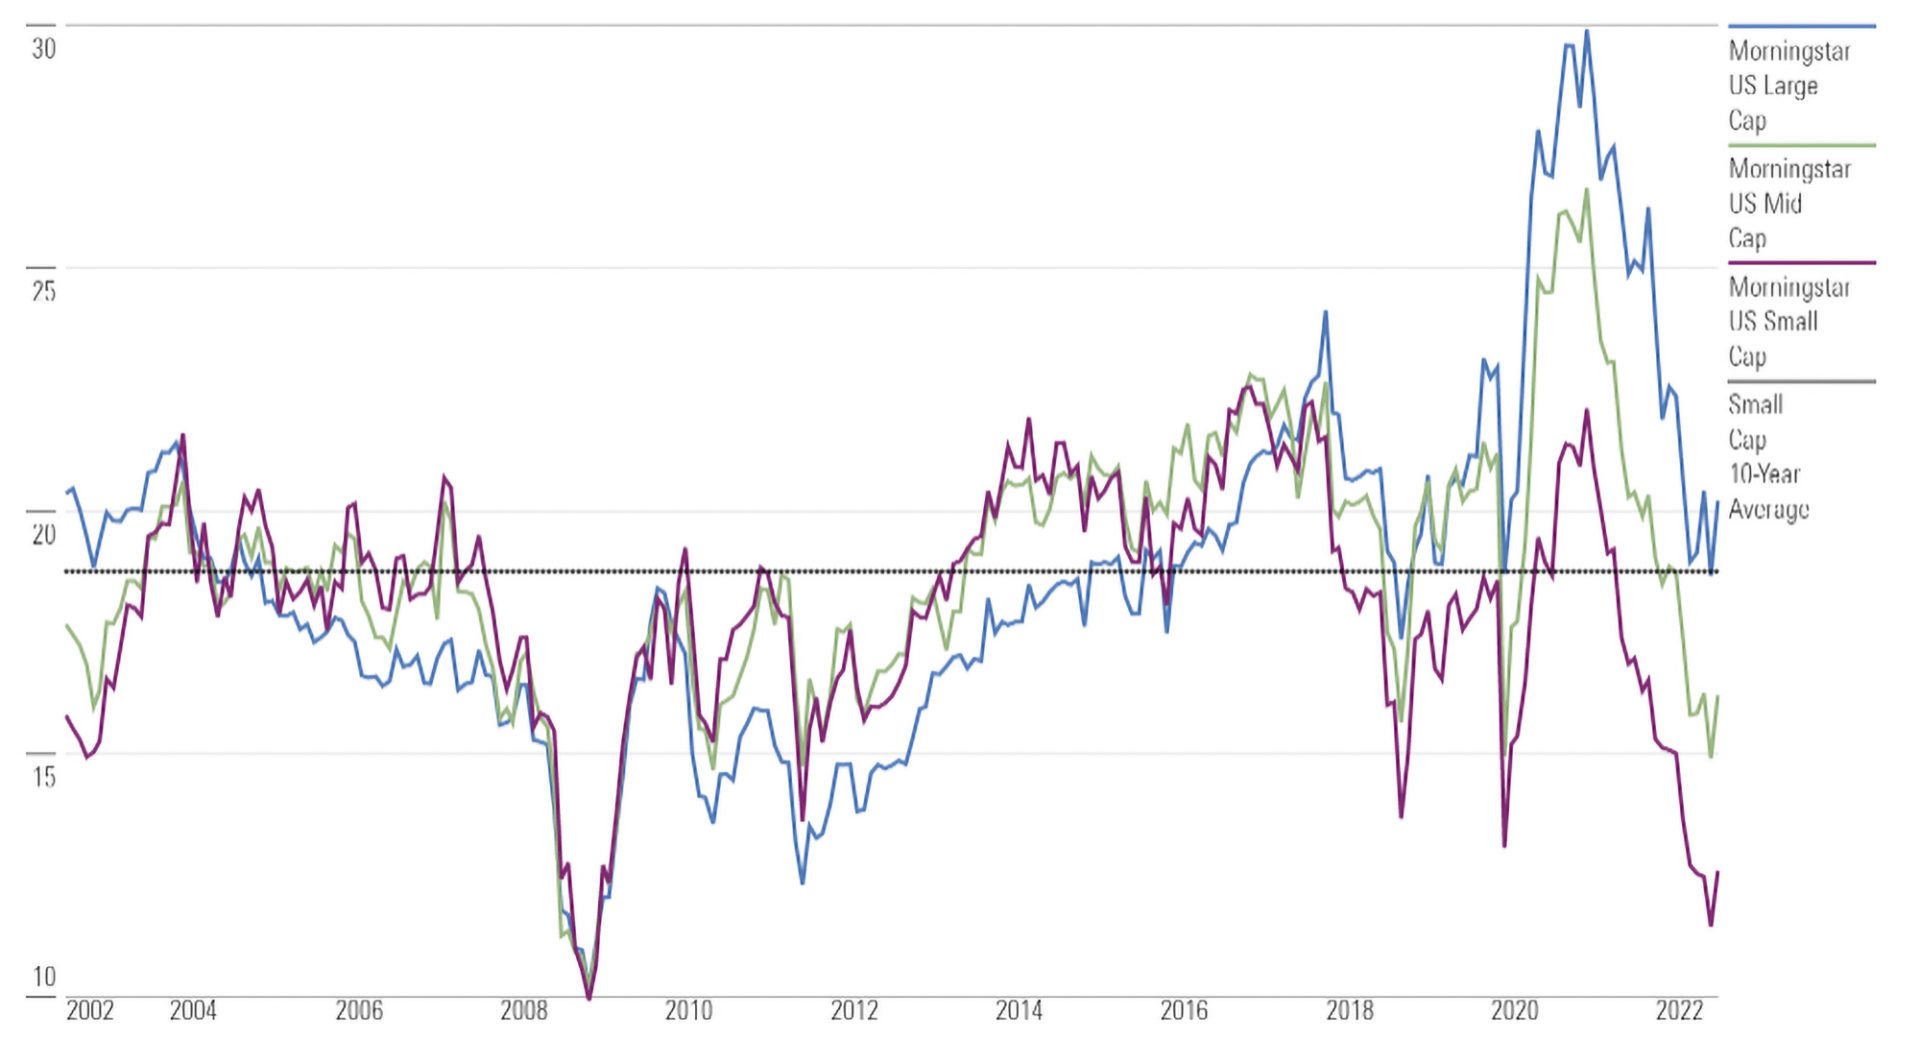
Source: Morningstar Direct, Morningstar Indexes. Data as of 31 October 2022.
It’s clear our style of small cap investing in growth-orientated business has taken a lot of the pain already in this market sell off. We believe investors need to be patient at these difficult times as they can lead to significant rewards in the eventual recovery.
For now, we and the team are laser focused on finding businesses that can provide and maintain resilient growth and avoid downgrades during the current economic slowdown. History suggests the market will rebound before the economy does. Timing the market bottom is not something any investor, including us, can control. But being there for the eventual recovery is.
As always, thank you for entrusting your capital with us.
Kindest regards,
Andrew Mitchell & Steven Ng
Co-Founders & Senior Portfolio Managers
Ophir Asset Management
This document is issued by Ophir Asset Management Pty Ltd (ABN 88 156 146 717, AFSL 420 082) (Ophir) in relation to the Ophir Opportunities Fund, the Ophir High Conviction Fund and the Ophir Global Opportunities Fund (the Funds). Ophir is the trustee and investment manager for the Ophir Opportunities Fund. The Trust Company (RE Services) Limited ABN 45 003 278 831 AFSL 235150 (Perpetual) is the responsible entity of, and Ophir is the investment manager for, the Ophir Global Opportunities Fund and the Ophir High Conviction Fund. Ophir is authorised to provide financial services to wholesale clients only (as defined under s761G or s761GA of the Corporations Act 2001 (Cth)). This information is intended only for wholesale clients and must not be forwarded or otherwise made available to anyone who is not a wholesale client. Only investors who are wholesale clients may invest in the Ophir Opportunities Fund. The information provided in this document is general information only and does not constitute investment or other advice. The information is not intended to provide financial product advice to any person. No aspect of this information takes into account the objectives, financial situation or needs of any person. Before making an investment decision, you should read the offer document and (if appropriate) seek professional advice to determine whether the investment is suitable for you. The content of this document does not constitute an offer or solicitation to subscribe for units in the Funds. Ophir makes no representations or warranties, express or implied, as to the accuracy or completeness of the information it provides, or that it should be relied upon and to the maximum extent permitted by law, neither Ophir nor its directors, employees or agents accept any liability for any inaccurate, incomplete or omitted information of any kind or any losses caused by using this information. This information is current as at the date specified and is subject to change. An investment may achieve a lower than expected return and investors risk losing some or all of their principal investment. Ophir does not guarantee repayment of capital or any particular rate of return from the Funds. Past performance is no indication of future performance. Any investment decision in connection with the Funds should only be made based on the information contained in the relevant Information Memorandum or Product Disclosure Statement.


