By Andrew Mitchell & Steven Ng
Co-founders and Senior Portfolio Managers

In this month’s Letter to Investors we cover how Wall Street strategists are more divided than ever on the outlook for the U.S. share market in the second half of 2023. If there is a consensus, it’s a more bearish one and we highlight what are the key takeaways for investors, including how it factors into our portfolio positioning.
Welcome to the June Ophir Letter to Investors – thank you for investing alongside us for the long term.
Newton’s first law
As any physics buff will know, Sir Isaac Newton’s First Law of Motion is that an object persists in its state of motion unless acted upon by an external force.
Once in motion it stays in motion until something stops it.
While investing is not bound by the hard math of the physical sciences, June certainly seemed like the path of least resistance with share markets continuing to rise.
All the majors put on good to great gains, led by US Small Caps (Russell 2000 +8.1%), Japan (Nikkei 225 +7.6%), US tech (Nasdaq +6.7%), US Large Caps (S&P500 +6.6%), Europe (Euro Stoxx50 +4.4%), & finally Australia (ASX200 +1.8%).
Up until June, this year markets had mostly been driven by the so-called ‘Magnificent 7’: the collection of Mega Cap US Tech stocks that includes Apple, Microsoft, Alphabet (Google), Amazon, Nvidia, Meta and Tesla. Their share prices have been boosted by AI hopes and a flight to quality in the face of March’s Silicon Valley Bank collapse.
The ‘knock’ on share markets is the rally had no breadth this year.
That changed in June.
As shown in the chart below, the small (SML Index) and mid-cap (MID Index) segments of the US share market got in on the party last month. In June, they recorded more than 100% of their year to date (YTD) gains (they were actually down on the year prior to June).
Equities Posted Strong Returns in June
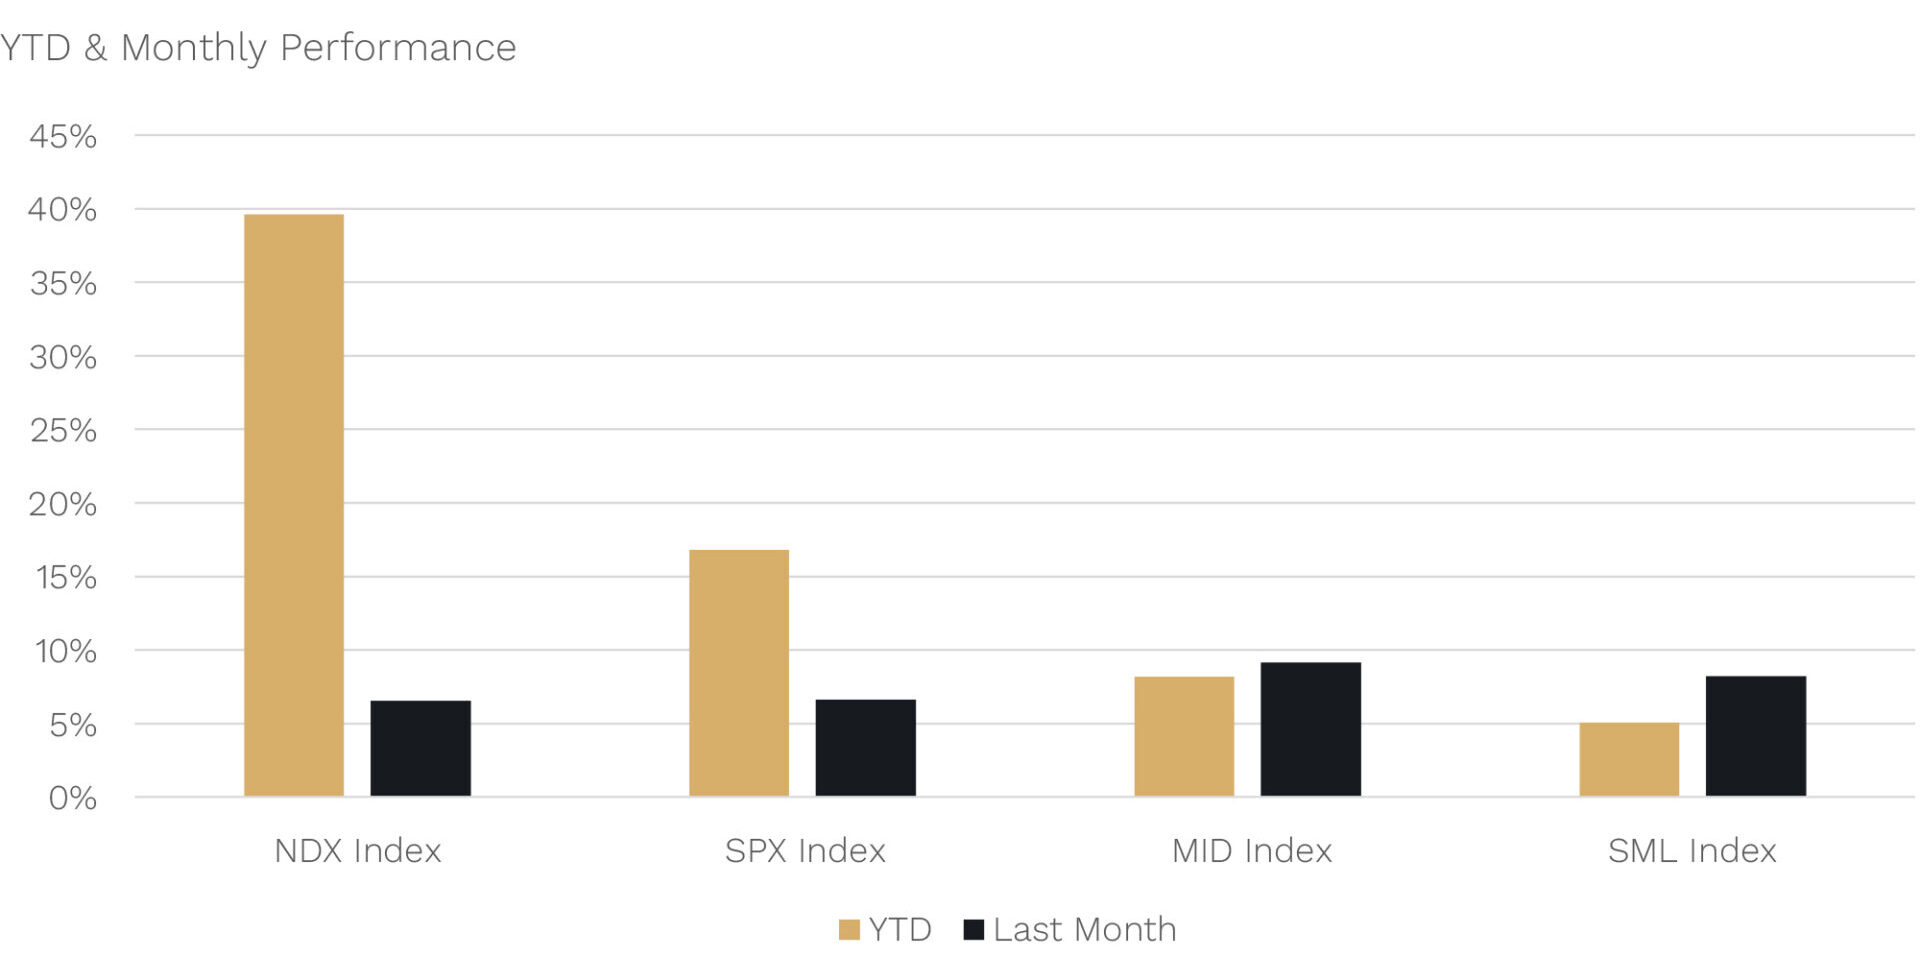
Source: Bloomberg, Morgan Stanley Research. As of 30 June 2023.
But small and mid-cap stocks still lag significantly behind market indices such as the Nasdaq 100 (NDX Index) and S&P500 (SPX Index) that include the Magnificent 7.
June 2023 Ophir Fund Performance
Before we jump into the letter in more detail, we have included below a summary of the performance of the Ophir Funds during June. Please click on the factsheets if you would like a more detailed summary of the performance of the relevant fund.
The Ophir Opportunities Fund returned +3.6% net of fees in June, outperforming its benchmark which returned 0.0%, and has delivered investors +21.3% p.a. post fees since inception (August 2012).
Download Ophir Opportunities Fund Factsheet
The Ophir High Conviction Fund (ASX:OPH) investment portfolio returned +1.7% net of fees in June, outperforming its benchmark which returned +0.5%, and has delivered investors +13.1% p.a. post fees since inception (August 2015). ASX:OPH provided a total return of +5.1% for the month.
Download Ophir High Conviction Fund Factsheet
The Ophir Global Opportunities returned +3.2% net of fees in June, underperforming its benchmark which returned +3.3%, and has delivered investors +13.9% p.a. post fees since inception (October 2018).
Download Ophir Global Opportunities Fund Factsheet
An external force
Which brings us to the question: What could be the external force that stops a market in motion? Will there even be one?
Ultimately, share market are bound by laws of gravity. And those share market laws, while they are a lot flimsier and less iron clad than Isaac Newton would like, means that share prices are ultimately determined in the long term by earnings growth.
So far this year though virtually all of the market gains for global shares as a whole, and particularly the US share market, have been driven by valuation expansion. That is, rather than earnings growth driving the market higher, investors have simply been willing to pay more for a dollar’s worth of earning today.
While this can go on in the short term, it can’t go on forever.
Pros are bearish but split
If we look at what Wall Street’s finest forecasters are saying for the US share market, the general view is pretty bearish. In fact, as highlighted below, the forecast average across the 23 forecasters for the second half of this year is the worst on record at a -7% return for the S&P500.
Wall Street Strategists Stick to Cautious Equity View
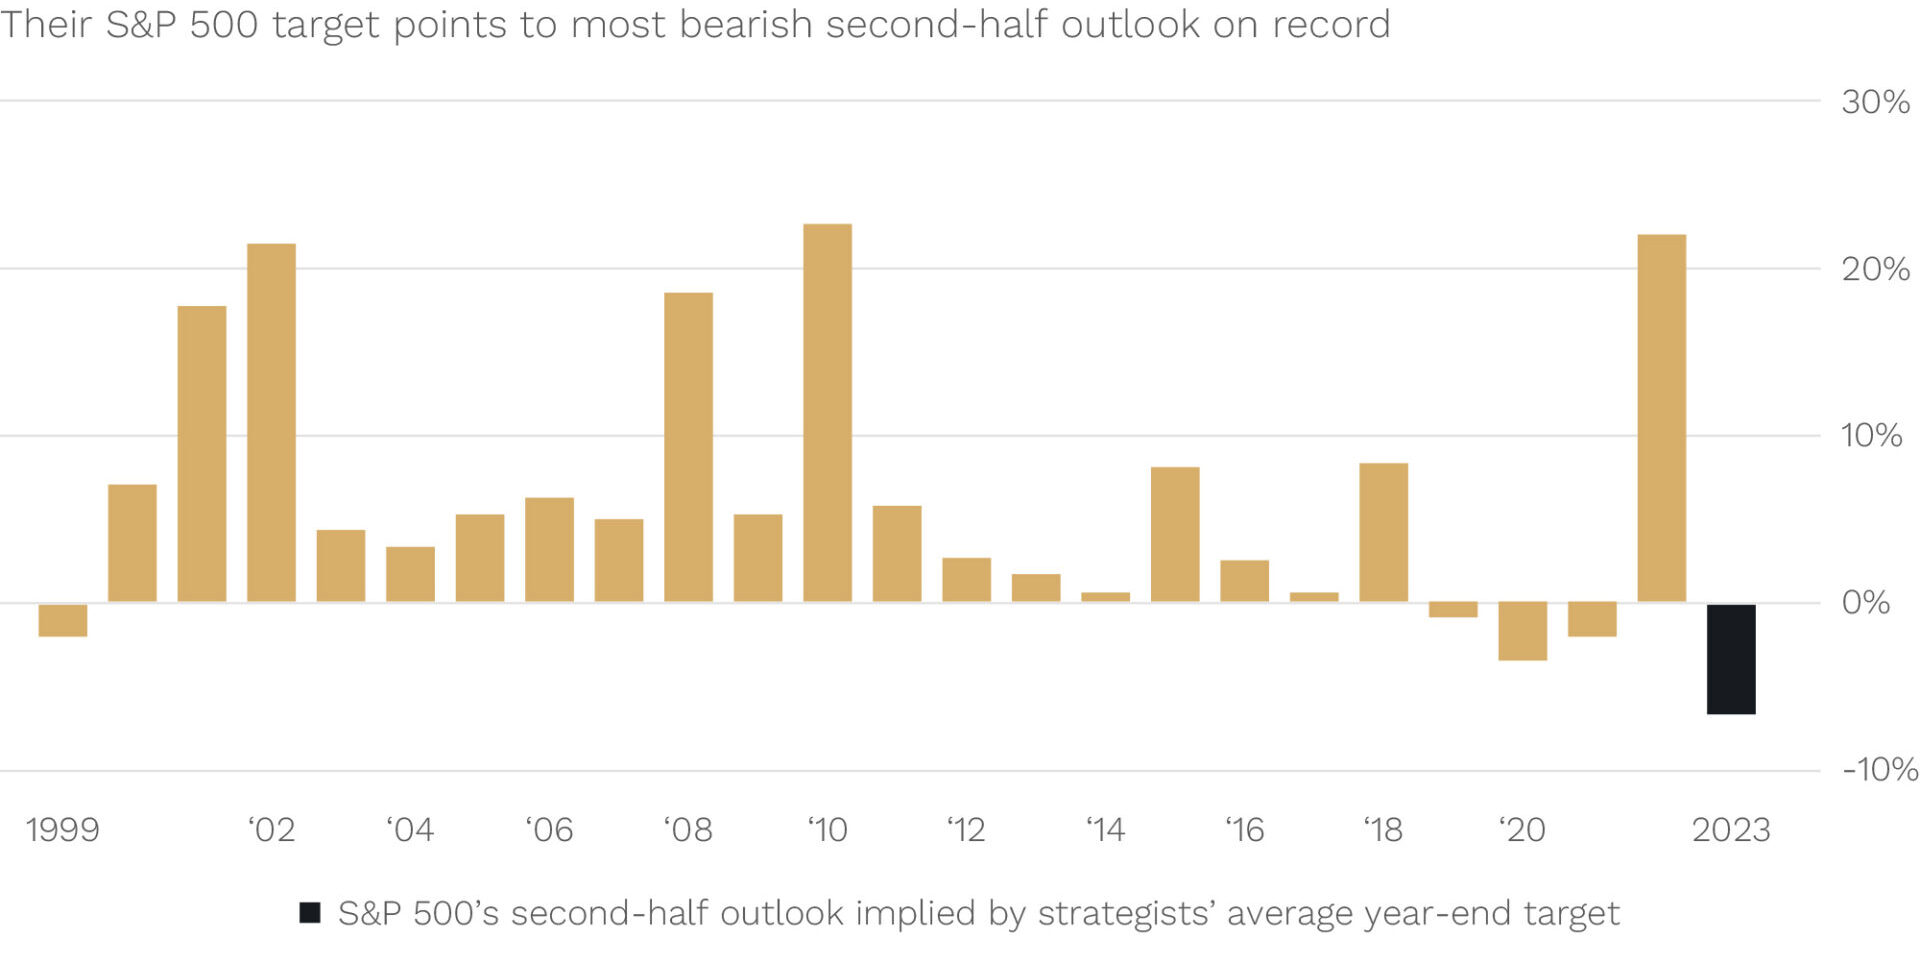
Source: Bloomberg.
Now, before you go and cash in your share market chips for the next six months, know that their track record makes your local astrologer look like a Nobel Prize winner. Their value is generally not in their specific market return forecasts, but more often in the risks they highlight.
And before you think they are all bearish too, on at least on one measure, they are the most divided they have ever been. In fact, the difference between the most bullish and bearish of the 23 forecasters for the S&P500 at year end is 50%. Talk about throwing a dart at a dartboard!
Wall Street Sharply Split on S&P 500 Path
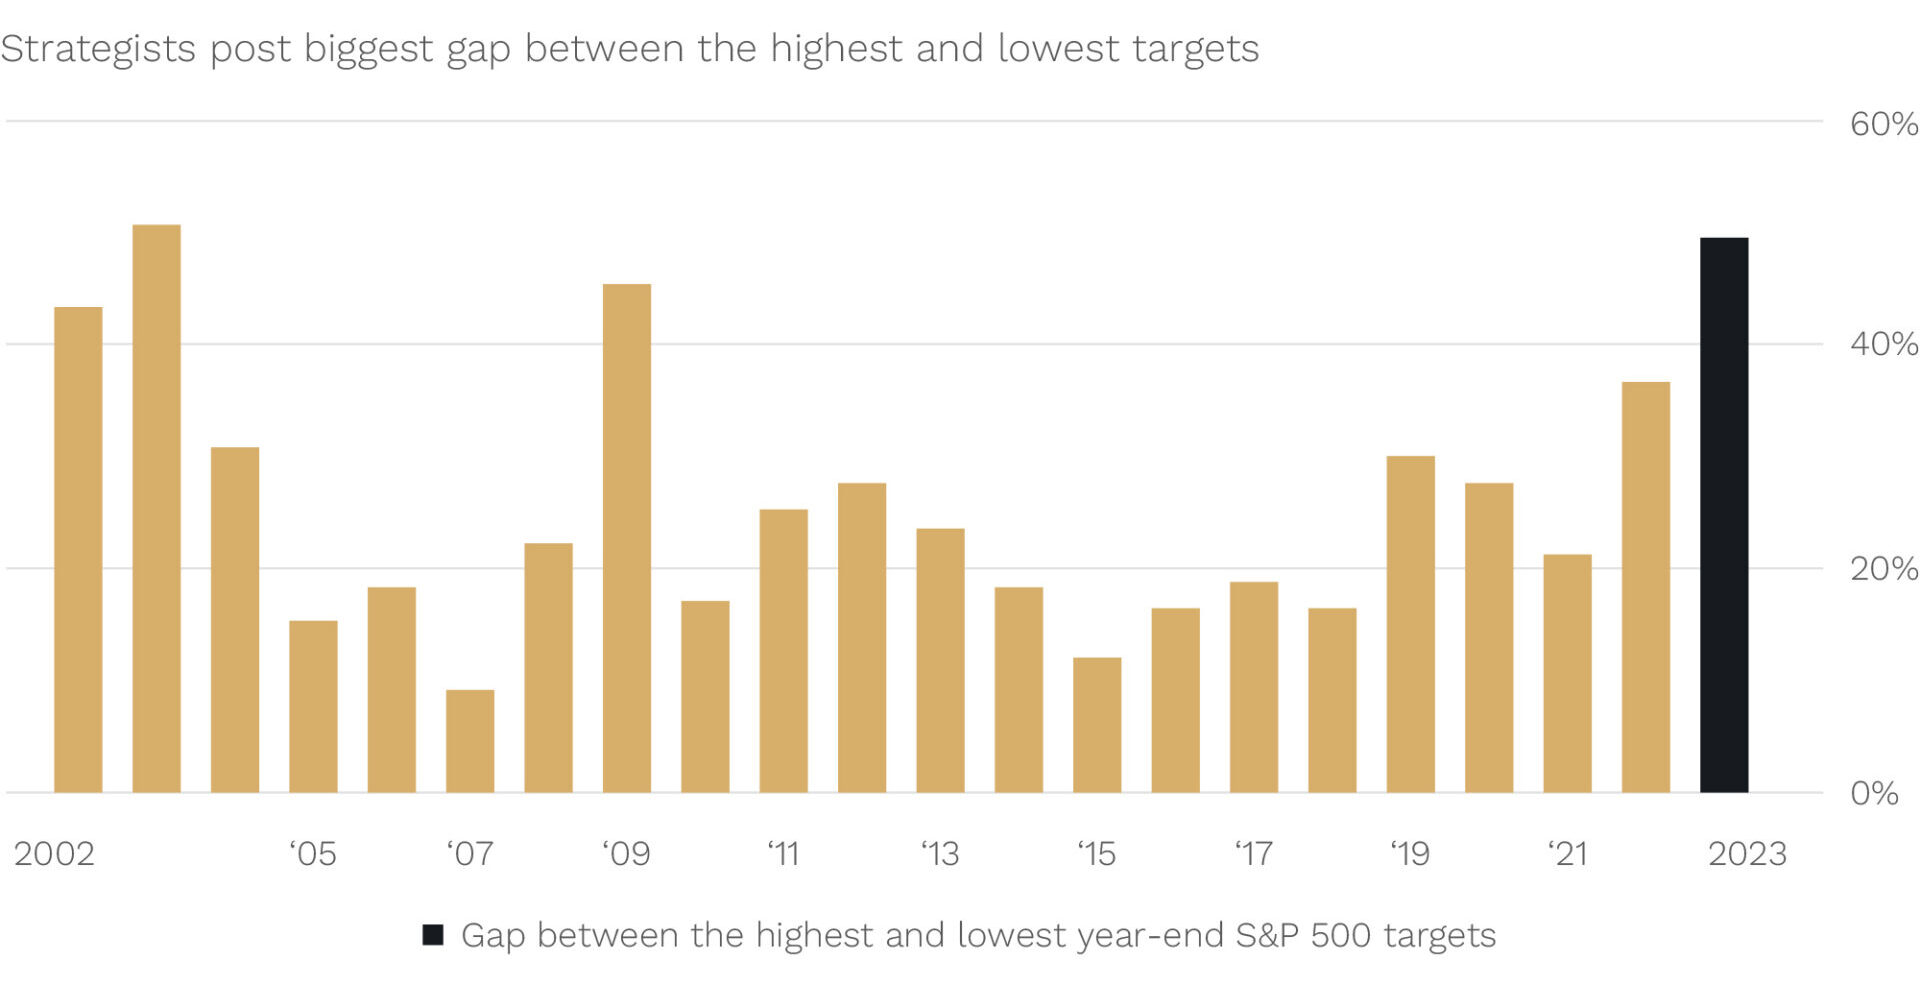
Source: Bloomberg.
So how do we reconcile this ‘bearish but split’ view?
1. The bearish case for why market momentum will stall
If we look at the bears first, they see two primary external forces they believe could halt the market’s motion.
a) US large-cap valuations have gotten to more extreme levels, particularly versus bonds
On this first point, below we show this with the so called, “equity risk premium (ERP)” for the S&P500. The ERP is really just fancy industry jargon for saying how much more expected return in earnings from the S&P500 in the next year (that is the “premium”) do you expect versus a risk free investment in US 10 year government bonds.
US Equity Risk Premium is Below Post GFC Lows

Source: FactSet, Bloomberg, Morgan Stanley Research as of 30 June 2023. Note: ERP based on forward earnings yield and 10 year Treasury Yield.
As you can see above, the ERP is at ultra-low levels.
Essentially, that indicates that US large caps look expensive versus bonds.
Why?
Well, the price (or market value) of the S&P500 has gone up, while its forecast for corporate earnings this year has remained virtually unchanged, reducing its earnings yield. At the same time, the US 10-year treasury yield has risen as the Fed has raised rates and exited from quantitative easing.
The bottom line is equity/share market investors in US large caps are getting scant reward for taking share market risk compared to now higher bond yields. This can only go on so long and should limit equity valuations rising to the sky like some perpetual motion machine.
b) Earnings growth is slowing as the lagged impact of rate hikes take their effect.
Secondly, while the consensus forecast for corporate earnings growth in the US has been revised down to be basically flat for 2023, many still see this as ‘Pollyanna-ish’ in the face of the fastest Fed hiking cycle in decades. The consequence of which is usually recession and earnings falls.
This is the major external force that the “you just wait and see” bears cite as the inevitable headwind for the market.
Smalls sit out rally
A further fact that personally makes us still a little cautious of the durability of this US bull market (up more than 20% from its October 2022 lows) is there has been little participation from smaller companies.
This stands in stark contrast to prior cycle upturns.
We show this below where the equal weighted S&P500 has underperformed the market cap weighted version over the last nine months since its lows (see black line). The equal weight version in comparison places higher weights on smaller companies and is therefore comparatively influenced more by their performance.
Sustainable bull markets are usually built on solid and broad foundations. We might still get this, and June was a step in the right direction, but in our view it’s not sufficiently evident yet.
Large Cap Equity Equal Weighted vs. Cap Weighted Return Post Cycle Low in Equities
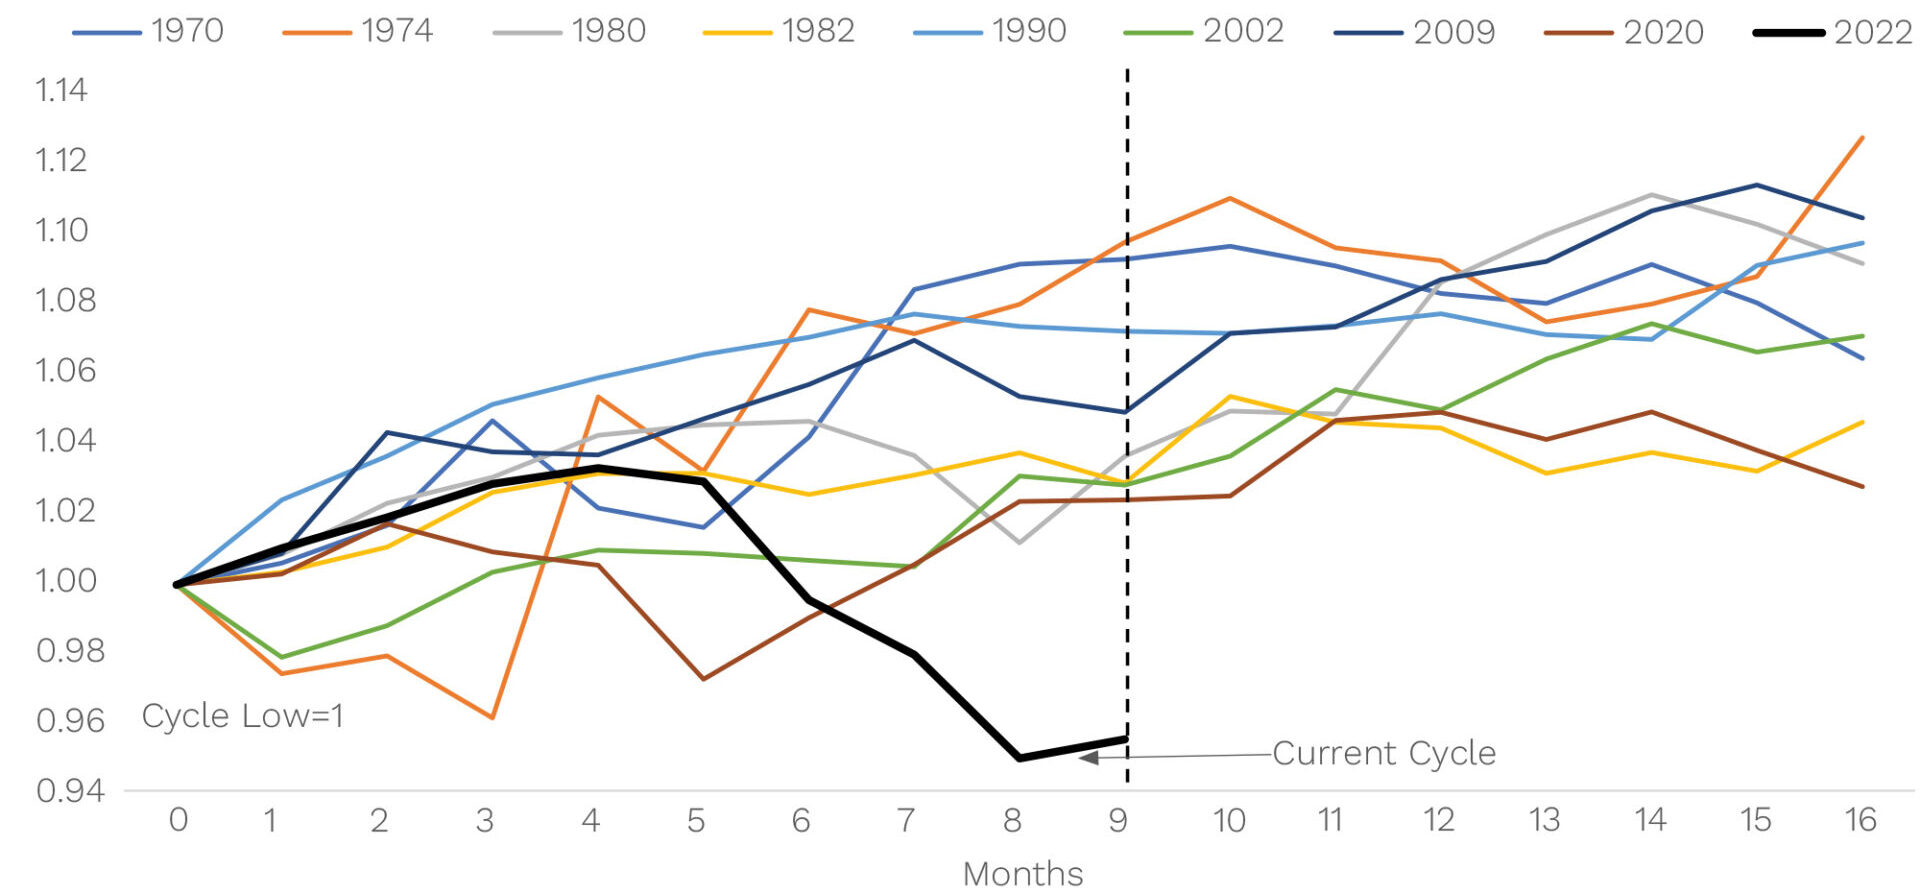
Source: Compustat, Morgan Stanley Research.
2. The ‘come join in’ bulls case for continued market motion
By contrast to the bears, while they have mostly been in the minority this year, the ranks of the ‘come join in’ bulls are growing. You can see this from the incremental change in tune from some of the Wall Street strategists, but also from things like:
- Investor sentiment surveys
- Fund flows data showing increased flows into equity funds
- Short squeezes during June on some of the most heavily shorted stocks
Mostly they see an ongoing “immaculate disinflation” occurring in consumer prices in the US, shortly followed by other advanced economies, as supply side issues (such as freight bottlenecks) quickly normalise. That would then allow key central banks, led by the Fed, to cut rates in 2024 and avoid a hard landing.
Unfortunately, there is not a formula like Newton’s F = M x A[i] to give investors the answer here. Economics is a social science and the outcome is reliant on hard to measure things like psychology and the ongoing actions and reactions of actors within the economy.
Fortunately, for patient investors, the answer on which side – bulls or bears — is right does not matter too much. It is the earnings of the companies in which we invest that will ultimately win the day.
No big macro bets
While “No big macro bets” remains our policy, that doesn’t mean we are inactive. With heightened recession probabilities across economies we invest into, we are avoiding those companies that need strong economic growth in order to grow. With higher-than-normal wages growth and increasing debt costs we are avoiding those companies where these costs are large in proportion to their revenues. Valuations in both global and Australian small caps are looking attractive and that has us excited about medium to longer term returns.
As always, we are working hard to find companies where the market is underestimating growth. History shows that, over the long, run that never goes out of favour. That is one investing law on which we can rely.
As always, thank you for entrusting your capital with us.
Kindest regards,
Andrew Mitchell & Steven Ng
Co-Founders & Senior Portfolio Managers
Ophir Asset Management
This document is issued by Ophir Asset Management Pty Ltd (ABN 88 156 146 717, AFSL 420 082) (Ophir) in relation to the Ophir Opportunities Fund, the Ophir High Conviction Fund and the Ophir Global Opportunities Fund (the Funds). Ophir is the trustee and investment manager for the Ophir Opportunities Fund. The Trust Company (RE Services) Limited ABN 45 003 278 831 AFSL 235150 (Perpetual) is the responsible entity of, and Ophir is the investment manager for, the Ophir Global Opportunities Fund and the Ophir High Conviction Fund. Ophir is authorised to provide financial services to wholesale clients only (as defined under s761G or s761GA of the Corporations Act 2001 (Cth)). This information is intended only for wholesale clients and must not be forwarded or otherwise made available to anyone who is not a wholesale client. Only investors who are wholesale clients may invest in the Ophir Opportunities Fund. The information provided in this document is general information only and does not constitute investment or other advice. The information is not intended to provide financial product advice to any person. No aspect of this information takes into account the objectives, financial situation or needs of any person. Before making an investment decision, you should read the offer document and (if appropriate) seek professional advice to determine whether the investment is suitable for you. The content of this document does not constitute an offer or solicitation to subscribe for units in the Funds. Ophir makes no representations or warranties, express or implied, as to the accuracy or completeness of the information it provides, or that it should be relied upon and to the maximum extent permitted by law, neither Ophir nor its directors, employees or agents accept any liability for any inaccurate, incomplete or omitted information of any kind or any losses caused by using this information. This information is current as at the date specified and is subject to change. An investment may achieve a lower than expected return and investors risk losing some or all of their principal investment. Ophir does not guarantee repayment of capital or any particular rate of return from the Funds. Past performance is no indication of future performance. Any investment decision in connection with the Funds should only be made based on the information contained in the relevant Information Memorandum or Product Disclosure Statement.
[i] Force equals Mass times Acceleration


