In this Letter to Investors, we explore:
- How long markets can continue to ignore U.S. tariff dramas, as they did in July
- Why employment and politics have significantly increased the odds of a Fed rate cut
- The promising signs that small caps are shifting from facing ‘headwinds’ to ‘tailwinds’ (helped by rate cuts)
- Why we’re untroubled by the Japanese market’s impact on our Global Opportunities Fund’s relative performance in July, and
- Some great news for the Ophir Funds in Morningstar’s latest performance rankings
- An uncovered gem – a US$6.6bn portfolio company exposed to the AI thematic with no analyst coverage.
Ophir Fund Performance – July 2025
Before we dive into the Letter, you’ll find a detailed monthly update on each of the Ophir Funds below.
The Ophir Opportunities Fund returned +3.0% net of fees in July, outperforming its benchmark which returned +2.8%, and has delivered investors +23.3% p.a. after fees since inception (August 2012).
The Ophir High Conviction Fund (ASX:OPH) investment portfolio returned 3.4% after fees in July, underperforming its benchmark which returned +3.6%, and has delivered investors +14.2% p.a. after fees since inception (August 2015). The ASX listing returned +2.6% for the month.
The Ophir Global Opportunities Fund (Class A) returned +2.4% net of fees in July, underperforming its benchmark which returned +2.8%, and has delivered investors +18.2% p.a. after fees since inception (October 2018).
The Ophir Global High Conviction Fund (Class A) returned +1.3% net of fees in July, underperforming its benchmark which returned +2.8%, and has delivered investors +14.0% p.a. after fees since inception (September 2020).
Mo’ Tariffs, Mo’ Problems?
Global trade policy uncertainty rose again in July, but this time, share markets didn’t react.
Markets rose in July, with the S&P 500, Russell 2000, ASX 200 and ASX Small Ordinaries up +2.3%, +1.7%, +2.4% and +2.8% respectively.
Tariff fatigue has clearly set in. The markets have moved on.
But the coming U.S. economic data is almost certain to have a ‘stagflationary’ whiff to it over the next few months, and the big question will be: will the market continue to look through tariffs?
With the U.S. and its trading partners striking tariff ‘deals’ in July, and the U.S. handing many more countries their new tariff rates on 1 August, it’s becoming increasingly clear the U.S.’s new effective tariff rate will settle somewhere around 15%. That’s a level we have to go back to the 1930s to see.
So far, the incoming data suggests that it’s U.S. importers that are ‘eating’ the lion’s share of the tariffs rather than passing them on.
On the other side of the ledger, the Trump Administration’s One Big Beautiful Bill (OBBB), which just passed Congress, has some big tax relief for business, including immediate expensing (100%) of capital expenditure and R&D.
What the U.S. government takes with one hand from domestic corporates, is given back to a degree. Some estimates suggest it’s giving more than it’s taking.
Although the sequencing will be important for the macro data. At a company level, there will definitely be the ‘haves’ (think those with primarily U.S. production and big capex budgets) and the ‘have nots’ (those with supply chains in highly tariffed countries that are capital light).
A U.S. rate cut in September becomes almost certain
The other big question is: how soon will the Fed begin cutting rates again? And what does that mean for the small cap market we play in?
The answer is that a Fed rate cut is now more likely for two reasons.
The first is a weak jobs market.
As many who follow markets would know, on 1 August, the U.S. received a bad jobs report, with job growth in July slower than expected.
More importantly, job growth in the prior two months was revised down by 258,000 jobs.
In a shock move, President Trump fired the economist heading the statistical agency responsible for the numbers. Is it a case of shooting the messenger, or a leader being fired for not providing accurate enough numbers? Economists would argue the prior month revisions are par for the course as more data comes through.
Whatever the answer, the U.S. jobs market is softer than once thought, and this has increased expectations for Fed cuts. Before the jobs report, the prospect of a September Fed rate cut was about 50/50. It now looks like a near certainty.
The market is now predicting 2.5 rate cuts (of 0.25% size) before year end. Given the Fed meets three more times before year end, that is almost a cut at each meeting.
This would be a welcome relief for borrowers because the Fed has been on hold since December last year, when it paused the current rate cutting cycle.
Bad Jobs Report Increases Expected Rate Cuts:
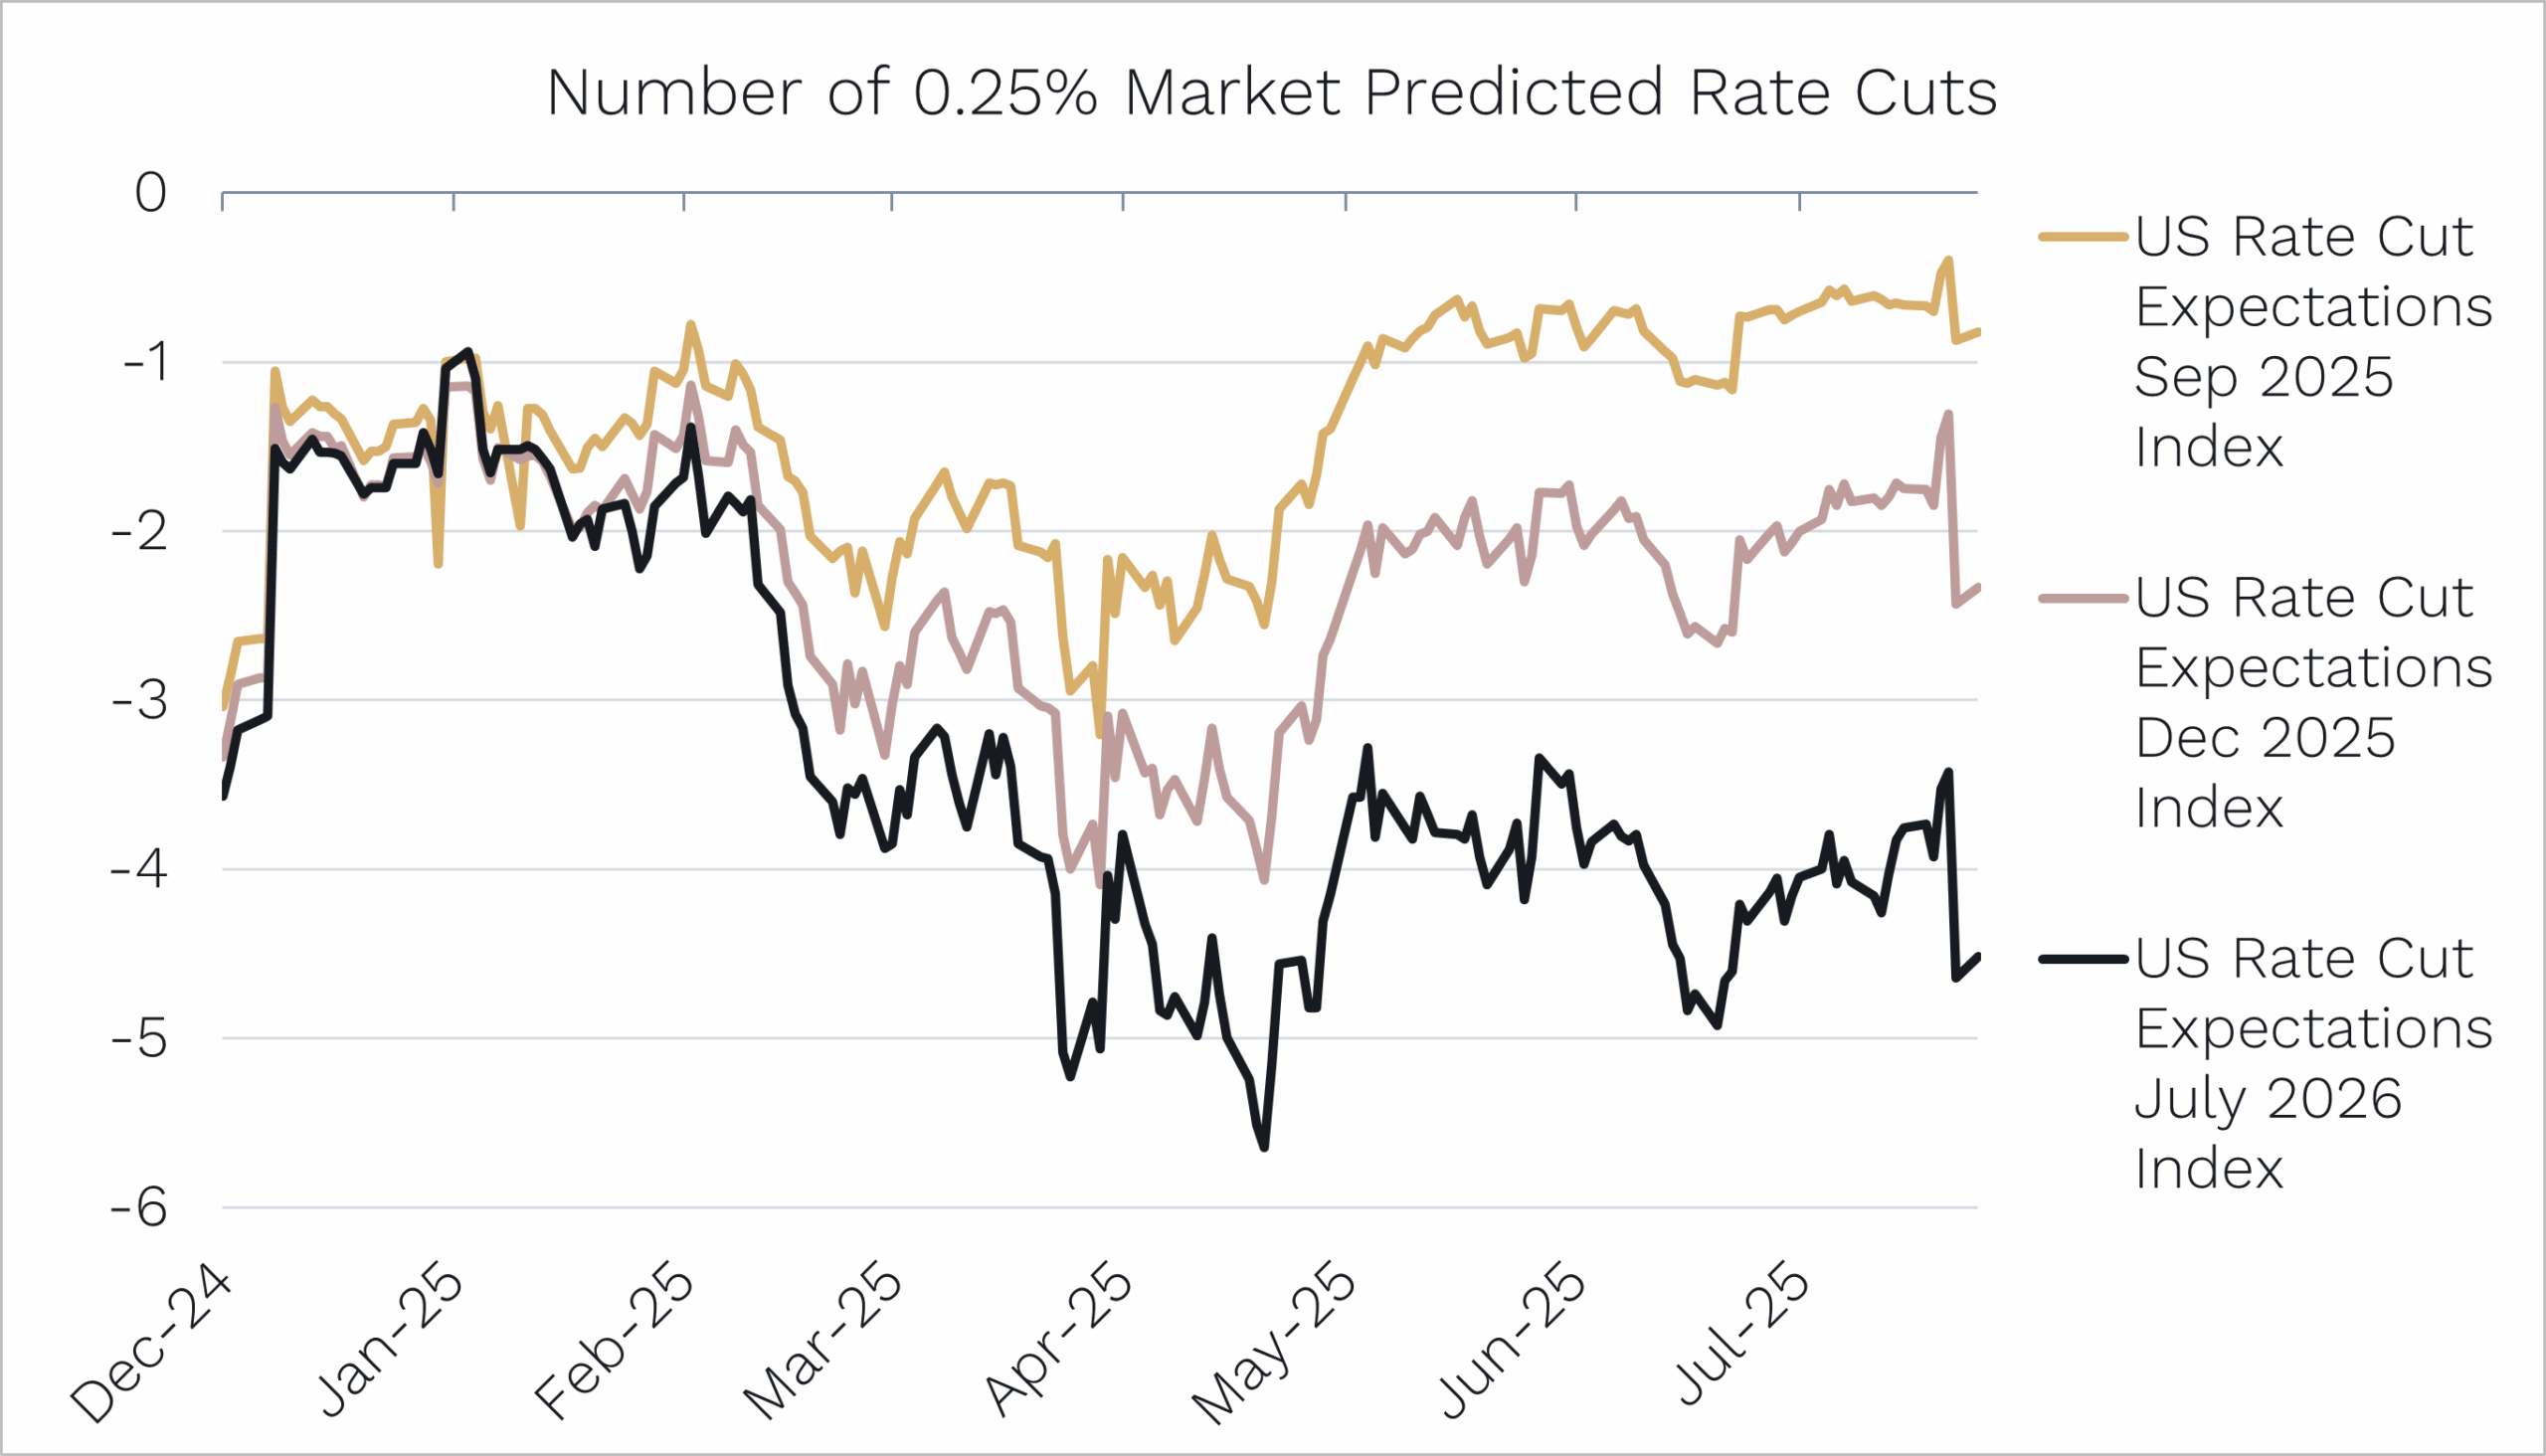
Source: Bloomberg. Data as of 6th August 2025
“Stubborn moron,” “very stupid person,” “total loser,” “too political,” “low IQ,” and should be “put out to pasture”
The second reason rate cuts are likely more imminent is politics.
The words above are just a few that President Trump has used to describe the Fed Chair Jerome Powell this year for not cutting rates.
It is not only the jobs market that has been putting pressure on the Fed to cut!
With the recent resignation of a voting Fed Governor, Trump now has an early opportunity to appoint a replacement likely to support additional rate cuts within the Fed.
This new appointment to the Federal Open Market Committee (FOMC) will also likely be first in line as Trump’s pick to replace Powell when he is scheduled to step down in May next year (unless Trump removes him for cause before then!).

The point is that politics, and now the macro data, both suggest a resumption of the Fed’s rate cutting cycle is imminent.
Small caps shifting from ‘headwinds’ to ‘tailwinds’
As we’ve been saying for some time now, we think this, looming rate cuts, is THE precondition for small caps to start outperforming.
We have started to see some of this outperformance, and more breadth, more recently. The market’s recovery from its post Liberation Day lows in mid-April is no longer simply dominated by the biggest companies.
Bad Breadth – a fresh mint for small caps:
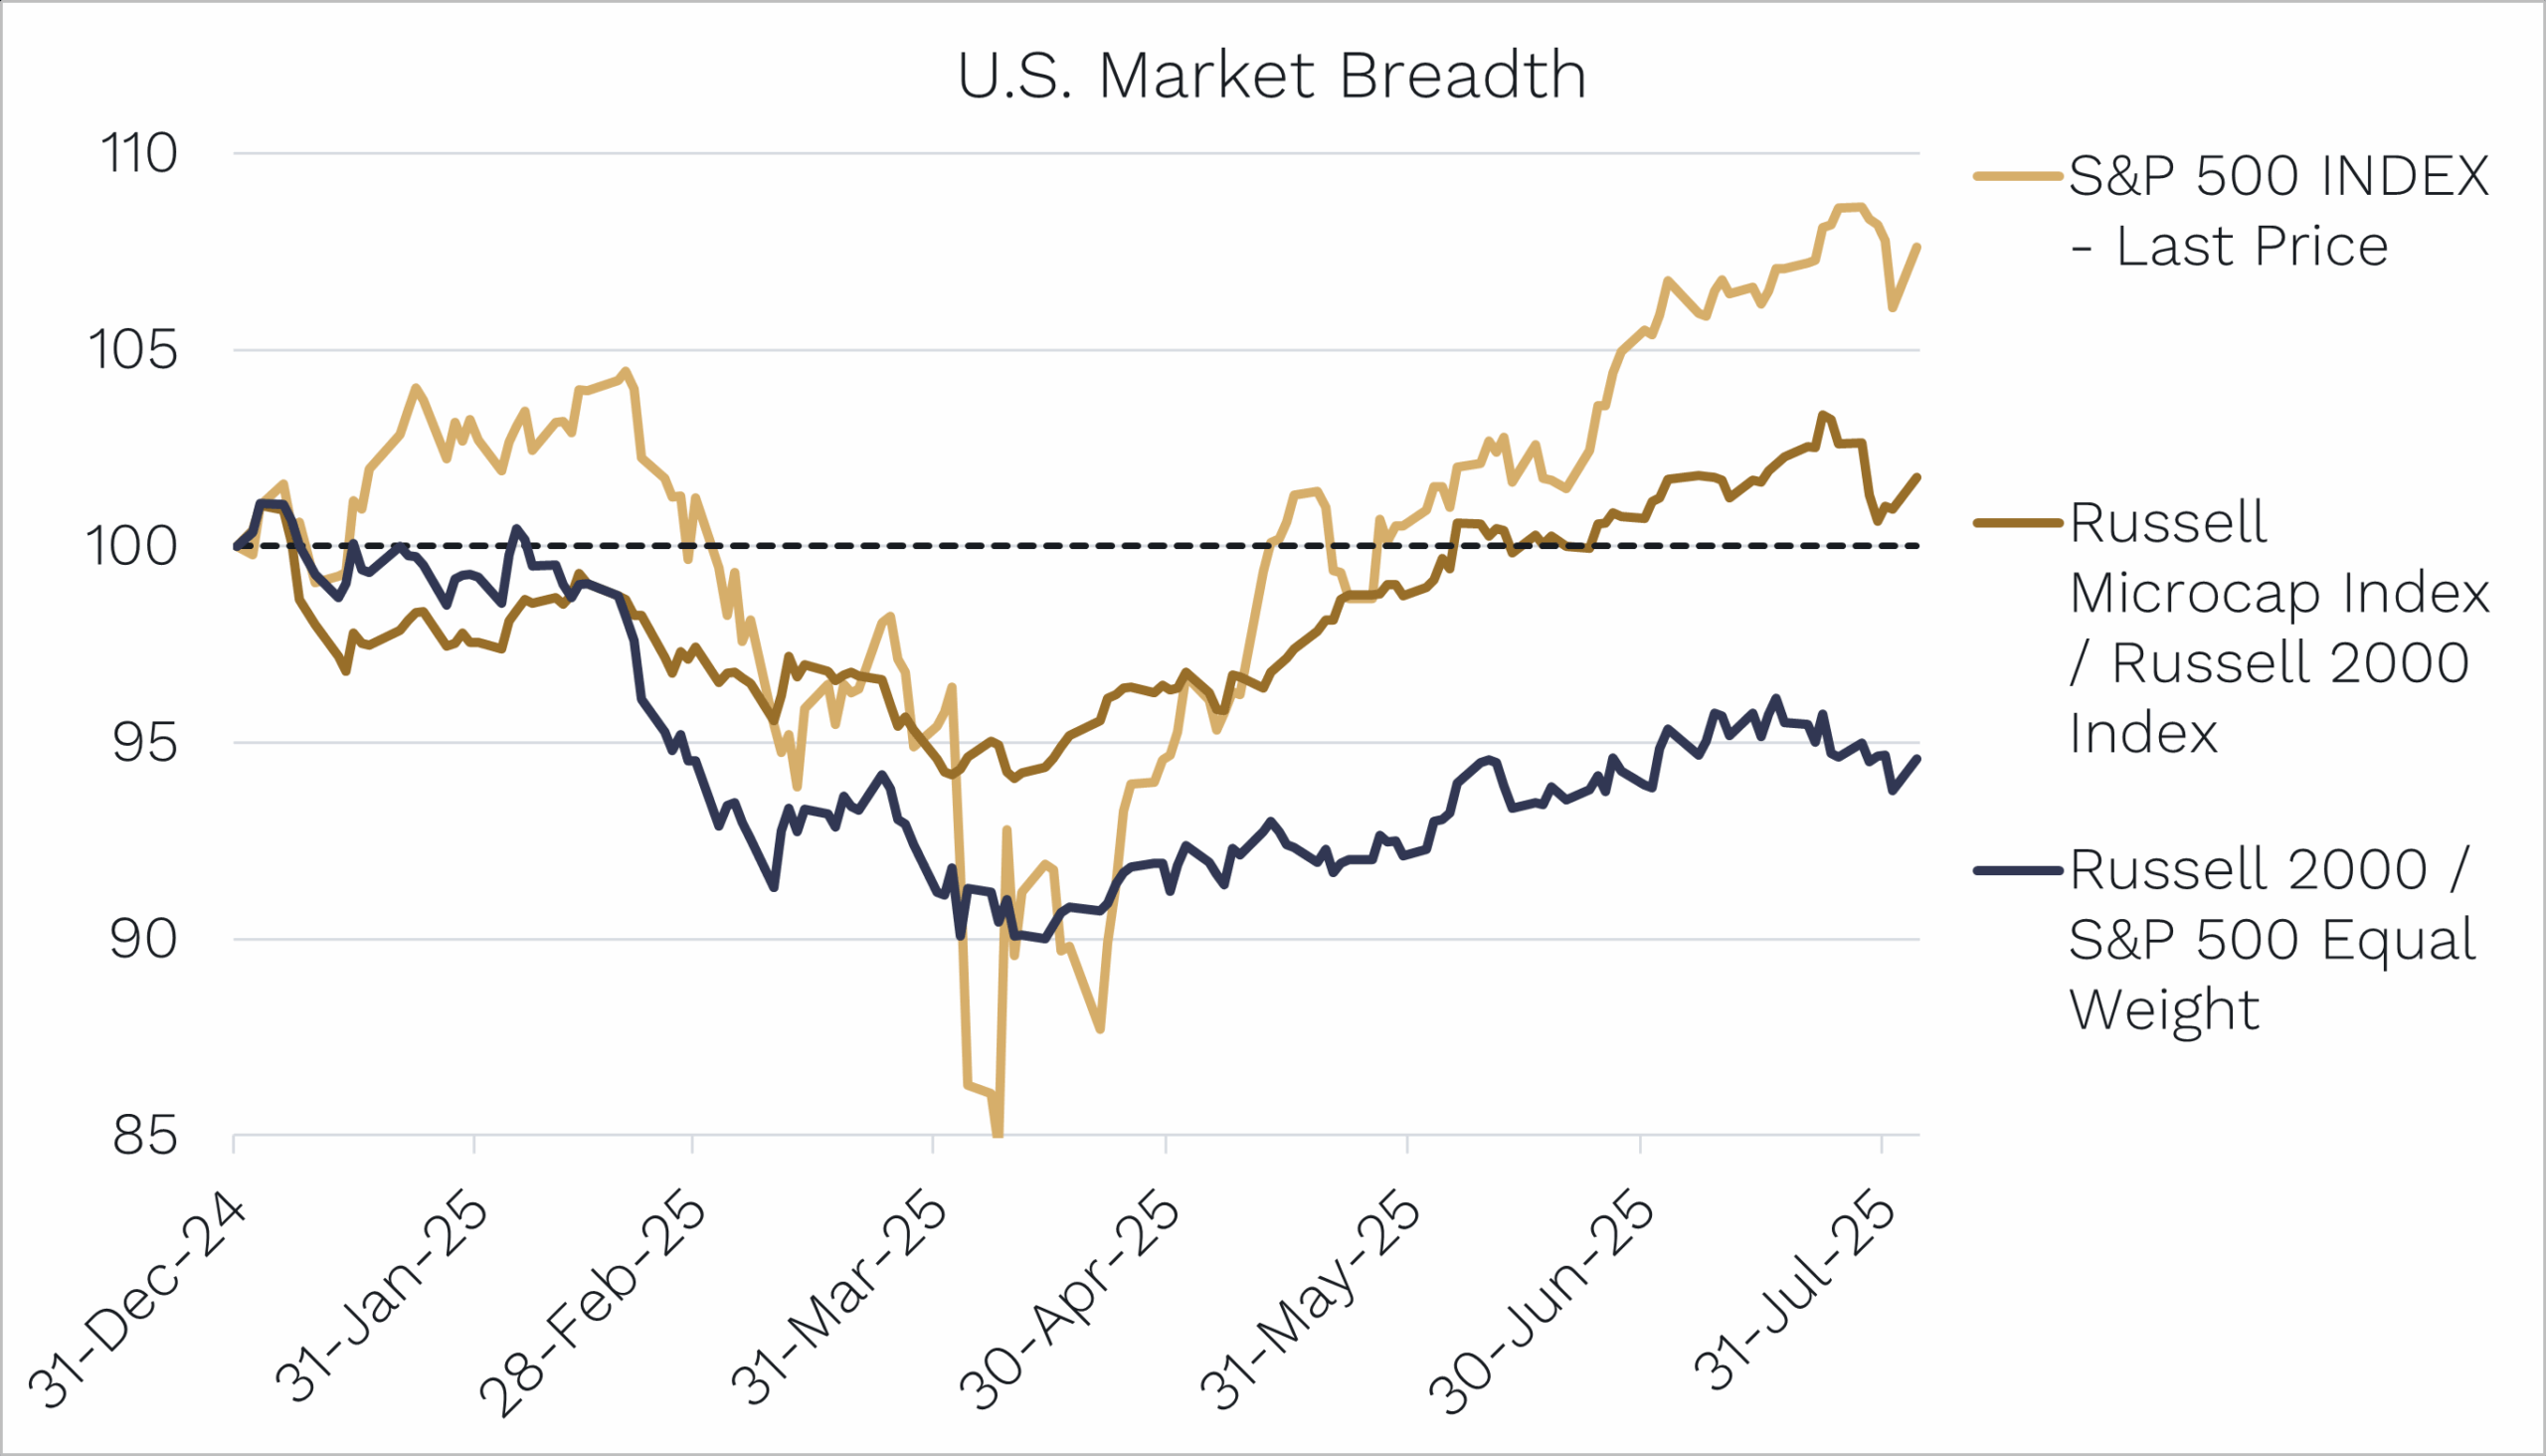
Source: Bloomberg, Ophir. Data as of 4 August 2025.
As you can see above, the S&P 500 (orange line) rebounded from April to July. This has coincided with micro caps outperforming small caps (brown line), and small caps outperforming an equally weighted basket of large caps (black line).
This type of market breadth, with micro and small caps outperforming, has been very rare over the last few years.
As the market anticipates a resumption of rate cuts, we watch closely to see whether this marks the beginning of sustained small cap outperformance.
It should be, because rate cuts benefit small caps for two main reasons:
- They have more floating rate debt and are more economically sensitive, so they benefit more as rates fall; and
- Lower rates encourage more risk-taking by investors, often spurring them to invest further down the market capitalisation spectrum.
We don’t speak Japanese
So how did our Funds perform in July?
In our recently reopened, and No. 1-ranked since inception, Global Opportunities Fund, performance was strong in an absolute sense, up +2.4%.
The Fund did lag the benchmark by -0.4% during the month. It was, however, due some slight underperformance given its +41.8% return for the year to 30 June, well ahead of the benchmark’s +18.7% return.
Global Opportunities Fund Factors in July:
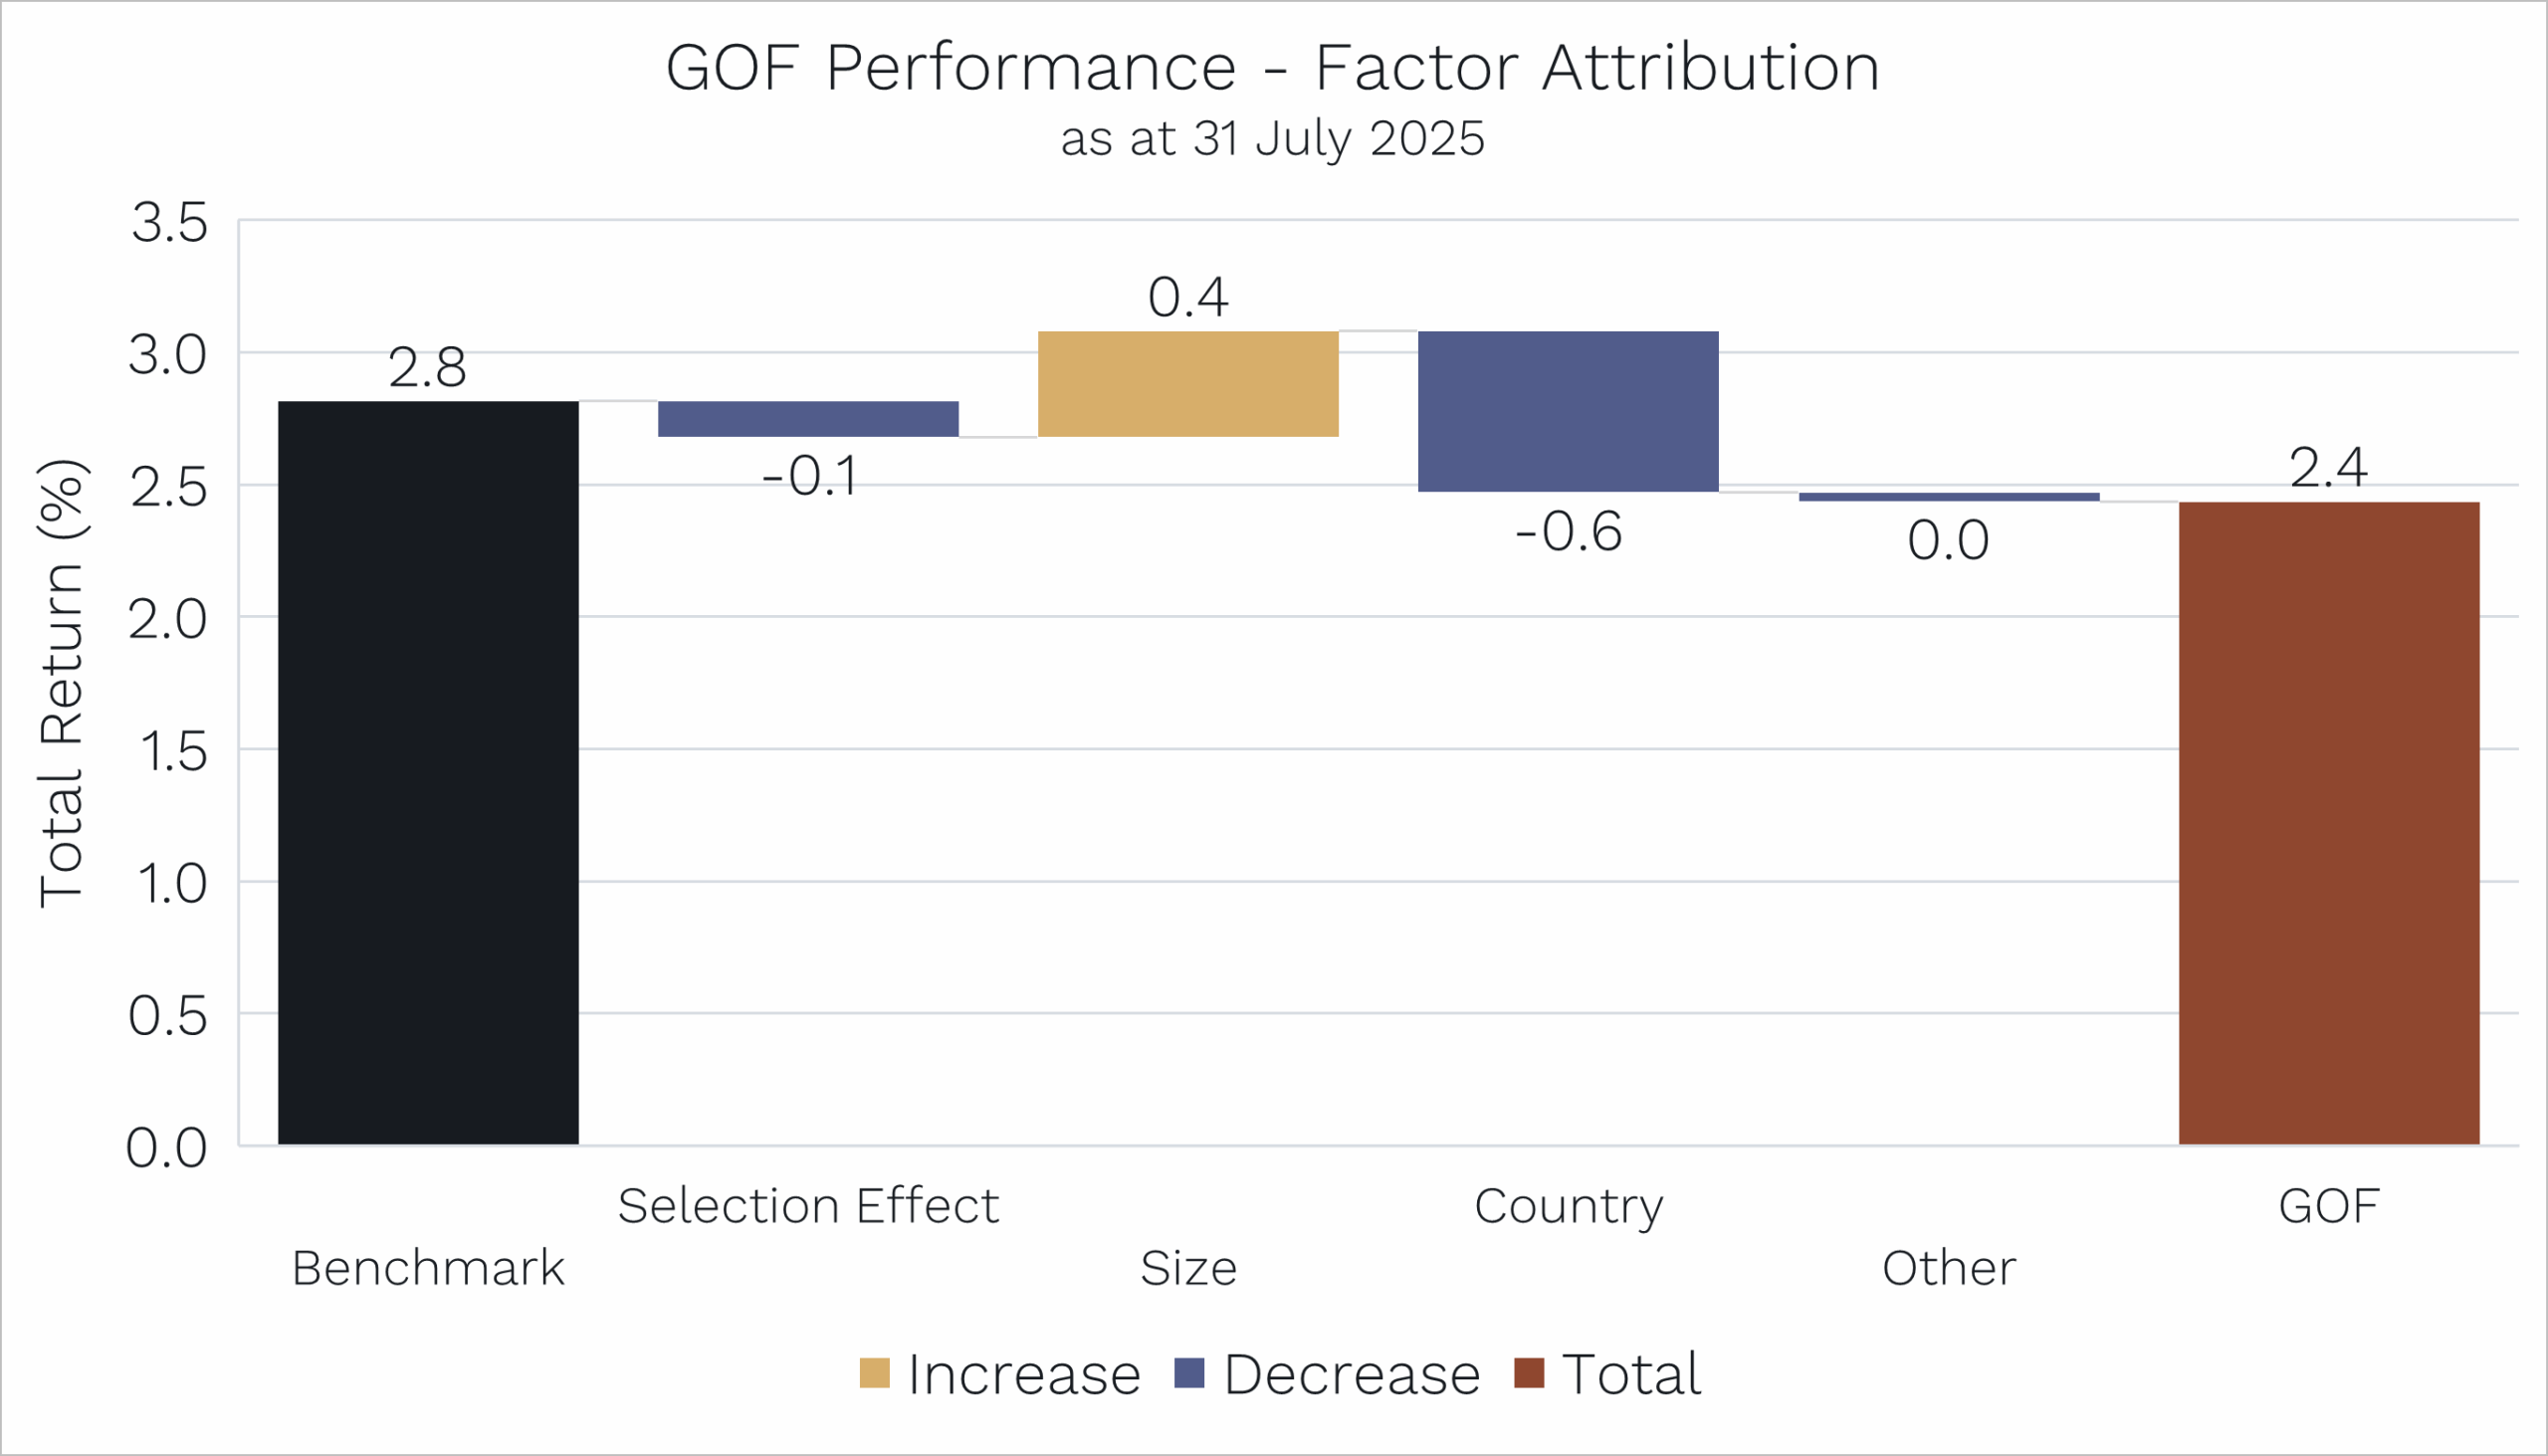
Source: Bloomberg. Data as of 31 July 2025. Benchmark: MSCI World SMID Index
When we look at the performance attribution for July, as you can see in the chart above, three things stood out to us:
-
Stock picking (Selection Effect) added little. Virtually all our companies don’t report Q2 earnings until August, so there was little stock-specific news on our companies to get the market excited. Stay tuned for next month’s result, though. (HINT: so far so good in the month-to-date.)
-
Size was actually a slight tailwind. Remember our average company size is in the AUD$4-5 billion range. That’s a little bit smaller than the average company in the MSCI World SMID Cap benchmark. And small caps outperformed mid-caps during the month. Micro-caps (the smallest size cohort) outperformed both! This is a really interesting development because over the last four years, the smaller the size of a company, the worse its share price performance has tended to be globally. As we explored above, there are good signs this is switching to a tailwind.
-
Country was a -0.6% detractor to our relative performance compared to the benchmark. Why? The Japanese share market was the major standout performing country or region in our benchmark in July, and we don’t invest there. Why not? We don’t speak Japanese. In all the other major countries we invest into – the United States, Canada, United Kingdom, Germany, Netherlands, Switzerland and Sweden – we can go into those meetings with company management and speak English, be understood and understand them just fine. Our benchmark has about 4,500 companies, and Japan represents just around 10% of our benchmark. We don’t need to invest everywhere, just where our process works best. And not speaking the language in Japan, unfortunately, at this time, makes it very tough to gain the insights we need to invest.
Morningstar Magic
Finally, we wanted to leave you with some recent good news on the performance rankings of our ‘Aussie’ Ophir Opportunities Fund and our Global Opportunities Fund.
Opportunities Fund’s Rankings:
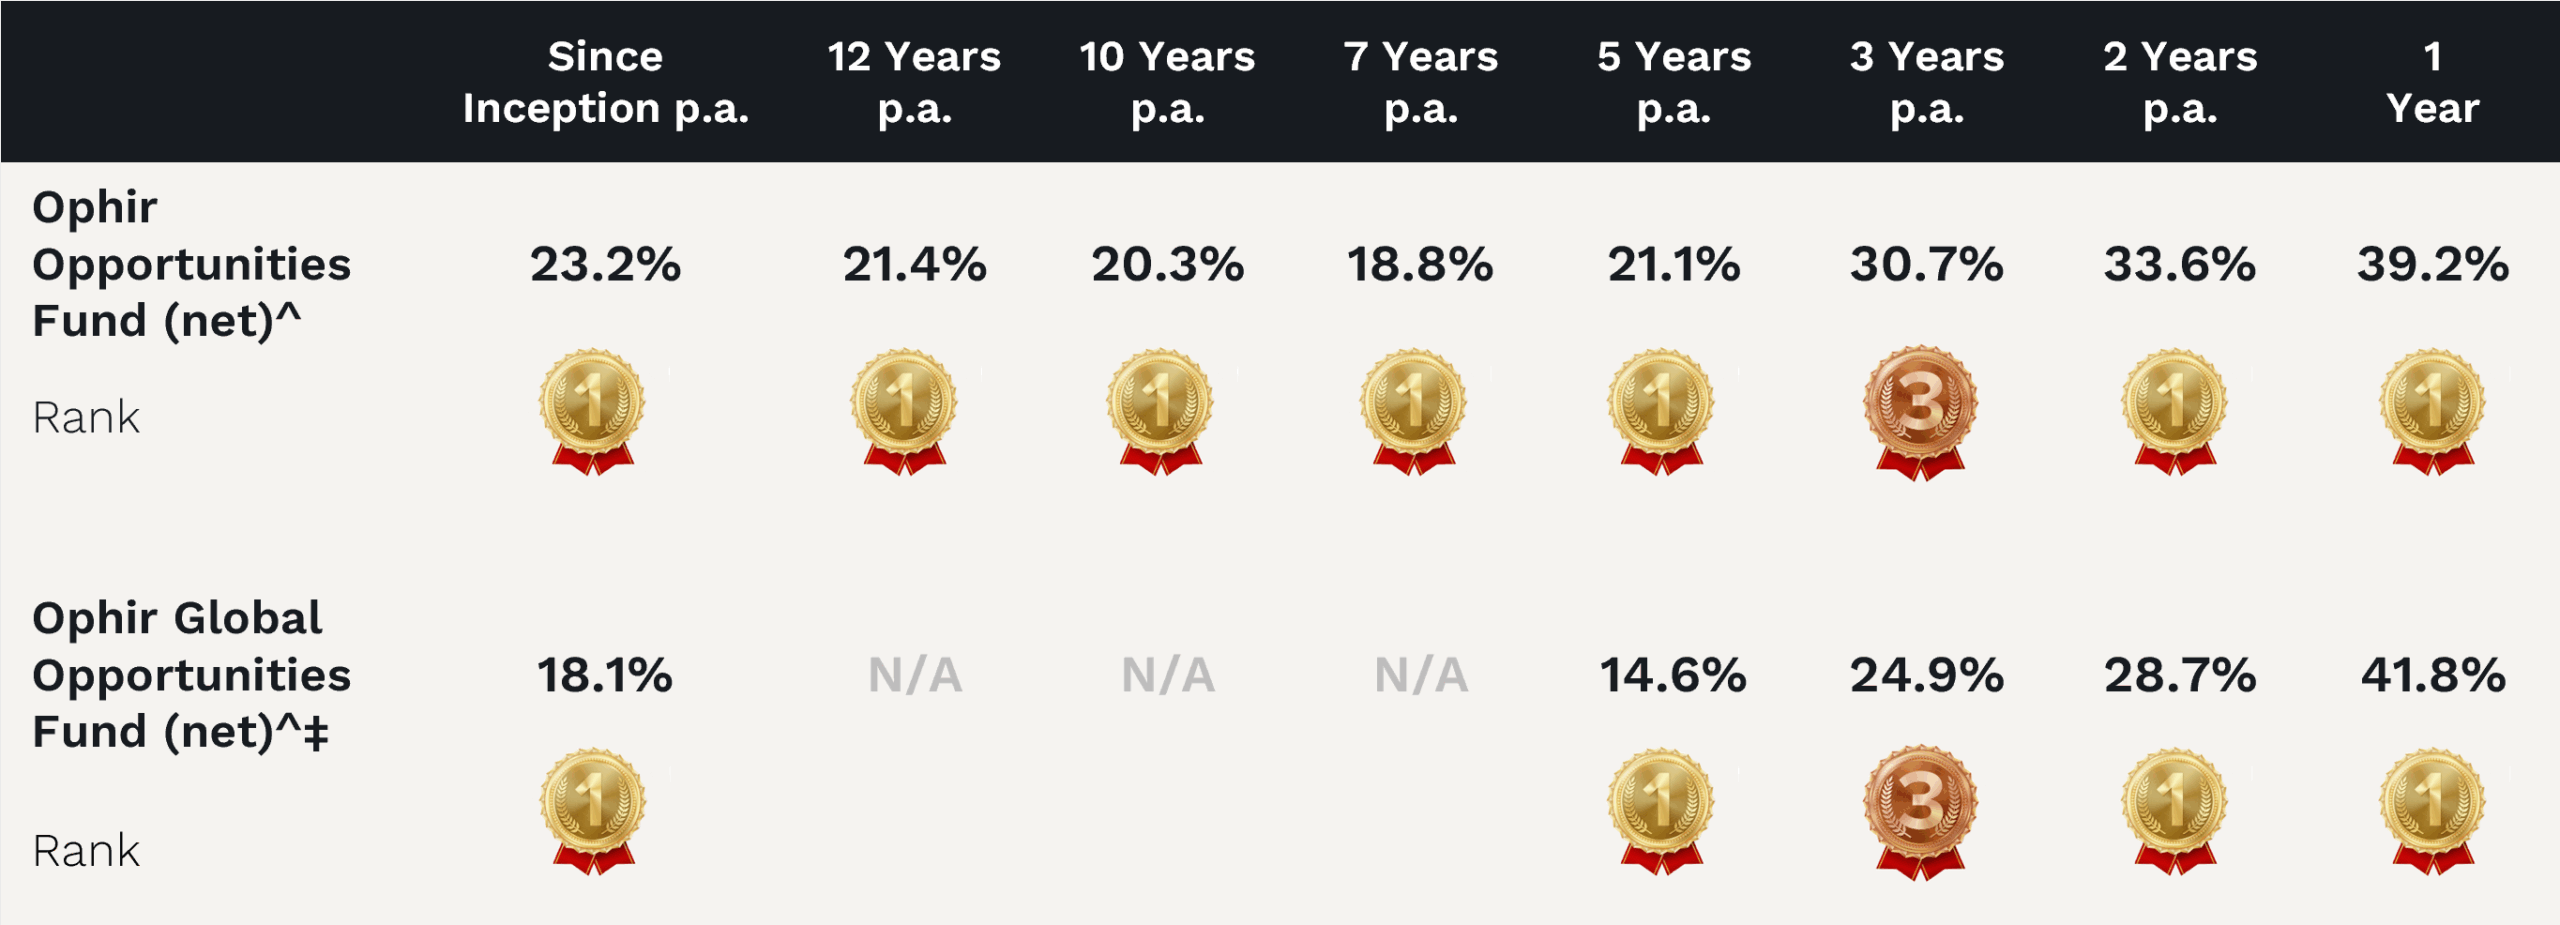
The data is in for competitors in the key Morningstar database to 30 June 2025, and as you can see above, we have some great results to share:
- Our original Ophir Opportunities Fund, which started in 2012 and has returned +23.2% per annum net of fees, is now ranked No. 1 for performance in Australian small/mid caps on a 1, 2, 3, 7, 10, 12 and since inception basis.
- While that Fund hard closed at capacity in 2015, our Global Opportunities Fund, which is open and run under the same investment process and shares many of the same team members that worked on that original Fund, is ranked No. 1 on a 1, 2, 3 and since inception in 2018 basis in Global small/mid caps (funds with >$50 million in funds under management)
The open-for-investment Global Opportunities Fund appears to be tracing the same path as our closed-at-capacity Ophir Opportunities Fund.
It’s been hard work and a big team effort, but we wouldn’t have the pleasure of doing what we love every day without the support of our fellow investors. So we sincerely thank you.
We also remain acutely aware that these are just numbers on a page for new investors in our Funds. Our job is to keep it up, so they can have a good experience too, and that’s something we are passionately committed to.
Stock in Focus: IES Holdings Inc.
An Uncovered Gem
At Ophir, we typically don’t find our best investments by running traditional stock screens. Instead, we uncover opportunities by diving deeply into adjacent industries and meeting with people on the ground.
We don’t want to risk missing hidden gems that might otherwise get screened out.
This month’s stock in focus is the perfect example.
If we had relied on a screen, we would never have found IES Holdings (NASDAQ: IESC), a US$6.6 billion company with no analyst coverage.
It truly is an uncovered gem.
Leaving no stone unturned
Two years ago, while most attention was focused on the most obvious beneficiaries of the AI boom, we took a different approach. We were scouring the industrial landscape for companies quietly building the backbone of tomorrow’s digital economy.
Our search began with a simple observation: investor demand was developing across industrials tied to the AI infrastructure build-out.
We started our search in the San Francisco Bay Area, the traditional hub for IT industrial services.
However, we quickly expanded our search across the U.S. This took us to both sides of the coast and off the beaten path to locations like Oklahoma and Wisconsin.
To ensure we left no stone unturned, we ventured to the small city of Guelph in Canada before flying across the Atlantic to Sweden and Switzerland.
But when we turned our attention back to the U.S., in Houston, Texas, it was IES Holdings that really stood out amongst all others.
Plugged into Growth
IES is a founder-led (with over 50% insider ownership) diversified electrical and technology systems company serving critical infrastructure markets across North America. Its four business segments span both secular growth drivers and cyclical recovery opportunities:
- Communications (27% of revenue; 14% EBIT margin)
Focused on data centers, distribution facilities and high-tech manufacturing, this segment benefits from multi-year demand visibility in data infrastructure and logistics. - Residential (48% of revenue; 8% EBIT margin)
Provides electrical, heating, ventilation and air conditioning (HVAC), plumbing, cable TV and solar services for the housing market. - Infrastructure Solutions (12% of revenue; 23% EBIT margin)
Manufactures custom generator enclosures (especially for data centers) and provides motor maintenance and repair services. Expansion of the manufacturing footprint and potential M&A will underpin growth in this division. - Commercial & Industrial (13% of revenue; 11% EBIT margin)
Offers electrical and HVAC design, construction and maintenance, competing selectively where regional scale gives them a competitive edge.
Powerful tailwinds
Like its larger peers, including Quanta and Comfort Systems, IES Holdings is benefiting from powerful tailwinds such as:
- Tech Infrastructure: The AI, cloud and e-commerce build-out represents a US$500 billion capex market, expected to reach US$1 trillion over the next 4 to 5 years. This implies annual growth in the mid to high teens and underpins strong visibility and sustained growth for the Communications and Infrastructure Solutions segments.
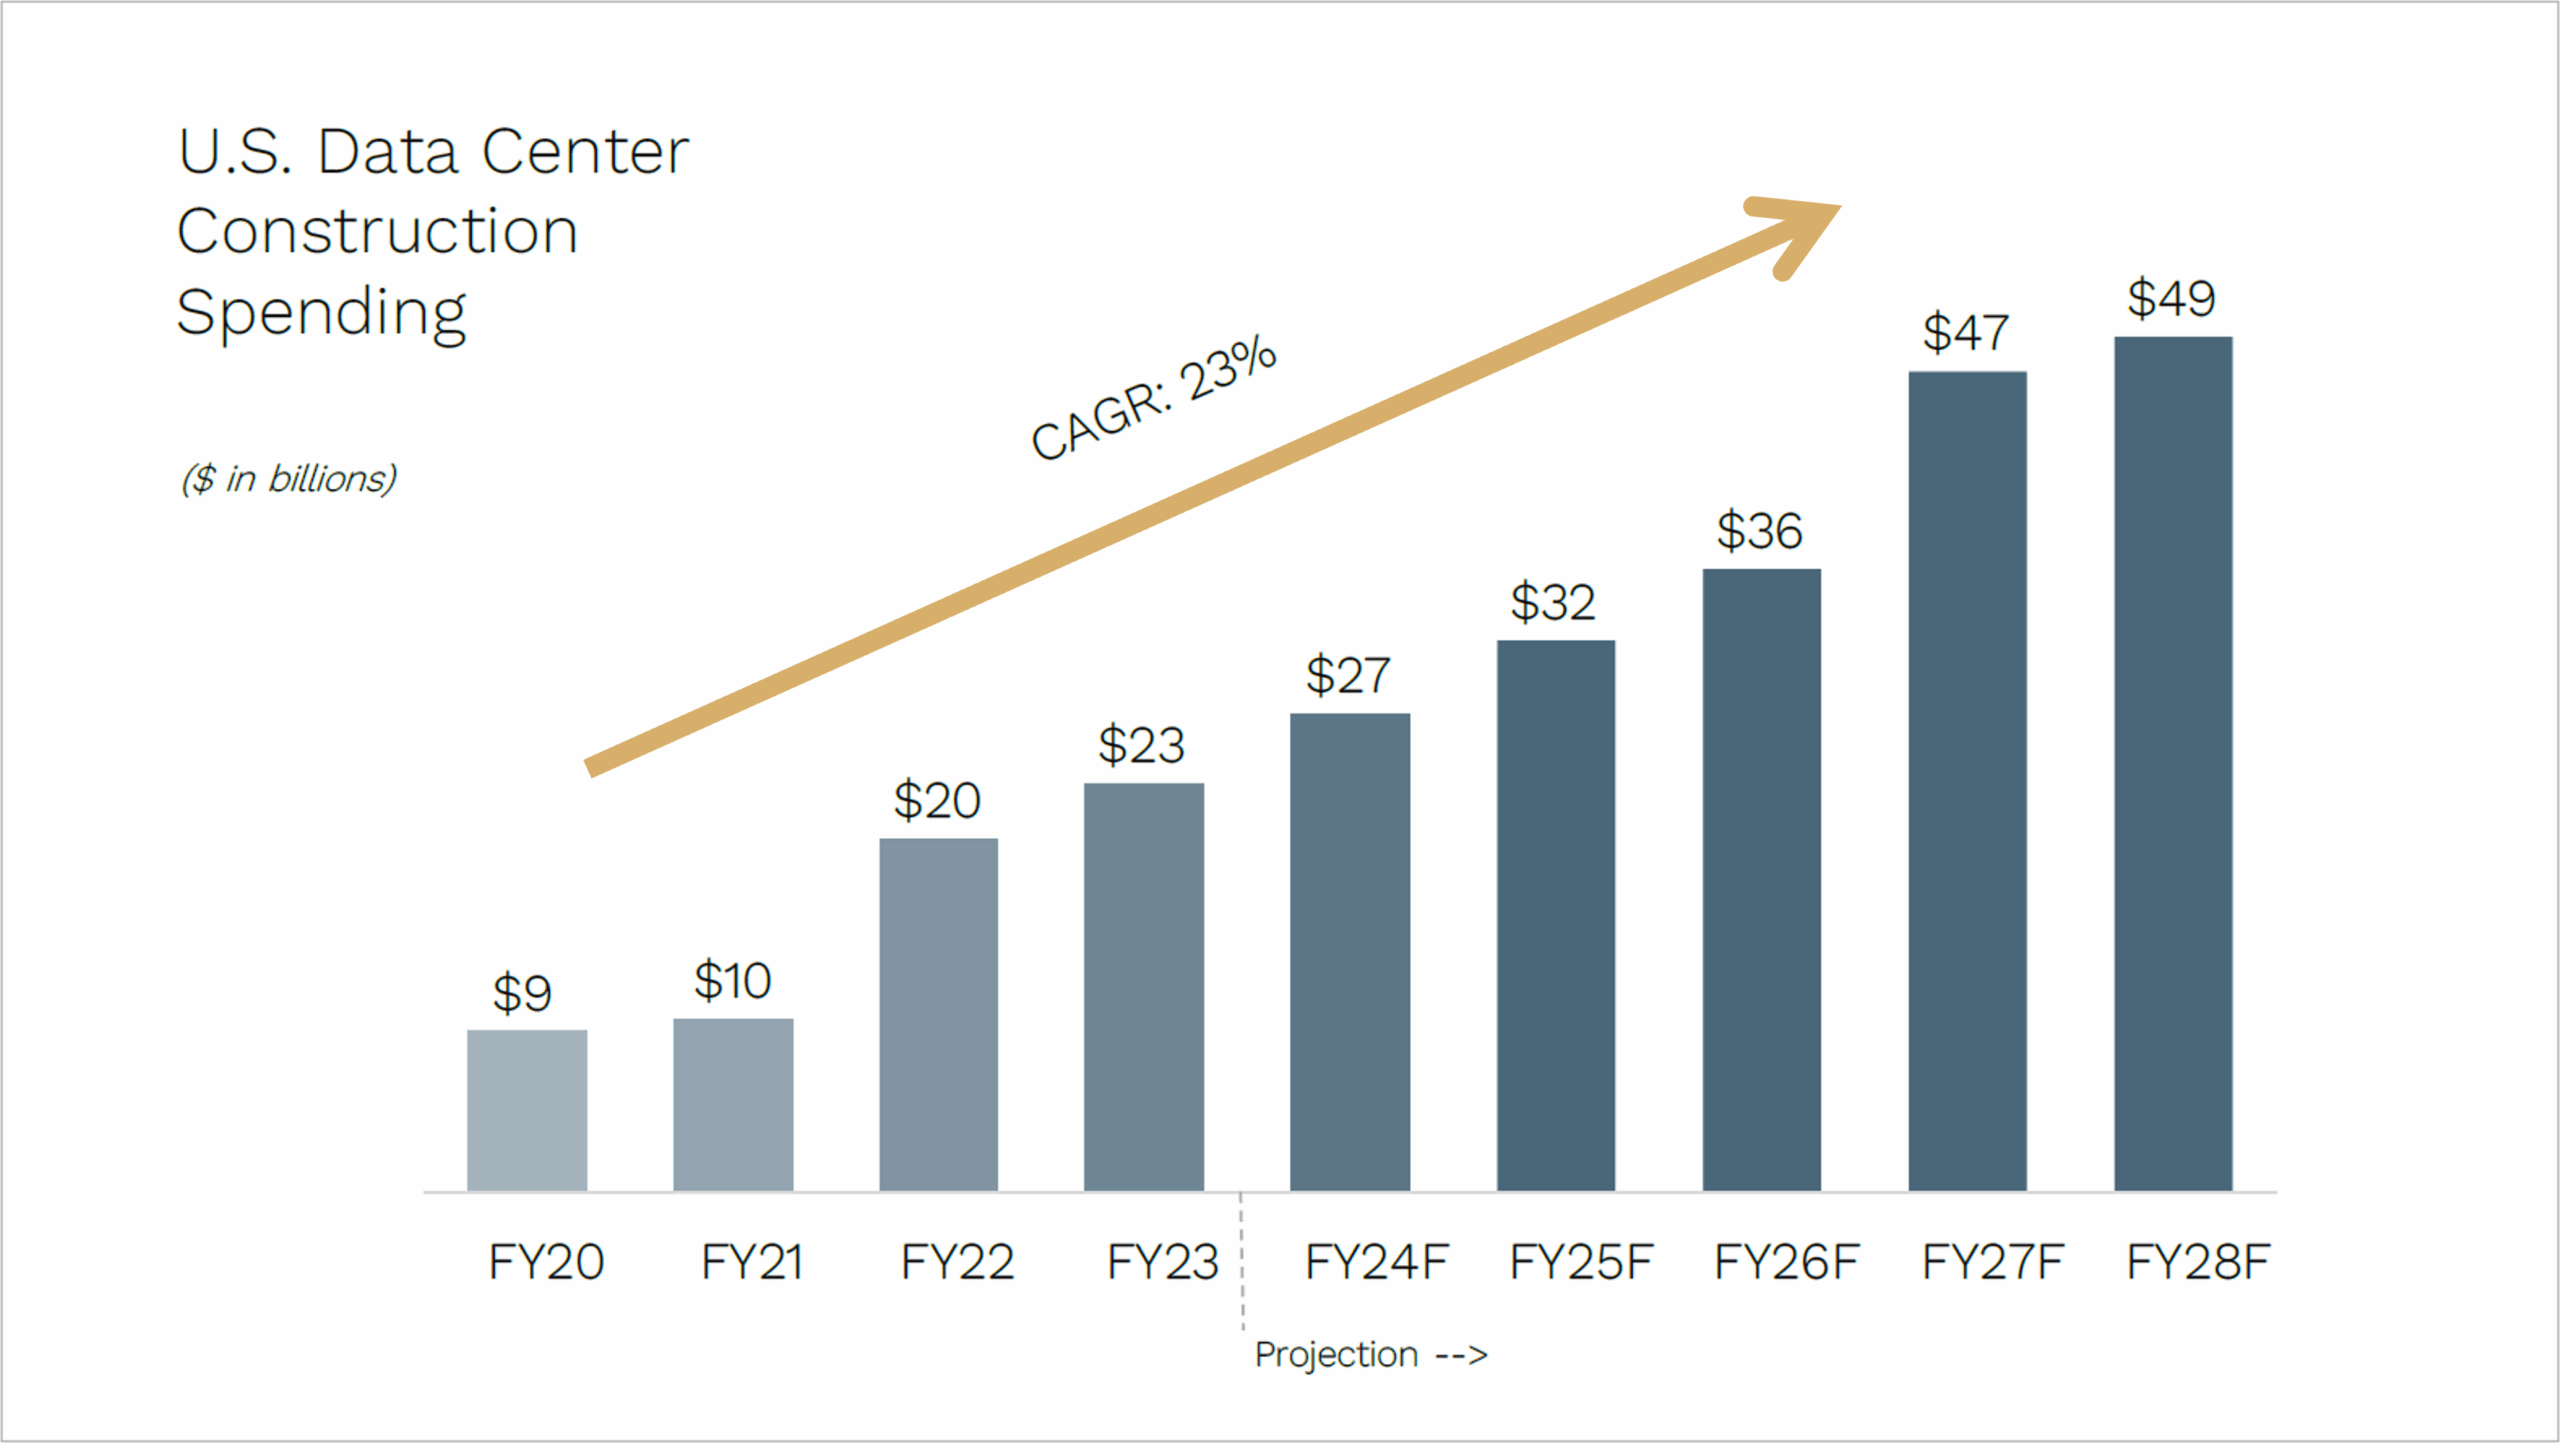
Source: IES Holdings Inc. Investor Presentation. 2025. FMI; limited to private Data Center construction.
- Housing Recovery: The U.S. residential market remains structurally undersupplied. IES is expanding into plumbing and HVAC cross-sell opportunities, adding further optionality. Residential appears near a trough, with signs of stabilisation emerging in key Sunbelt markets.
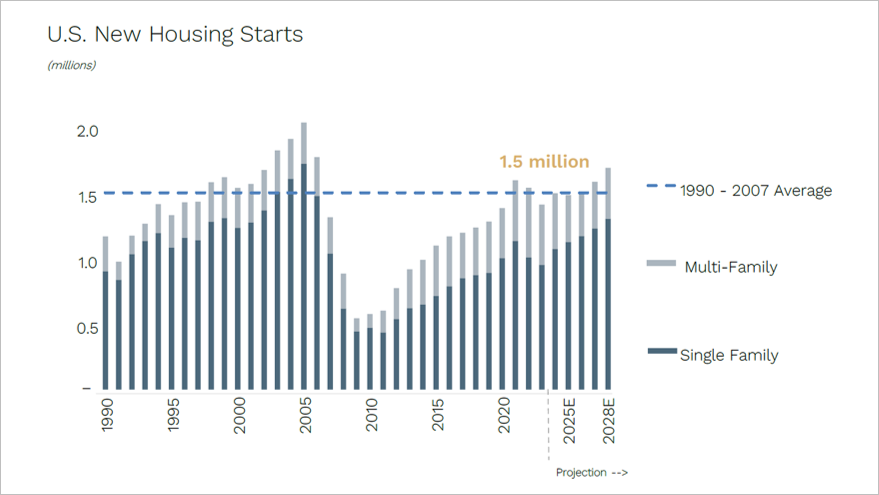
Source: IES Holdings Inc. Investor Presentation. 2025. U.S. Census Bureau, National Association of Home Builders (NAHM); Apollo US Housing Outlook.
We spent extensive time speaking with large contractors, installation peers, and equipment manufacturers across adjacent areas such as switchgear, transformers, cooling systems and power generation.
This on-the-ground perspective gave us confidence in IES’s competitive positioning and ability to capture market share.
Under the radar
We made our initial investment in March 2024 when IES had a share price of around US$120 and was trading on 15x earnings. That represented a 40 to 50% discount to its peer group.
The company also had a strong balance sheet with a net cash position, which would allow it to make acquisitions or repurchase shares.
And with zero analyst coverage, it was truly flying under the radar.
The appeal of IES was simple: it was a cheap and undiscovered exposure to high-growth structural themes.
Supercharged for Success
The stock has nearly tripled since our initial investment. However, A lot of this has been earnings driven, so we believe significant upside remains.
IES Holdings now trades on approximately 20x earnings, while larger covered peers are trading between 25x and 36x earnings. That implies 40 to 50% multiple upside if coverage and recognition catch up, which will stack nicely with double digit earnings growth.
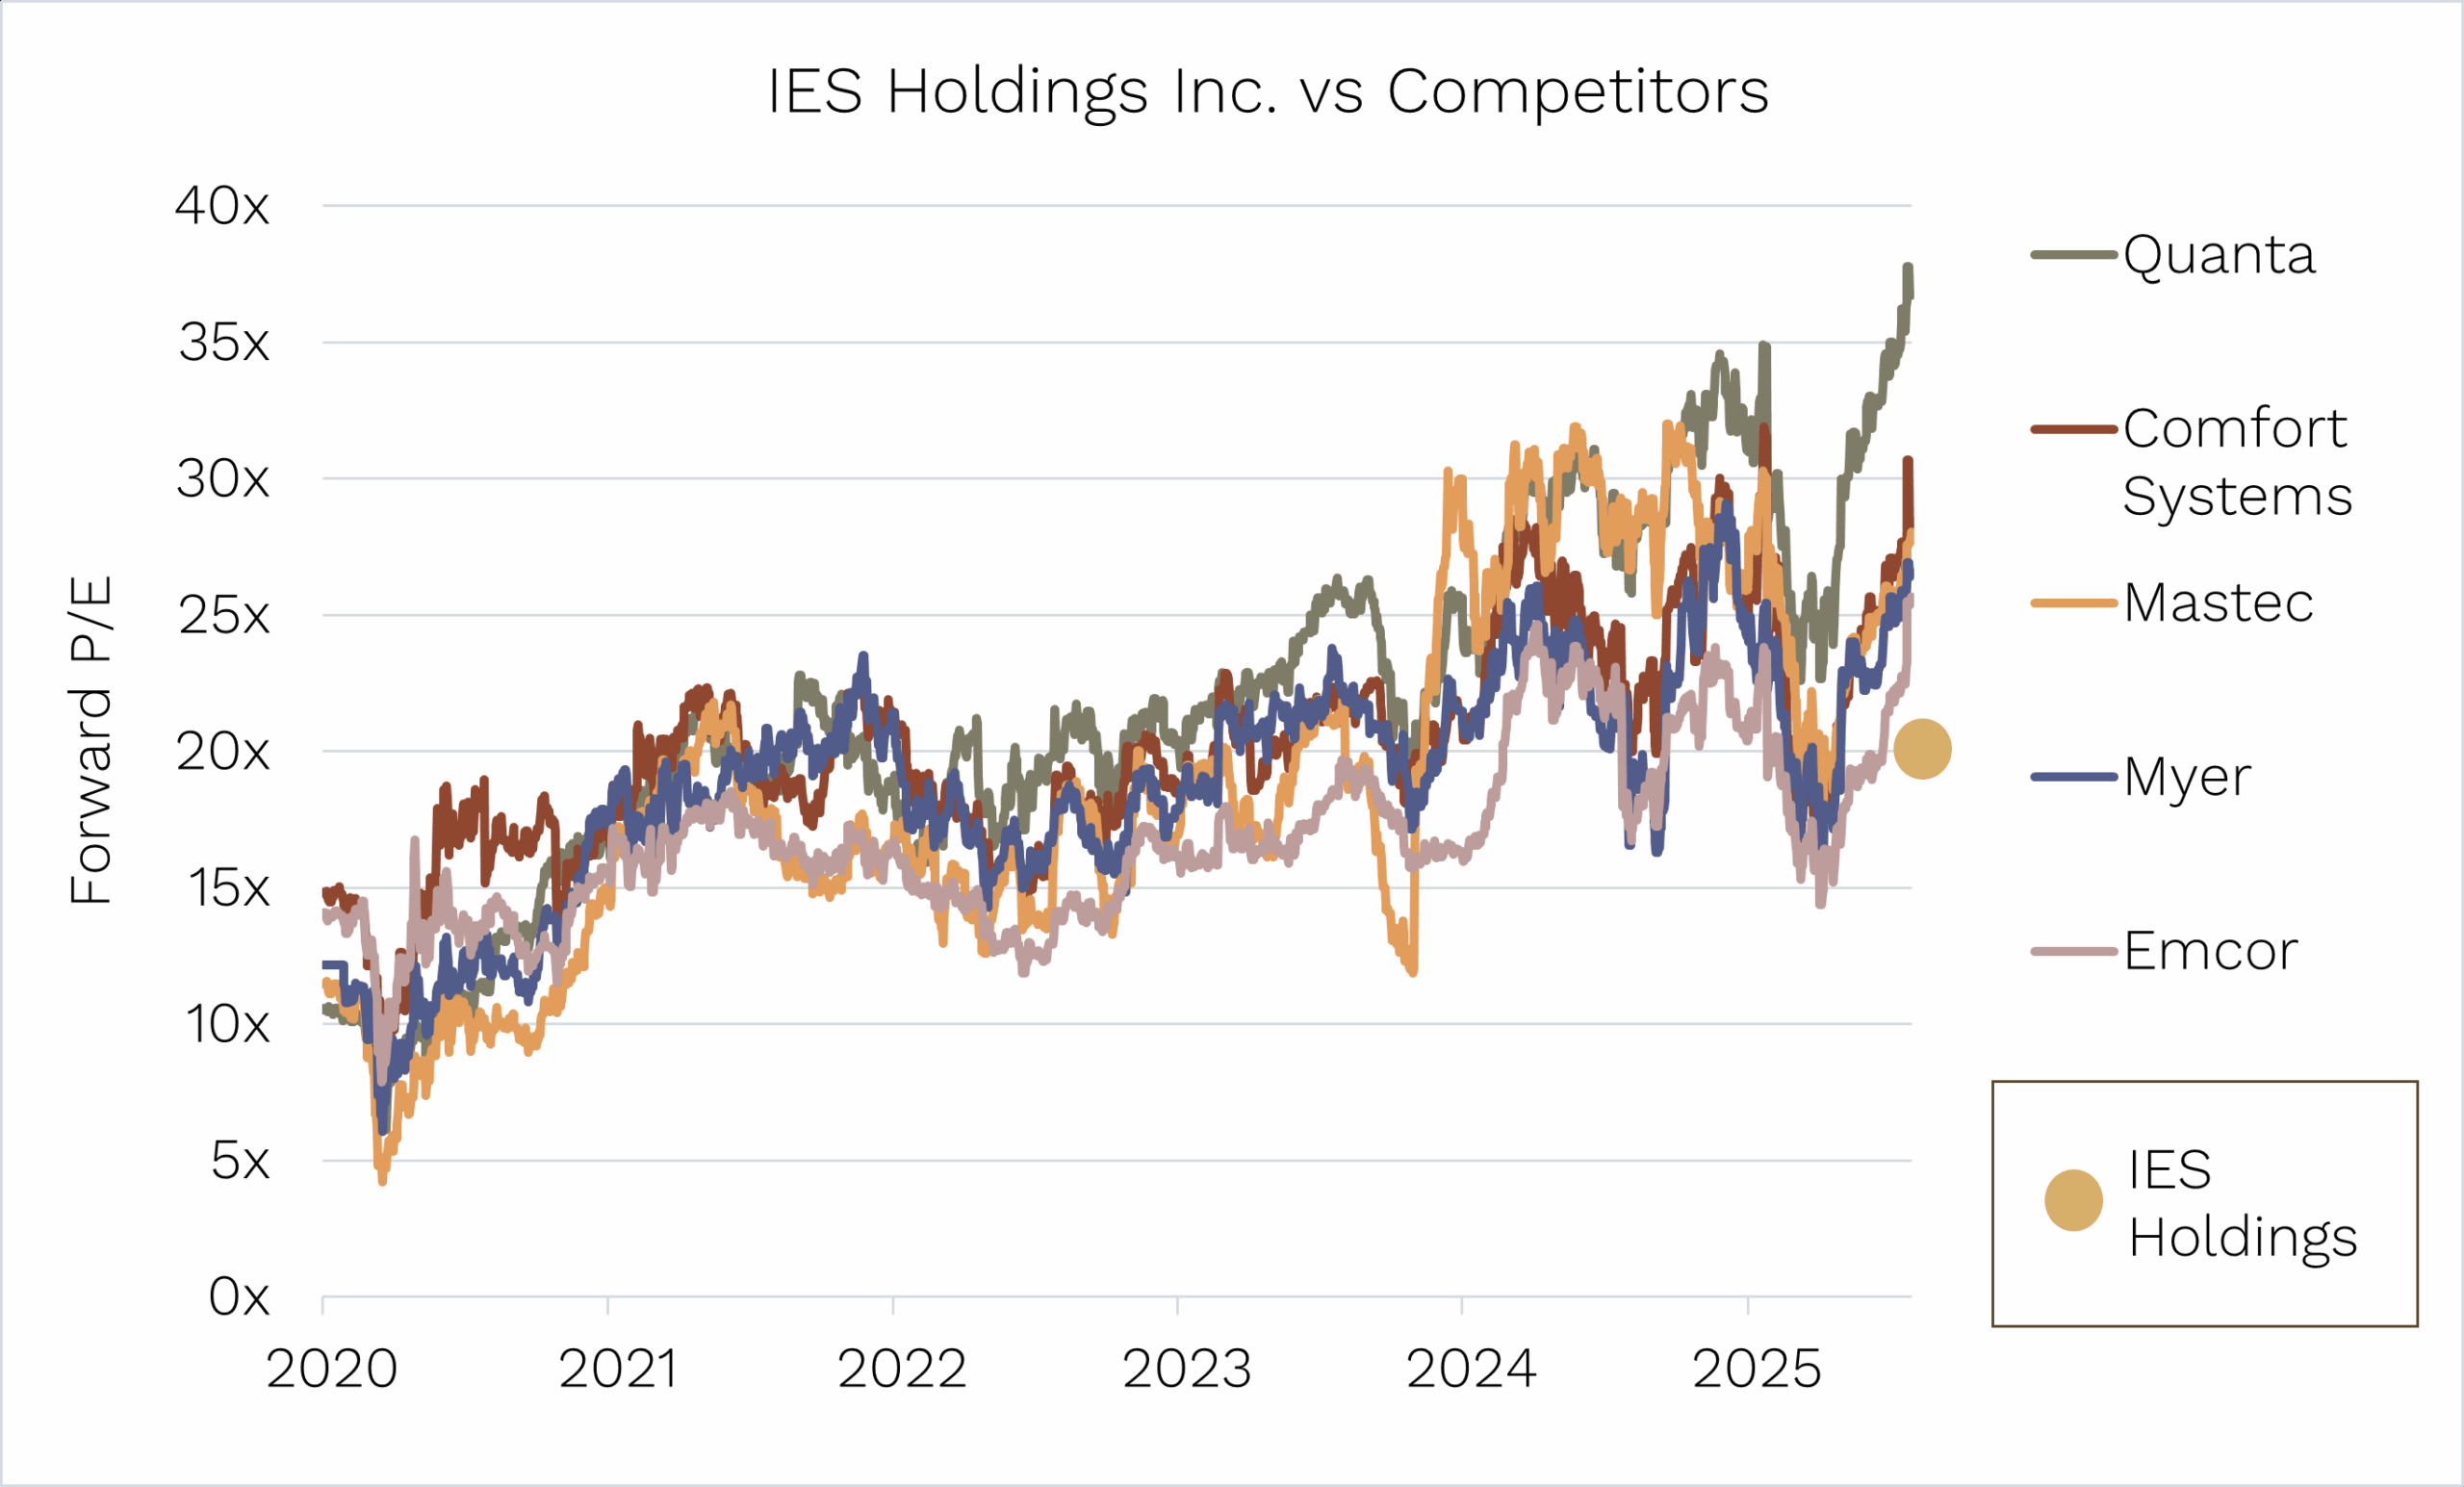
Source: Ophir. Bloomberg.
IES ticks many of the boxes we look for in a company:
- Structural growth
- Valuation upside
- Balance sheet flexibility
While the rest of the market crowds around the usual AI beneficiaries, we are happy owning one of the companies quietly wiring the future.
As always, thank you for entrusting your capital with us.
Kindest regards,


Andrew Mitchell & Steven Ng
Co-Founders & Senior Portfolio Managers
Ophir Asset Management
Footnotes-
[1] Technically they are the ones that actually pay the tariff but ultimately it can in effect be shared across foreign exporters and U.S consumers
[2] Morningstar data for Global Mid/Small Cap Equity funds available in Australia since October 2018 inception
This document has been prepared by Ophir Asset Management Pty Ltd (ABN 88 156 146 717, AFSL 420082) (“Ophir”) and contains information about one or more managed investment schemes managed by Ophir (the “Funds”) as at the date of this document. The Trust Company (RE Services) Limited ABN 45 003 278 831, the responsible entity of, and issuer of units in, the Ophir High Conviction Fund (ASX: OPH), the Ophir Global Opportunities Fund and the Ophir Global High Conviction Fund. Ophir is the trustee and issuer of the Ophir Opportunities Fund.
This is general information only and is not intended to provide you with financial advice and does not consider your investment objectives, financial situation or particular needs. You should consider your own investment objectives, financial situation and particular needs before acting upon any information provided and consider seeking advice from a financial advisor if necessary. Before making an investment decision, you should read the relevant Product Disclosure Statement (“PDS”) and Target Market Determination (“TMD”) available at www.ophiram.com or by emailing Ophir at ophir@ophiram.com. The PDS does not constitute a direct or indirect offer of securities in the US to any US person as defined in Regulation S under the Securities Act of 1993 as amended (US Securities Act).
All Ophir Funds are deemed high risk within their respective Target Market Determination documentation. Ophir does not guarantee the performance of the Funds or return of capital. An investment may achieve a lower than expected return and investors risk losing some or all of their principal investment. Past performance is not a reliable indicator of future performance. Any opinions, forecasts, estimates or projections reflect our judgment at the date of this was prepared, and are subject to change without notice. Rates of return cannot be guaranteed and any forecasts, estimates or projections as to future returns should not be relied on, as they are based on assumptions which may or may not ultimately be correct.
Actual returns could differ significantly from any forecasts, estimates or projections provided.
The Trust Company (RE Services) Limited is a part of the Perpetual group of companies. No company in the Perpetual Group (Perpetual Limited ABN 86 000 431 827 and its subsidiaries) guarantees the performance of any fund or the return of an investor’s capital.