By Andrew Mitchell & Steven Ng
Co-founders and Senior Portfolio Managers

We delve into the segments which drove market returns in January and why it is important that we stick to our knitting and resist the temptation to chase the latest flavour of the month.
Welcome to the January Ophir Letter to Investors – thank you for investing alongside us for the long term.
Last year’s trash becomes January’s treasure
After the absence of a Santa rally to end 2022, and the looming prospect of a U.S. recession in 2023, investors could have been expected to start the year in a sombre mood.
But boy, was that not the case.
A sublime cooling in global inflation, a more dovish Fed and big falls in long-term interest rates got the market excited.
The U.S. (S&P500 +6.3%), Europe (MSCI Europe +6.8%), Japan (Nikkei +4.7%) and Australia (ASX200 +6.2%) all posted big share market gains.
That +6.2% result for the Aussie share market was the biggest January gain since 1986. A huge 0.5% fall in the Australian 10-year bond yield, the sharpest January fall on record, supercharged valuations.
Other good news that excited markets were the earlier-than-expected reopening of the Chinese economy from COVID lockdowns, and a milder-than-expected European winter, which cut the likelihood of recession there this year.
As you might expect in such a set-up, cyclical sectors rallied hardest. In global developed share markets, Consumer Discretionary (+14%) won the month whilst the defensive Consumer Staples (-0.4%) sector was the biggest laggard.
But how sustainable is this rally?
In this month’s letter, we examine January’s ‘dash for trash’ where low-quality stocks rallied hard. And we outline why we won’t be tempted to join this manic dash, but instead continue to stick with our proven, earnings-focused investment strategy.
January 2023 Ophir Fund Performance
Before we jump into the letter in more detail, we have included below a summary of the performance of the Ophir Funds during January. Please click on the factsheets if you would like a more detailed summary of the performance of the relevant fund.
The Ophir Opportunities Fund returned +5.7% net of fees in January, underperforming its benchmark which returned +6.6%, and has delivered investors +21.8% p.a. post fees since inception (August 2012).
Download Ophir Opportunities Fund Factsheet
The Ophir High Conviction Fund investment portfolio returned +5.2% net of fees in January, underperforming its benchmark which returned +6.3%, and has delivered investors +13.6% p.a. post fees since inception (August 2015). ASX:OPH provided a total return of 1.6% for the month.
Download Ophir High Conviction Fund Factsheet
The Ophir Global Opportunities returned -1.2% net of fees in January, underperforming its benchmark which returned +4.7%, and has delivered investors +12.8% p.a. post fees since inception (October 2018). We note the performance of the Fund was positive in USD terms though the appreciation of the AUD versus the USD by 3.6% during the month detracted from the Fund’s quoted AUD returns.
Download Ophir Global Opportunities Fund Factsheet
Further market upside after passing technical test?
During the month, the U.S. share market passed its first big test of the year.
U.S. share market passes technical test with flying colours
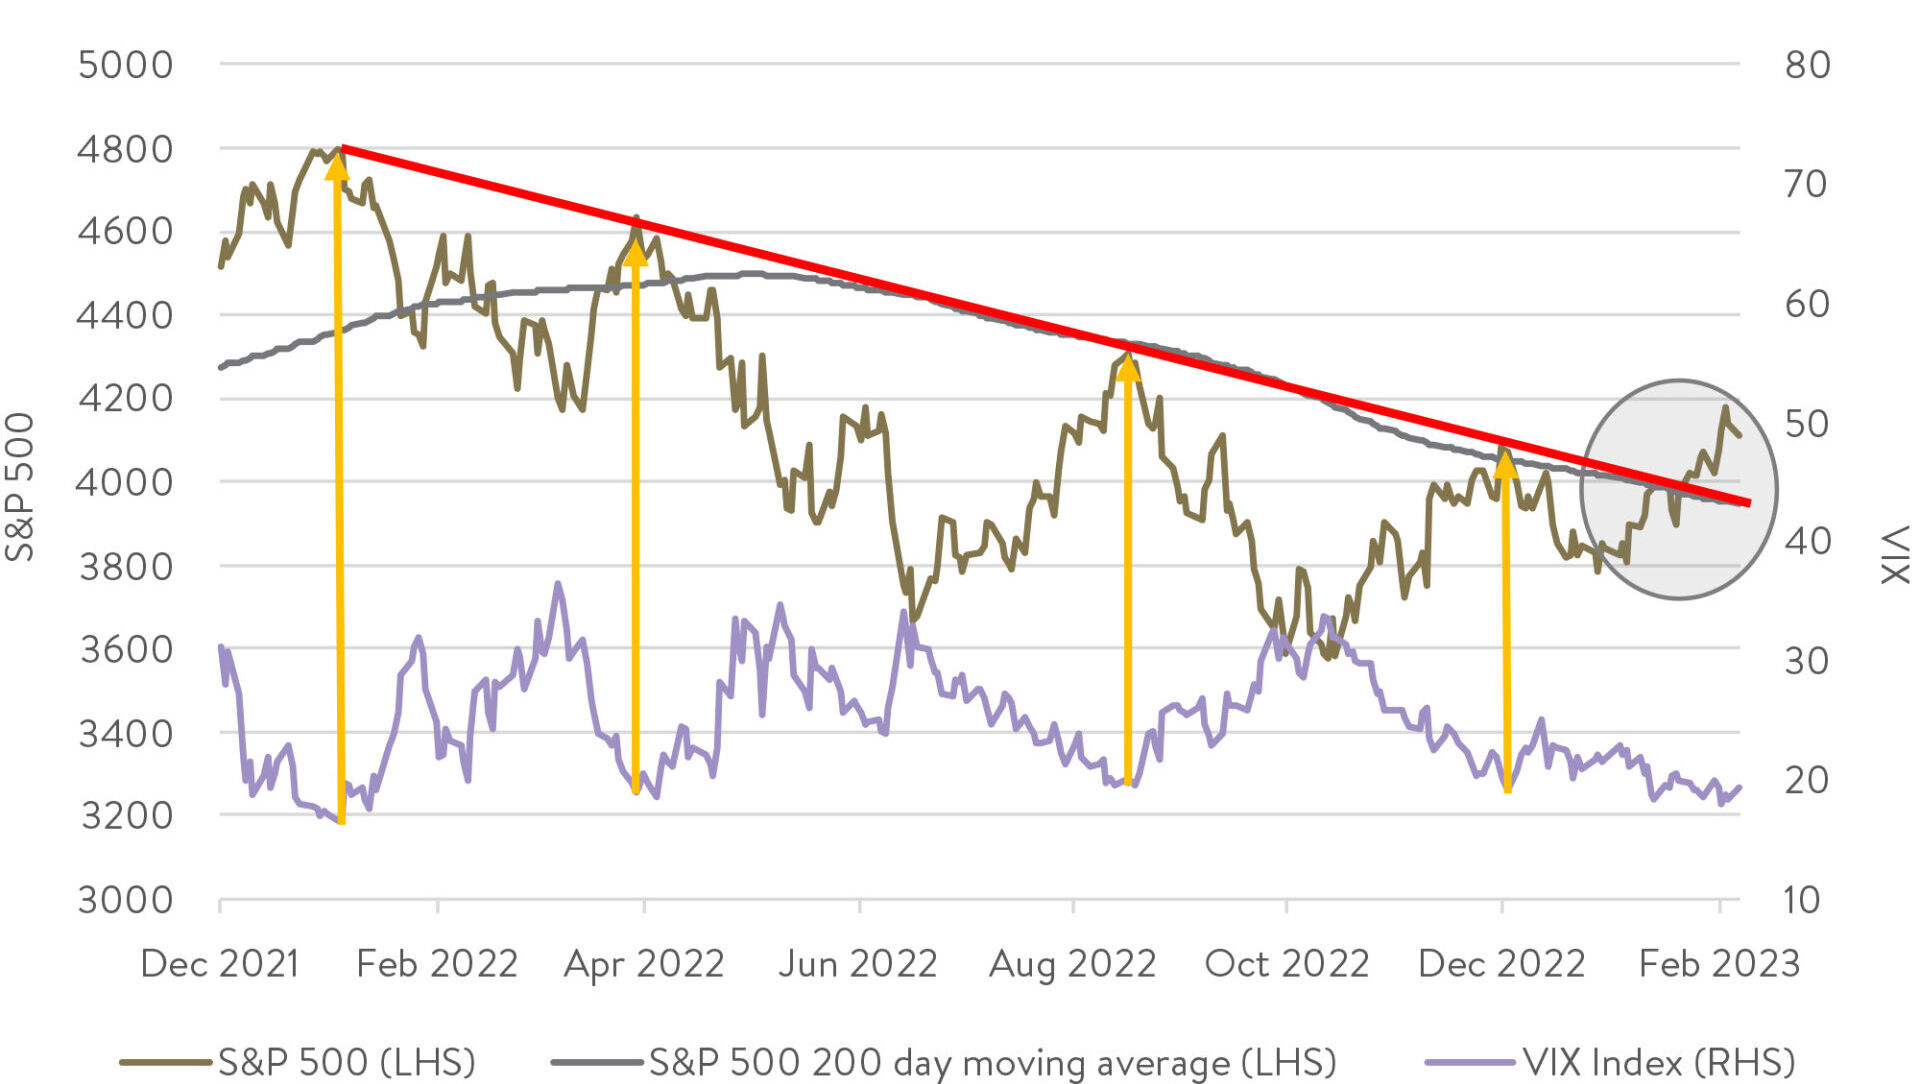
Source: Factset. Data as of 6 February 2023.
It broke through its 200-day moving average (grey line) and negative trend line (red line) that held throughout all of last year. Low share market volatility (purple line – VIX below 20) was a reliable ‘sell’ indicator for the U.S. share market in 2022. But this too was broken in January. Together this, along with other market technical indicators, suggests there may be further upside to markets near term.
Low share market volatility (blue line – VIX below 20) was a reliable ‘sell’ indicator for the U.S. share market in 2022. But this too was broken in January.
Together, this suggests further upside to markets near term.
While a rising tide lifted almost all share market boats (market segments) in January, it was to wildly different degrees. Last year’s big share market losers were the biggest winners in January.
2022’s trash really did become January’s treasure.
Big momentum reversal in January
One way to see this is the performance of the Goldman Sachs Momentum basket which goes long (buys) the highest-returning U.S. stocks of the last 12 months and shorts (sells) the worst performing.
Worst month for momentum ever!
Source: Factset. Data as of 31 January 2023.
This basket (grouping) of stocks in January just had its worst monthly performance … ever!
The top shorts in the basket, which had a horror 2022 (generally falling circa 60-90%) but a stellar January, included companies like Tesla, Affirm Holdings and Wayfair that rebounded +36.0%, +62.0% and +77.9% respectively in the month. They rallied despite no earnings news, and simply because of sentiment that inflation may be tamed.
Another way to see which segments drove the market in January is the chart below. It shows how the market was led by some of the lowest-quality, unprofitable and highly geared businesses.
Last year’s trash becomes last month’s treasure – January performance
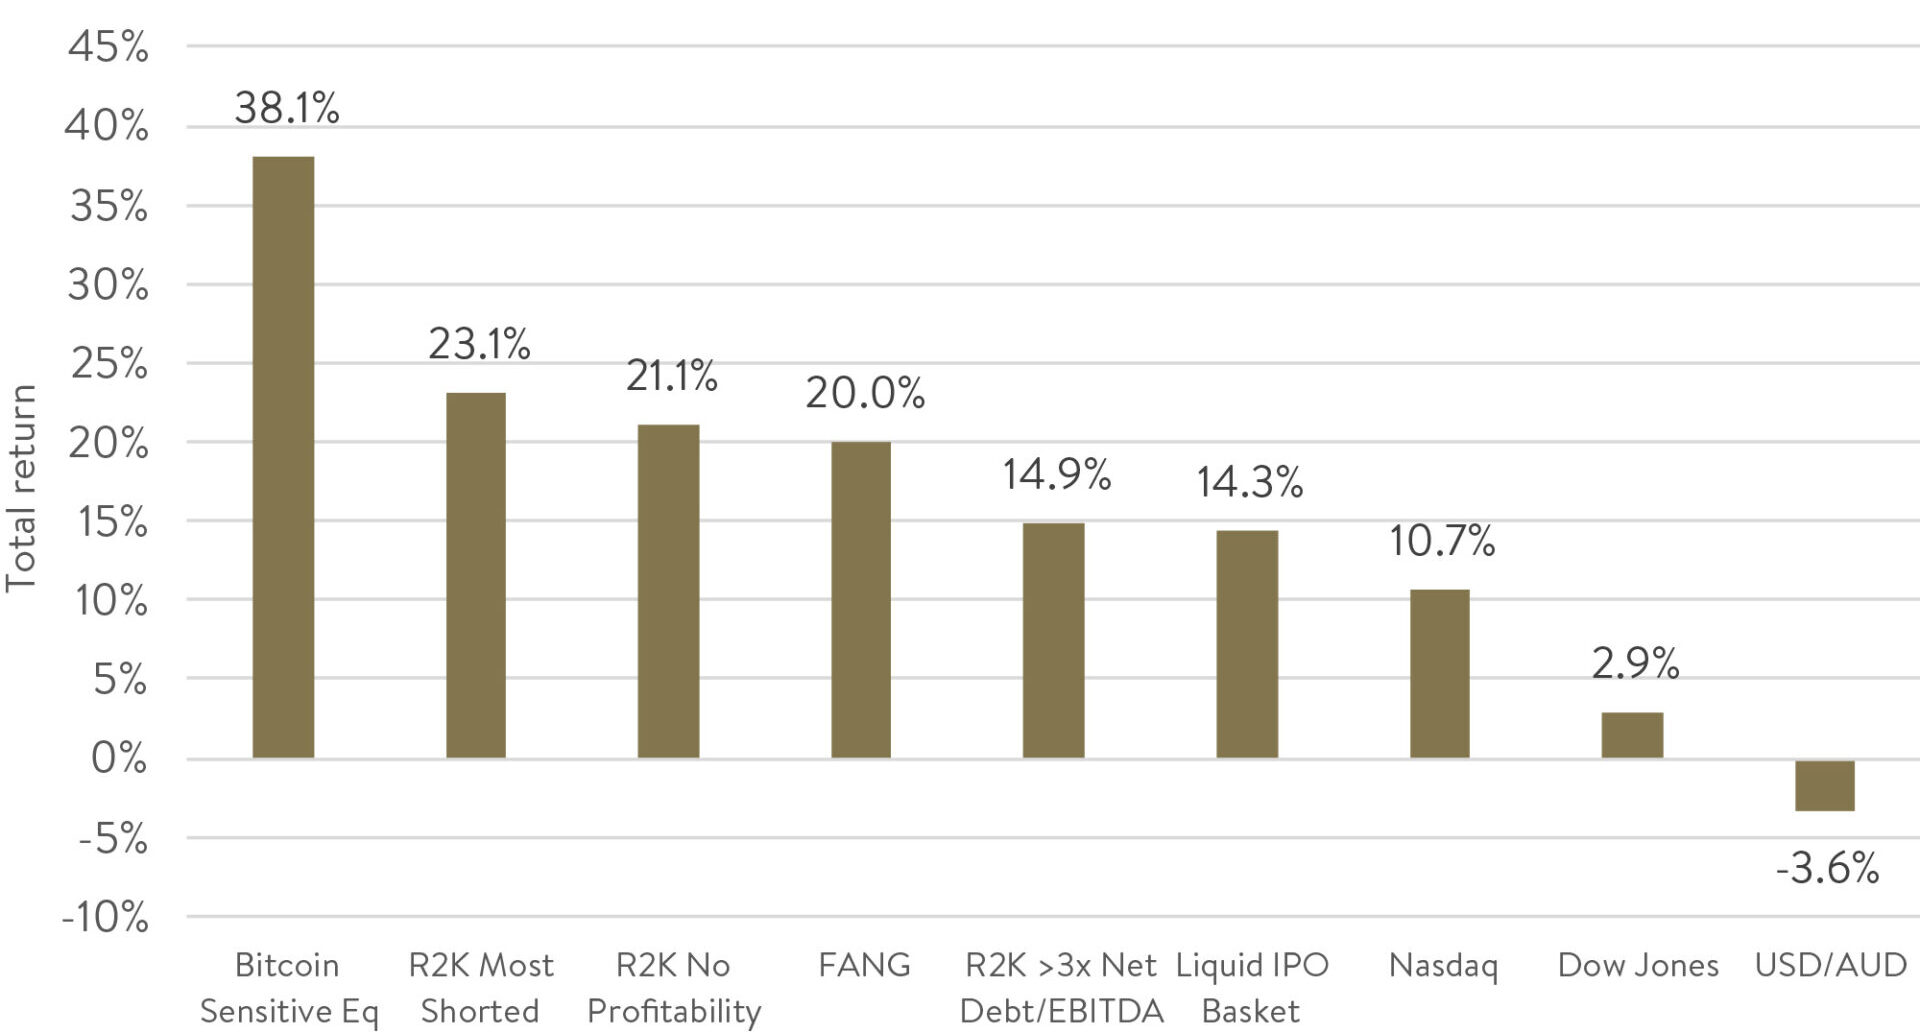
Source: Factset. Data as of 31 January 2023. R2K = Russell 2000.
In the Russell 2000 index, which measures the performance of U.S. small caps, for example, unprofitable companies rose 21.1% on average during January. That was well in excess of the Russell’s 9.7% index return.
Those that had high levels of debt (here we define as greater than 3x Net Debt to EBITDA) also caught a big bid up 15%.
Together, these two groups of businesses – those unprofitable and those highly geared – contributed well over half of the Russel 2000 index’s 9.7% total return for the month (see chart below).
Unprofitable and highly geared businesses drive US small-cap returns in January
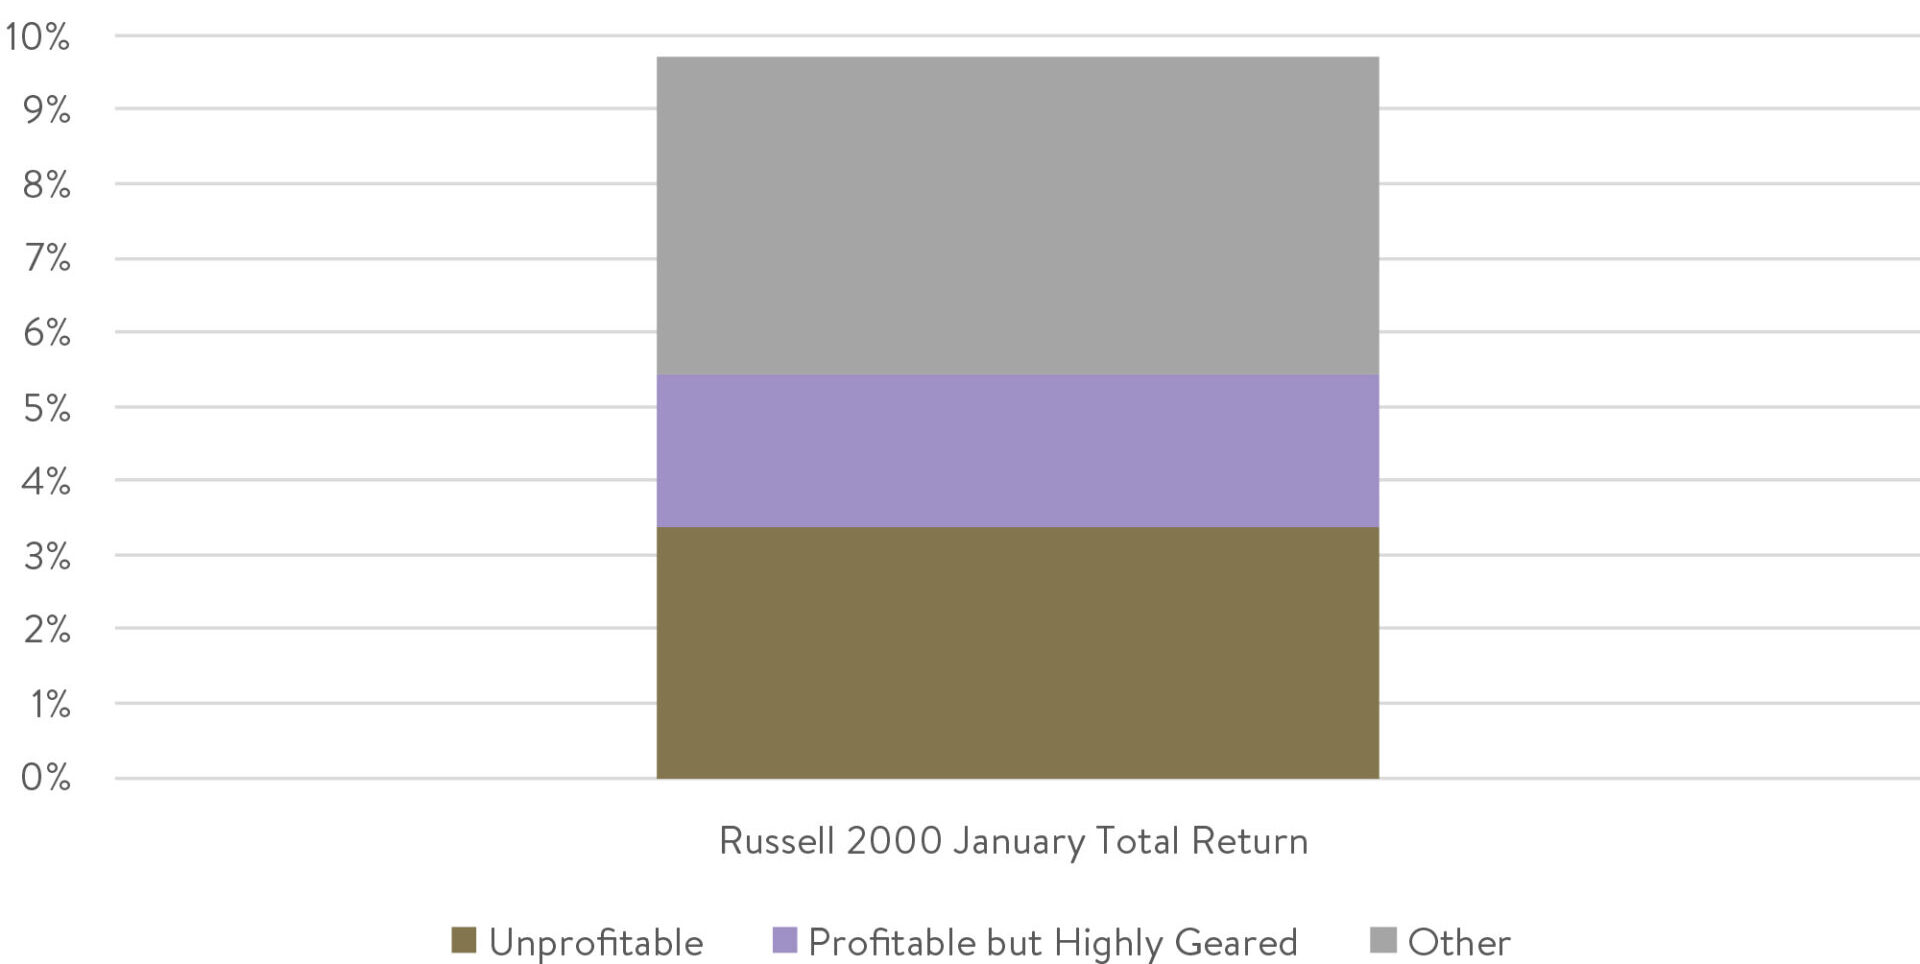
Source: Factset. Data as of 31 January 2023.
Finally, as a way to show you how unique January’s rally was, we looked at the top 100 performing US small caps during the month and saw a full 85 were unprofitable!
January rally led by unprofitable / geared companies in US small caps
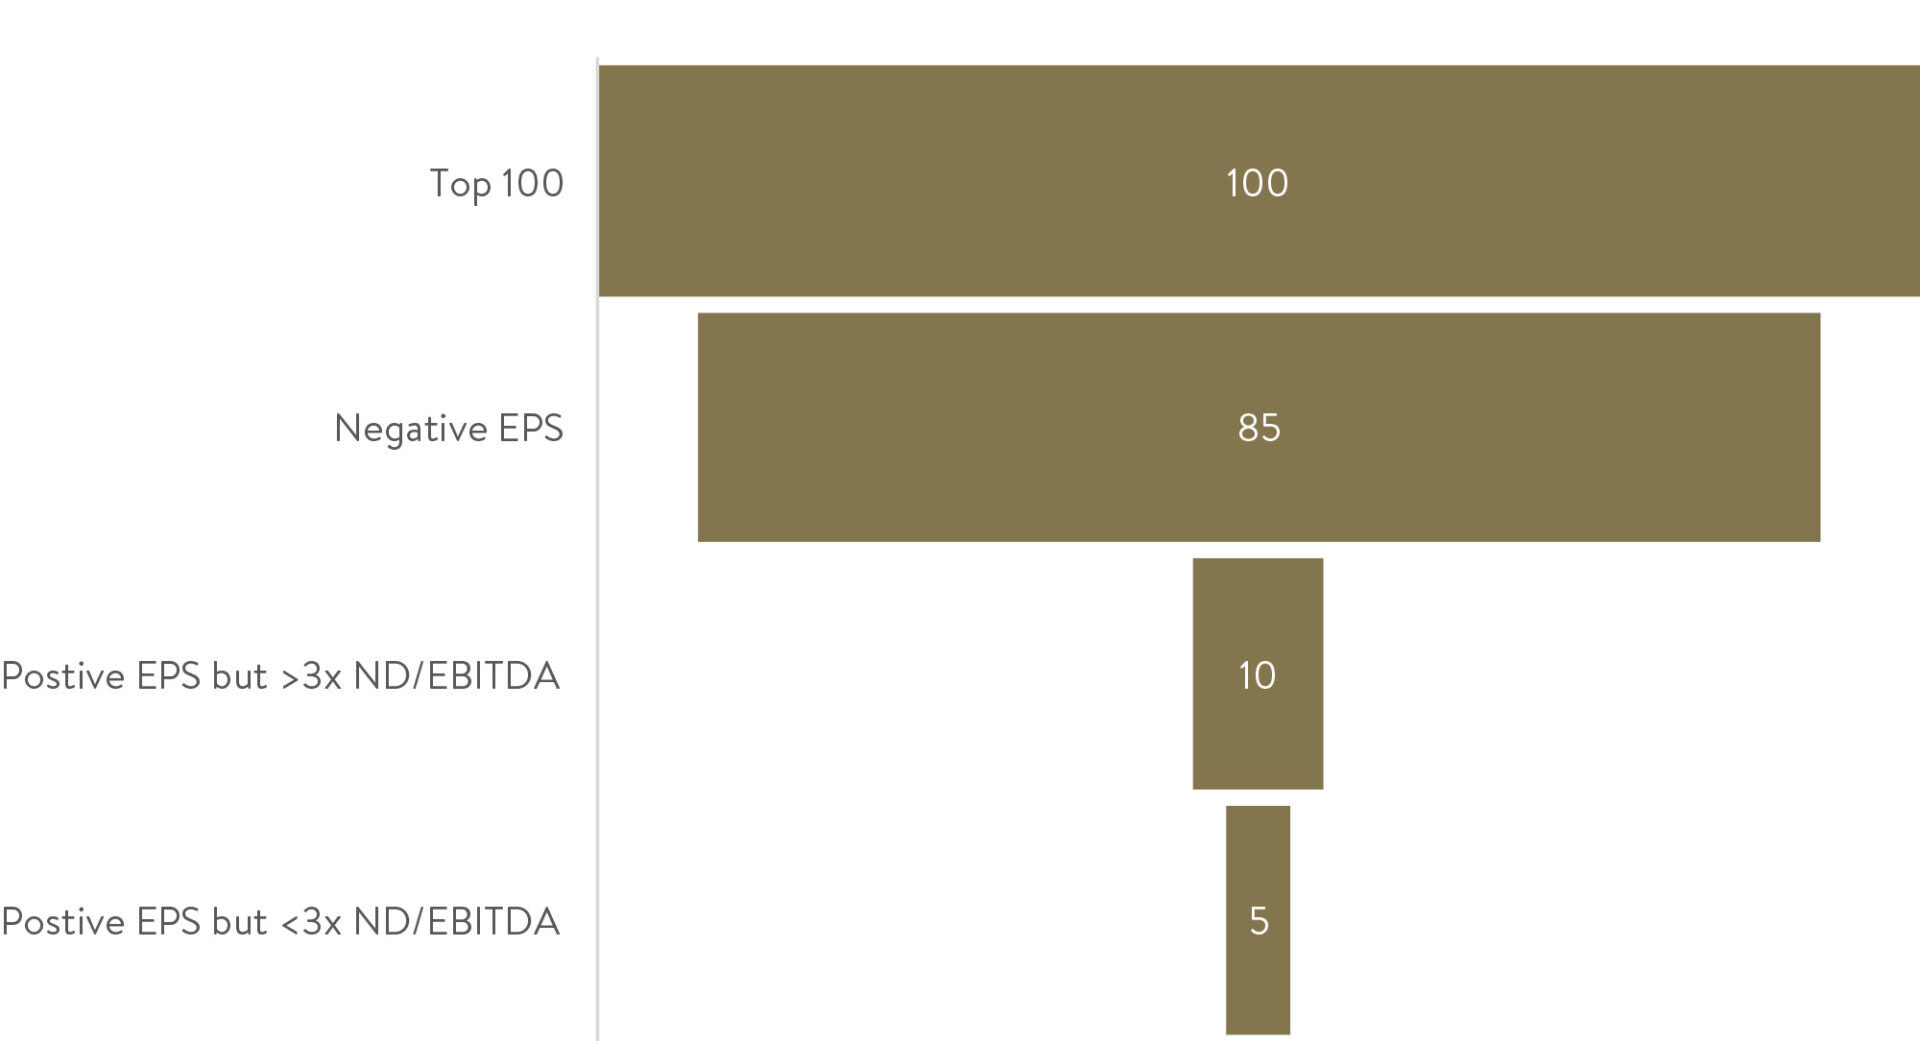
Source: Factset. Data as of 31 January 2023.
Sitting out the trash dash
For long-time investors at Ophir, you would be aware we typically don’t invest in these areas to any significant degree. We were never likely to participate meaningfully in January’s ‘dash for trash’ rally.
This was one of the key reasons the Ophir global funds underperformed their market benchmarks over the month.
(As an aside, while the global funds were down around -1% in January, they were up over 2% in US dollar terms because the AUD appreciated by 3.6% during the month).
We expect to underperform during a low-quality rally in shares. It is not something that we want to chase. Sticking to your knitting is crucial as an investor as there are constant temptations to stray into the latest flavour of the month market segment through fear of missing out (FOMO).
Letting earnings do the heavy lifting
In the medium to long term, earnings growth drives share prices. And that is where our edge lies.
As famed investor Peter Lynch once said:
“Stock prices often move in opposite directions from fundamentals but long term, the direction and sustainability of profits will prevail.”
That is as true for individual companies as it is for share markets as a whole (after all, what are share markets but collections of individual companies).
For loss-making companies, such as those that led January’s rally, profit growth is further in the future and more uncertain. That often means that their share prices are more volatile. But investors shouldn’t chase that volatility.
We show this concept starkly below.
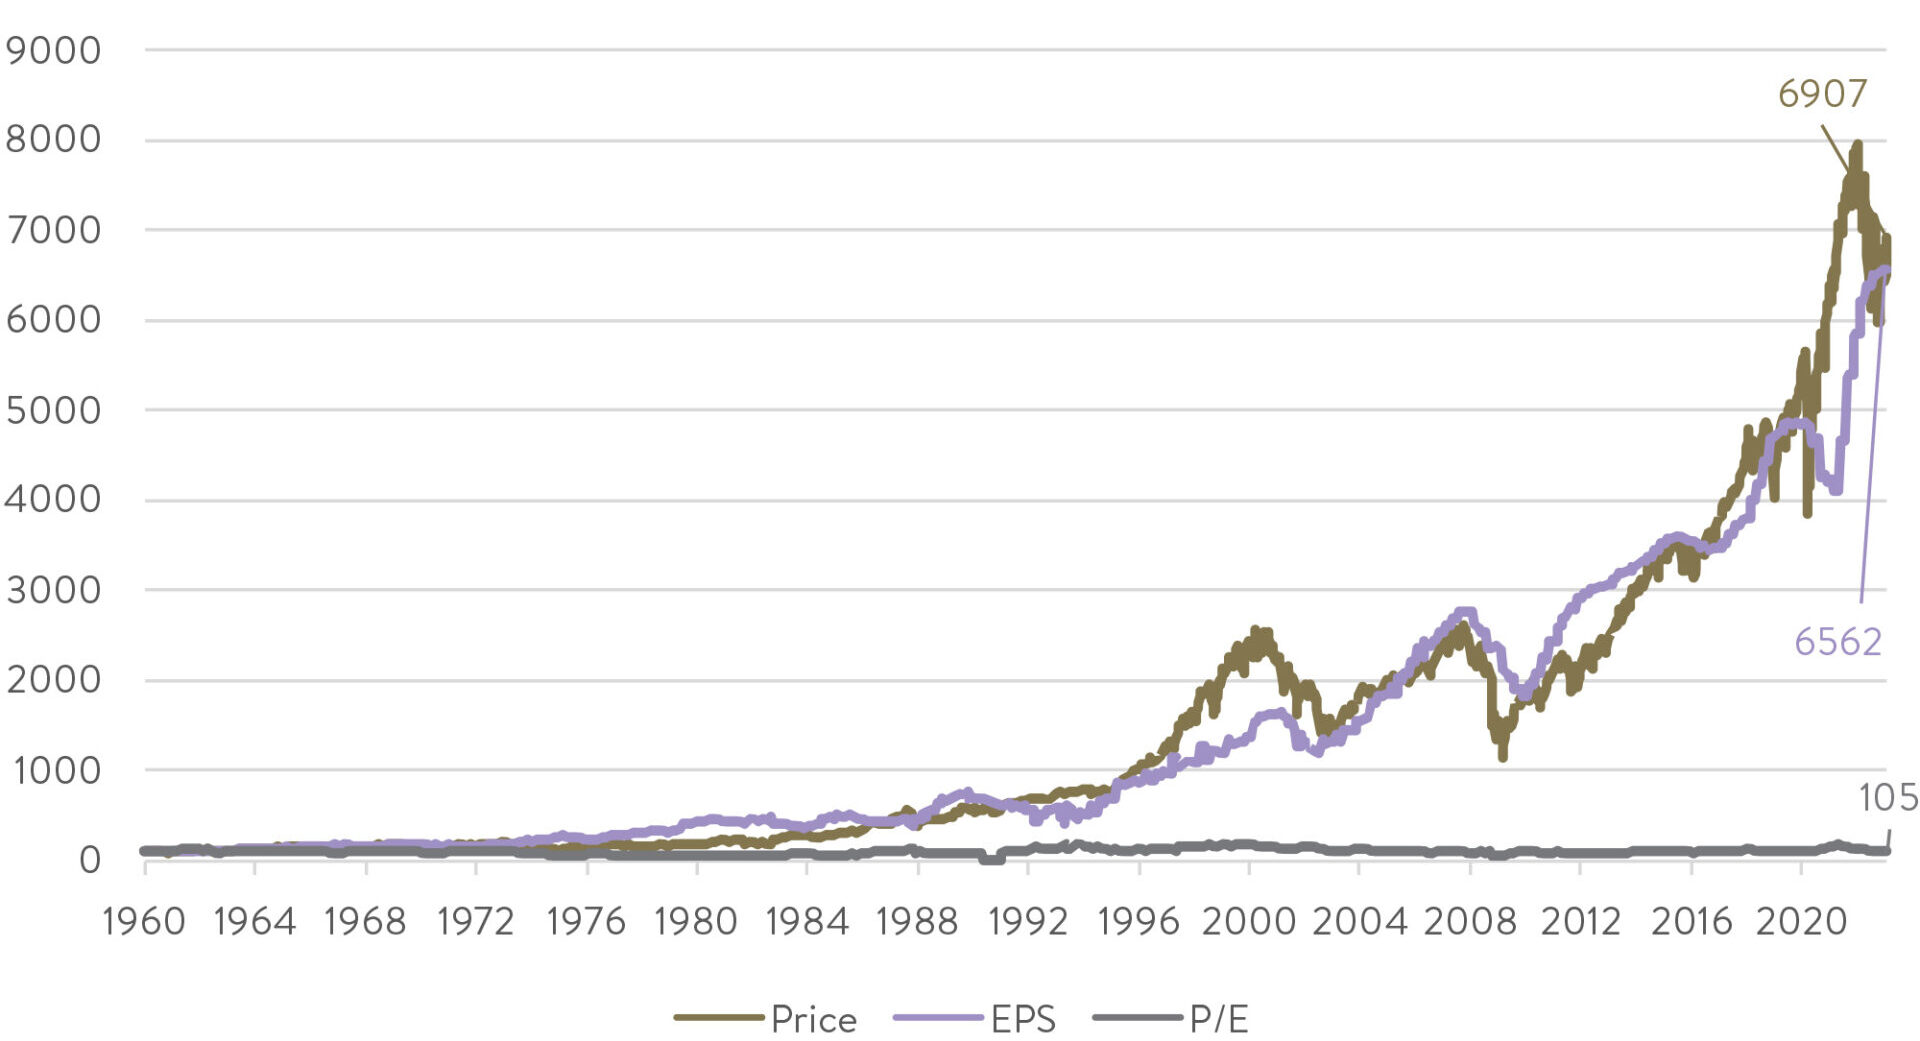
S&P500 – Price, Earnings (EPS) and P/E (indexed to 100)
Source: Factset. Data as of 6 February 2023.
From 1960 (where the available data starts) to today, the increase in the S&P500 index has virtually been solely driven by increases in earnings. There was almost no impact from increases or decreases in the price to earnings (P/E) ratio.
However, if you only looked at short-term price movements in shares or share markets you’d be distracted from the fact that earnings are the key locomotive driving returns.
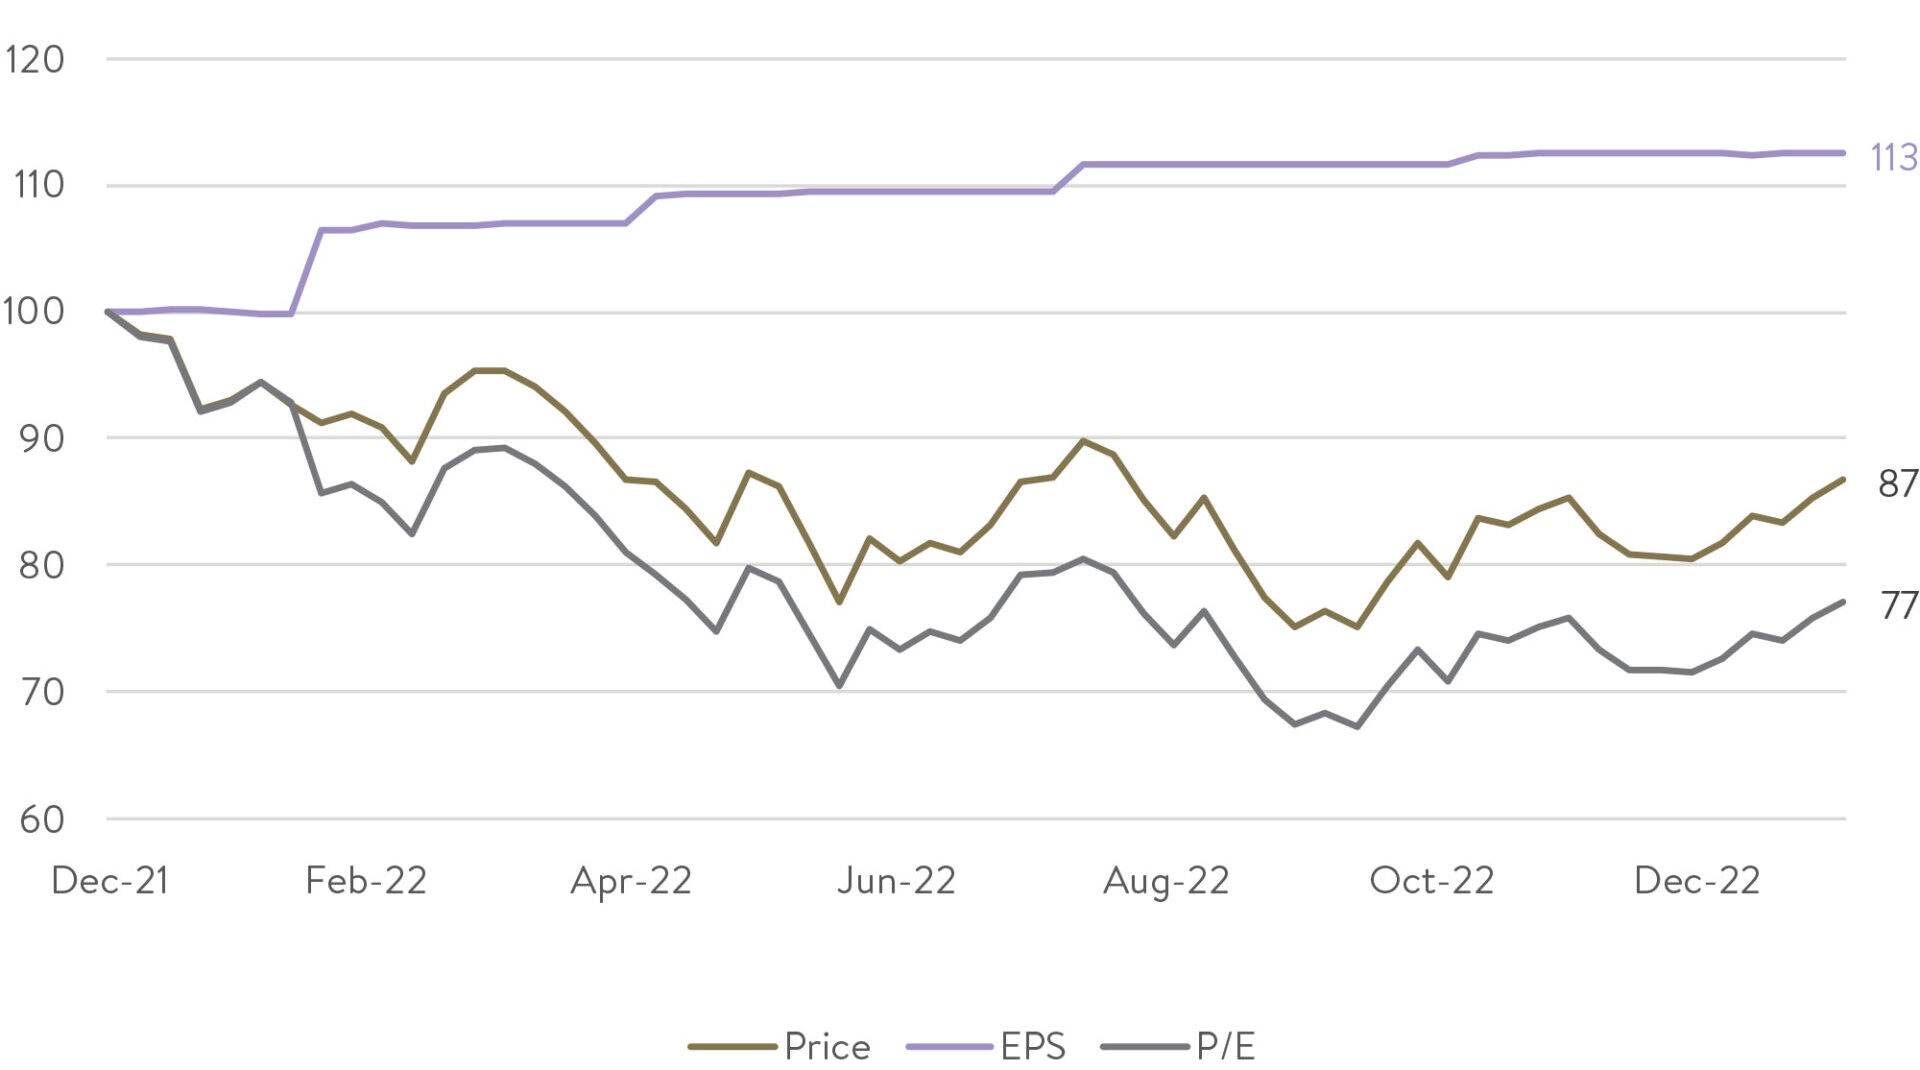
S&P500 – Price, Earnings (EPS) and P/E (indexed to 100)
Source: Factset. Data as of 6 February 2023.
Above, we show the same data since the start of 2022. The S&P500 index has been primarily driven by falls in the P/E, despite earnings climbing.
This can be sustained in the short term but not in the long term. The P/E change tends to ‘wash out’ as time goes on and earnings take over as the driver.
Beats not being rewarded … but they will
That takes us to the current Q4 reporting season in the US, which at the time of writing is nearly three-quarters finished for S&P500 stocks (small caps are far less progressed because they typically report later in February).
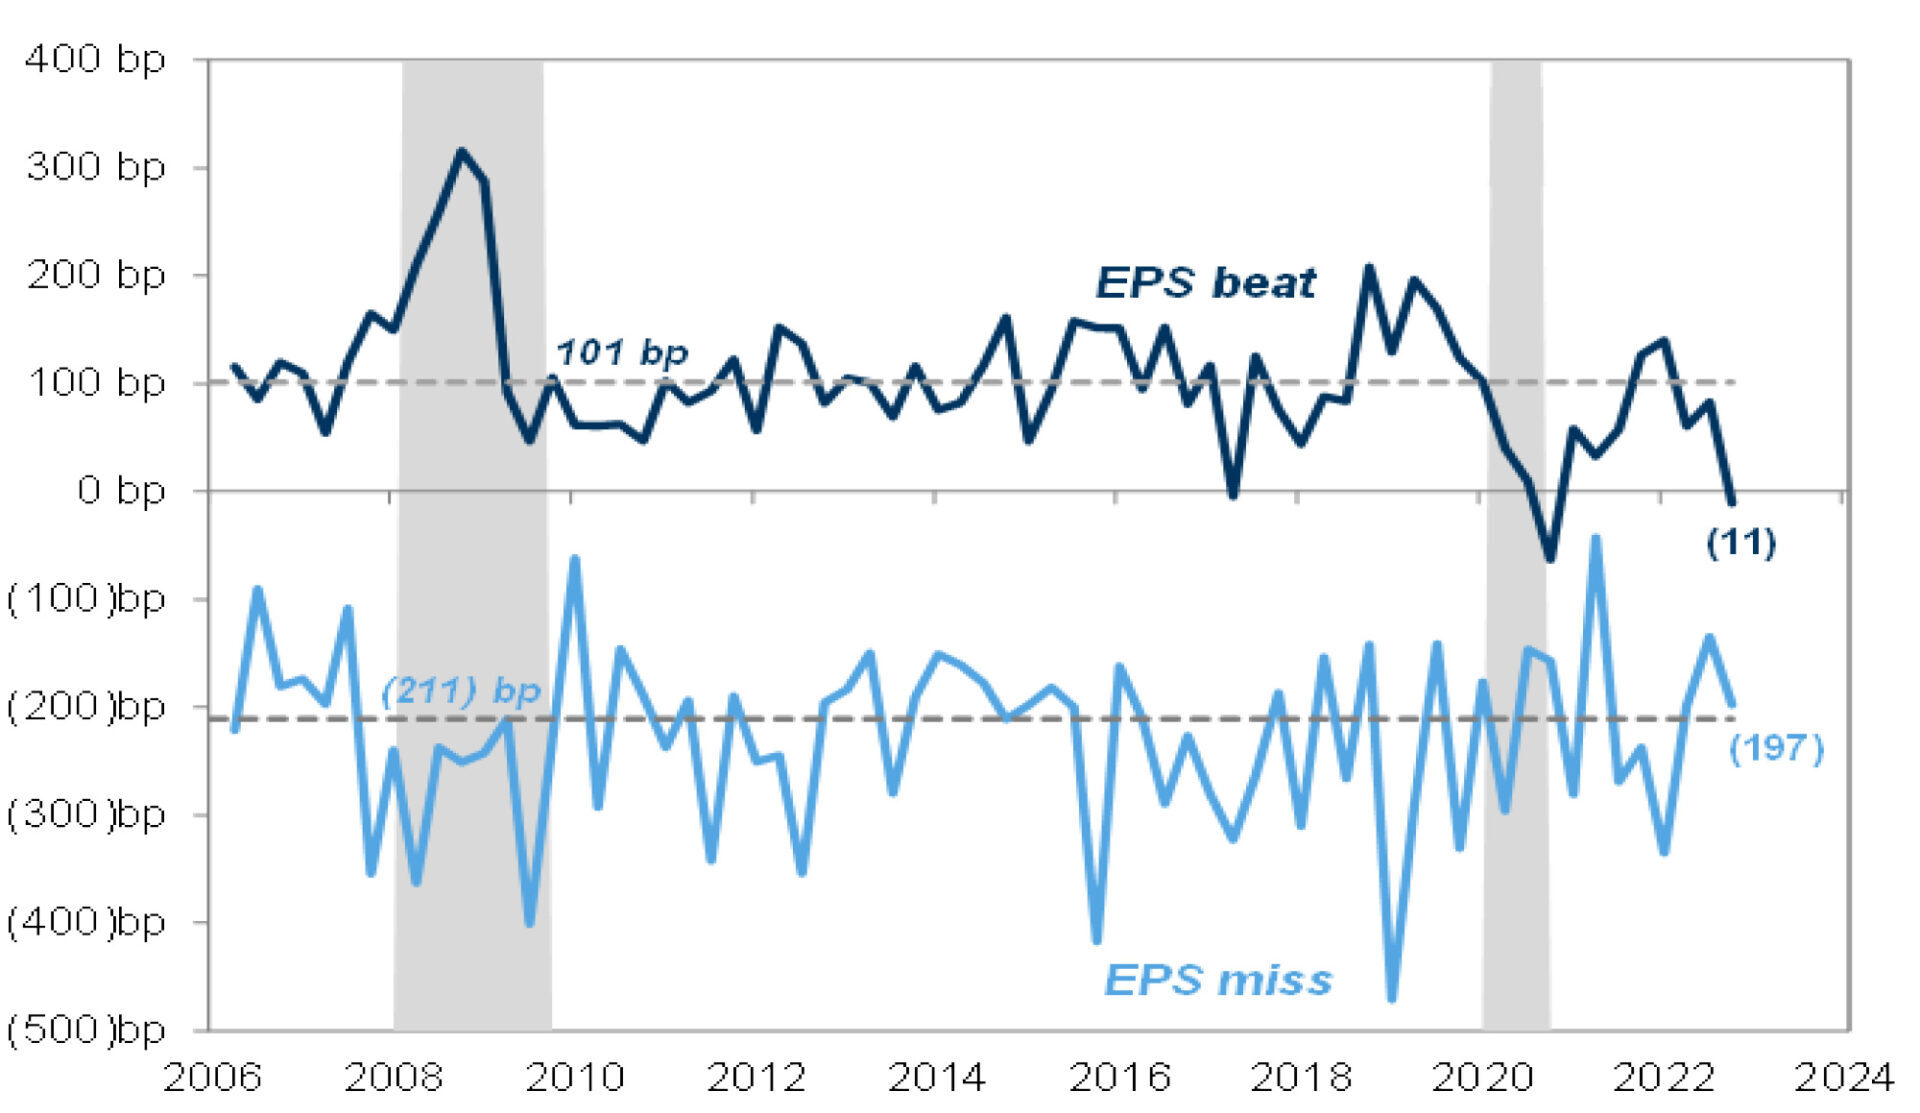
An interesting phenomenon this reporting season has been that earnings growth ‘beats’ (where earnings are better than expected) are not being rewarded like they normally would.
More specifically, when a company has beaten earnings expectations, the median (‘typical’) share price reaction has been for the stock to underperform the market. These stocks on average have underperformed by -11 basis points (see dark blue line in chart below).
That’s way below the historical average of 101 basis points of outperformance (see top dotted grey line in chart below) when a company beats earnings expectations. This is likely happening as those companies with “beats” have been sold to fund the purchase of low quality stocks that rallied in January.
Median excess return vs. S&P 500 on day after earnings report
Source: Goldman Sachs. Data as of 3 February 2023.
This provides a challenge for earnings-based investors like ourselves.
But one thing we can be sure of: like night follows day, this will revert and beats will go back to outperforming.
With enough time and patience, and with no key changes in our investment team and process, we remain confident we can keep picking a higher proportion of earnings ‘beats’ than the market, which we believe will help drive long-term outperformance of our funds.
2023 market forecast: cloudy, with a chance of rain
After starting off strong in 2023, there may be further upside to share markets in the near term given the momentum at play.
But we are more cautious for the middle and latter parts of this year.
Interest rate hikes in major economies will continue to eat into demand, and corporate earnings may have further to fall. The size of any drop in demand and earnings, though, is highly uncertain.
In the U.S., falling inflation but a very tight labour market, along with mixed signals on economic growth, creates a muddied picture. Both a soft and hard landing are plausible outcomes.
In our view, the probability of more significant earnings falls is still higher than usual.
Now is not the time for making big heroic macroeconomic bets (is there ever a time?).
That’s why in the Ophir Funds we are preferring companies with resilient earnings and where we are confident those earnings will be delivered. Clean balance sheets have always been a key criteria for us, but we believe is particularly so now given the stage of the cycle.
We remain confident performance will turn
Our preference for resilient earnings and clean balance sheets may see our short-term performance wax or wane versus benchmarks in a market where P/E changes are driving the winners, like they did this month.
But in order to not be blown off course by month-to-month changes, investors must have a north star. For us, that is getting the earnings right. Because history has shown that is the most important thing to focus on over the long term.
Whilst performance has certainly been disappointing over the last year or so in the Ophir Funds this has overwhelmingly been driven by changes to the P/E multiple on portfolio companies we hold, as distinct from earnings disappointments (of which of course there will always be some). The opposite of which would be far more concerning to us.
We don’t believe our ability to get the earnings right more often than not, which has held us in good stead over the long term in our careers, has deserted us. Mean reversion is a powerful force in investing. P/E changes will make way for earnings driving share prices once again.
We remain confident that performance will turn around. It likely won’t be because we have done anything different. It will just be that the market will focus back on earnings and the P/E headwind from higher interest rates will be over.
And, given the reduced valuations in small caps at present, particularly in the U.S., there may even be valuation tailwinds during an eventual market recovery to boost earnings-based returns.
As always, thank you for entrusting your capital with us.
Kindest regards,
Andrew Mitchell & Steven Ng
Co-Founders & Senior Portfolio Managers
Ophir Asset Management
This document is issued by Ophir Asset Management Pty Ltd (ABN 88 156 146 717, AFSL 420 082) (Ophir) in relation to the Ophir Opportunities Fund, the Ophir High Conviction Fund and the Ophir Global Opportunities Fund (the Funds). Ophir is the trustee and investment manager for the Ophir Opportunities Fund. The Trust Company (RE Services) Limited ABN 45 003 278 831 AFSL 235150 (Perpetual) is the responsible entity of, and Ophir is the investment manager for, the Ophir Global Opportunities Fund and the Ophir High Conviction Fund. Ophir is authorised to provide financial services to wholesale clients only (as defined under s761G or s761GA of the Corporations Act 2001 (Cth)). This information is intended only for wholesale clients and must not be forwarded or otherwise made available to anyone who is not a wholesale client. Only investors who are wholesale clients may invest in the Ophir Opportunities Fund. The information provided in this document is general information only and does not constitute investment or other advice. The information is not intended to provide financial product advice to any person. No aspect of this information takes into account the objectives, financial situation or needs of any person. Before making an investment decision, you should read the offer document and (if appropriate) seek professional advice to determine whether the investment is suitable for you. The content of this document does not constitute an offer or solicitation to subscribe for units in the Funds. Ophir makes no representations or warranties, express or implied, as to the accuracy or completeness of the information it provides, or that it should be relied upon and to the maximum extent permitted by law, neither Ophir nor its directors, employees or agents accept any liability for any inaccurate, incomplete or omitted information of any kind or any losses caused by using this information. This information is current as at the date specified and is subject to change. An investment may achieve a lower than expected return and investors risk losing some or all of their principal investment. Ophir does not guarantee repayment of capital or any particular rate of return from the Funds. Past performance is no indication of future performance. Any investment decision in connection with the Funds should only be made based on the information contained in the relevant Information Memorandum or Product Disclosure Statement.


