The missing ingredient for small cap outperformance is here.
The 2025 narrative rollercoaster
With Trump 2.0 at the helm of the world’s largest economy, many investors expected 2025 to be a wild ride and boy, it certainly did not disappoint.
Shifting investor narratives were enough to cause whiplash, turning the morning headline check here in Australia into a real rollercoaster.
Consider just some of the questions that were crammed into a single year:
Is the U.S. headed for a recession?
Does Trump want to tank the U.S. economy to drive rates lower?
Does Trump want to run the economy hot, caring less about returning inflation to target?
Are we in a market bubble? Or maybe just an AI bubble?
Will the Fed Chair be fired, or will the Fed lose its independence?
How high will U.S. tariffs go, and what will that mean for growth and inflation?
Is rising U.S. imperialism hurting its investability?
Is World War III about to start?!
Are all our jobs going to be replaced by AI?
Despite all that, including a -19% drawdown in April after Trump’s Liberation Day tariff announcements, the S&P 500 put on a very healthy +16.4% in 2025. This followed gains of +23.3% and +24.2% gains in 2024 and 2023. It has been a very good few years for global share market investors, particularly those exposed to U.S. large caps, more specifically, mega cap tech companies.
New year, same winners
Perhaps the most surprising thing is that, despite the macro and political volatility dominating headlines, you were better off throwing your crystal ball in the bin at the start of 2025 and simply sticking with what had worked in 2024 and 2023.
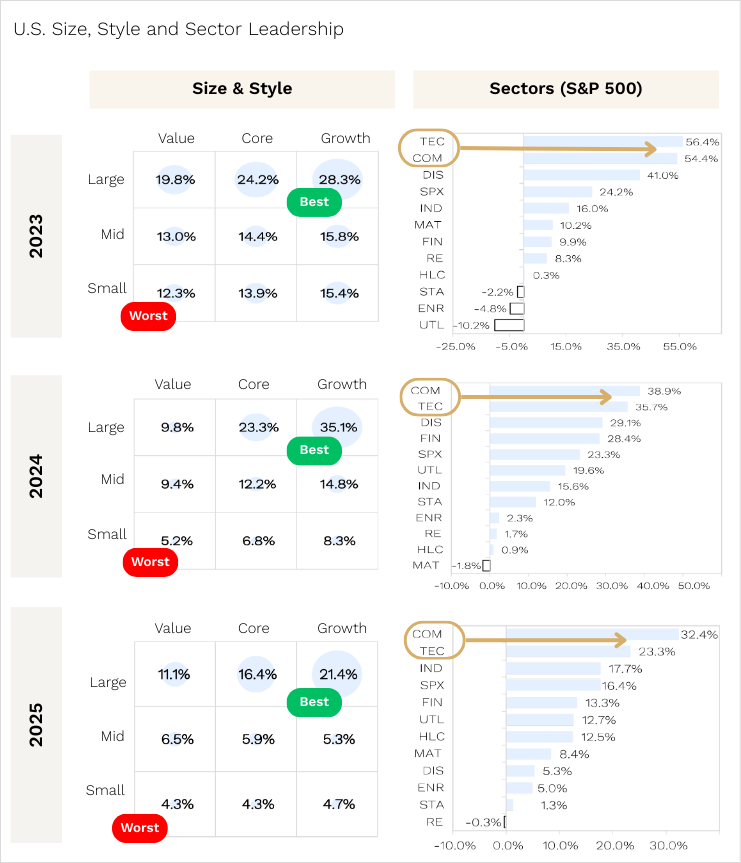
As shown below, U.S. large caps again outperformed mid and small caps, while growth orientated stocks outperformed value.
On a sector basis, the winners were once again familiar, with Technology (think Nvidia, Apple, Microsoft) and Communication Services (think Google & Meta) coming out on top.
Source: Piper Sandler, Ophir.
BUT, we do not see 2026 as a “Connect 4” year where the same large cap growth playbook delivers a fourth consecutive year of outperformance. We unpack why a little later.
First though, despite U.S. and global small caps underperforming large caps again in 2025, we want to highlight what drove the larger than normal outperformance across our global funds.
2025 Ophir performance highlights
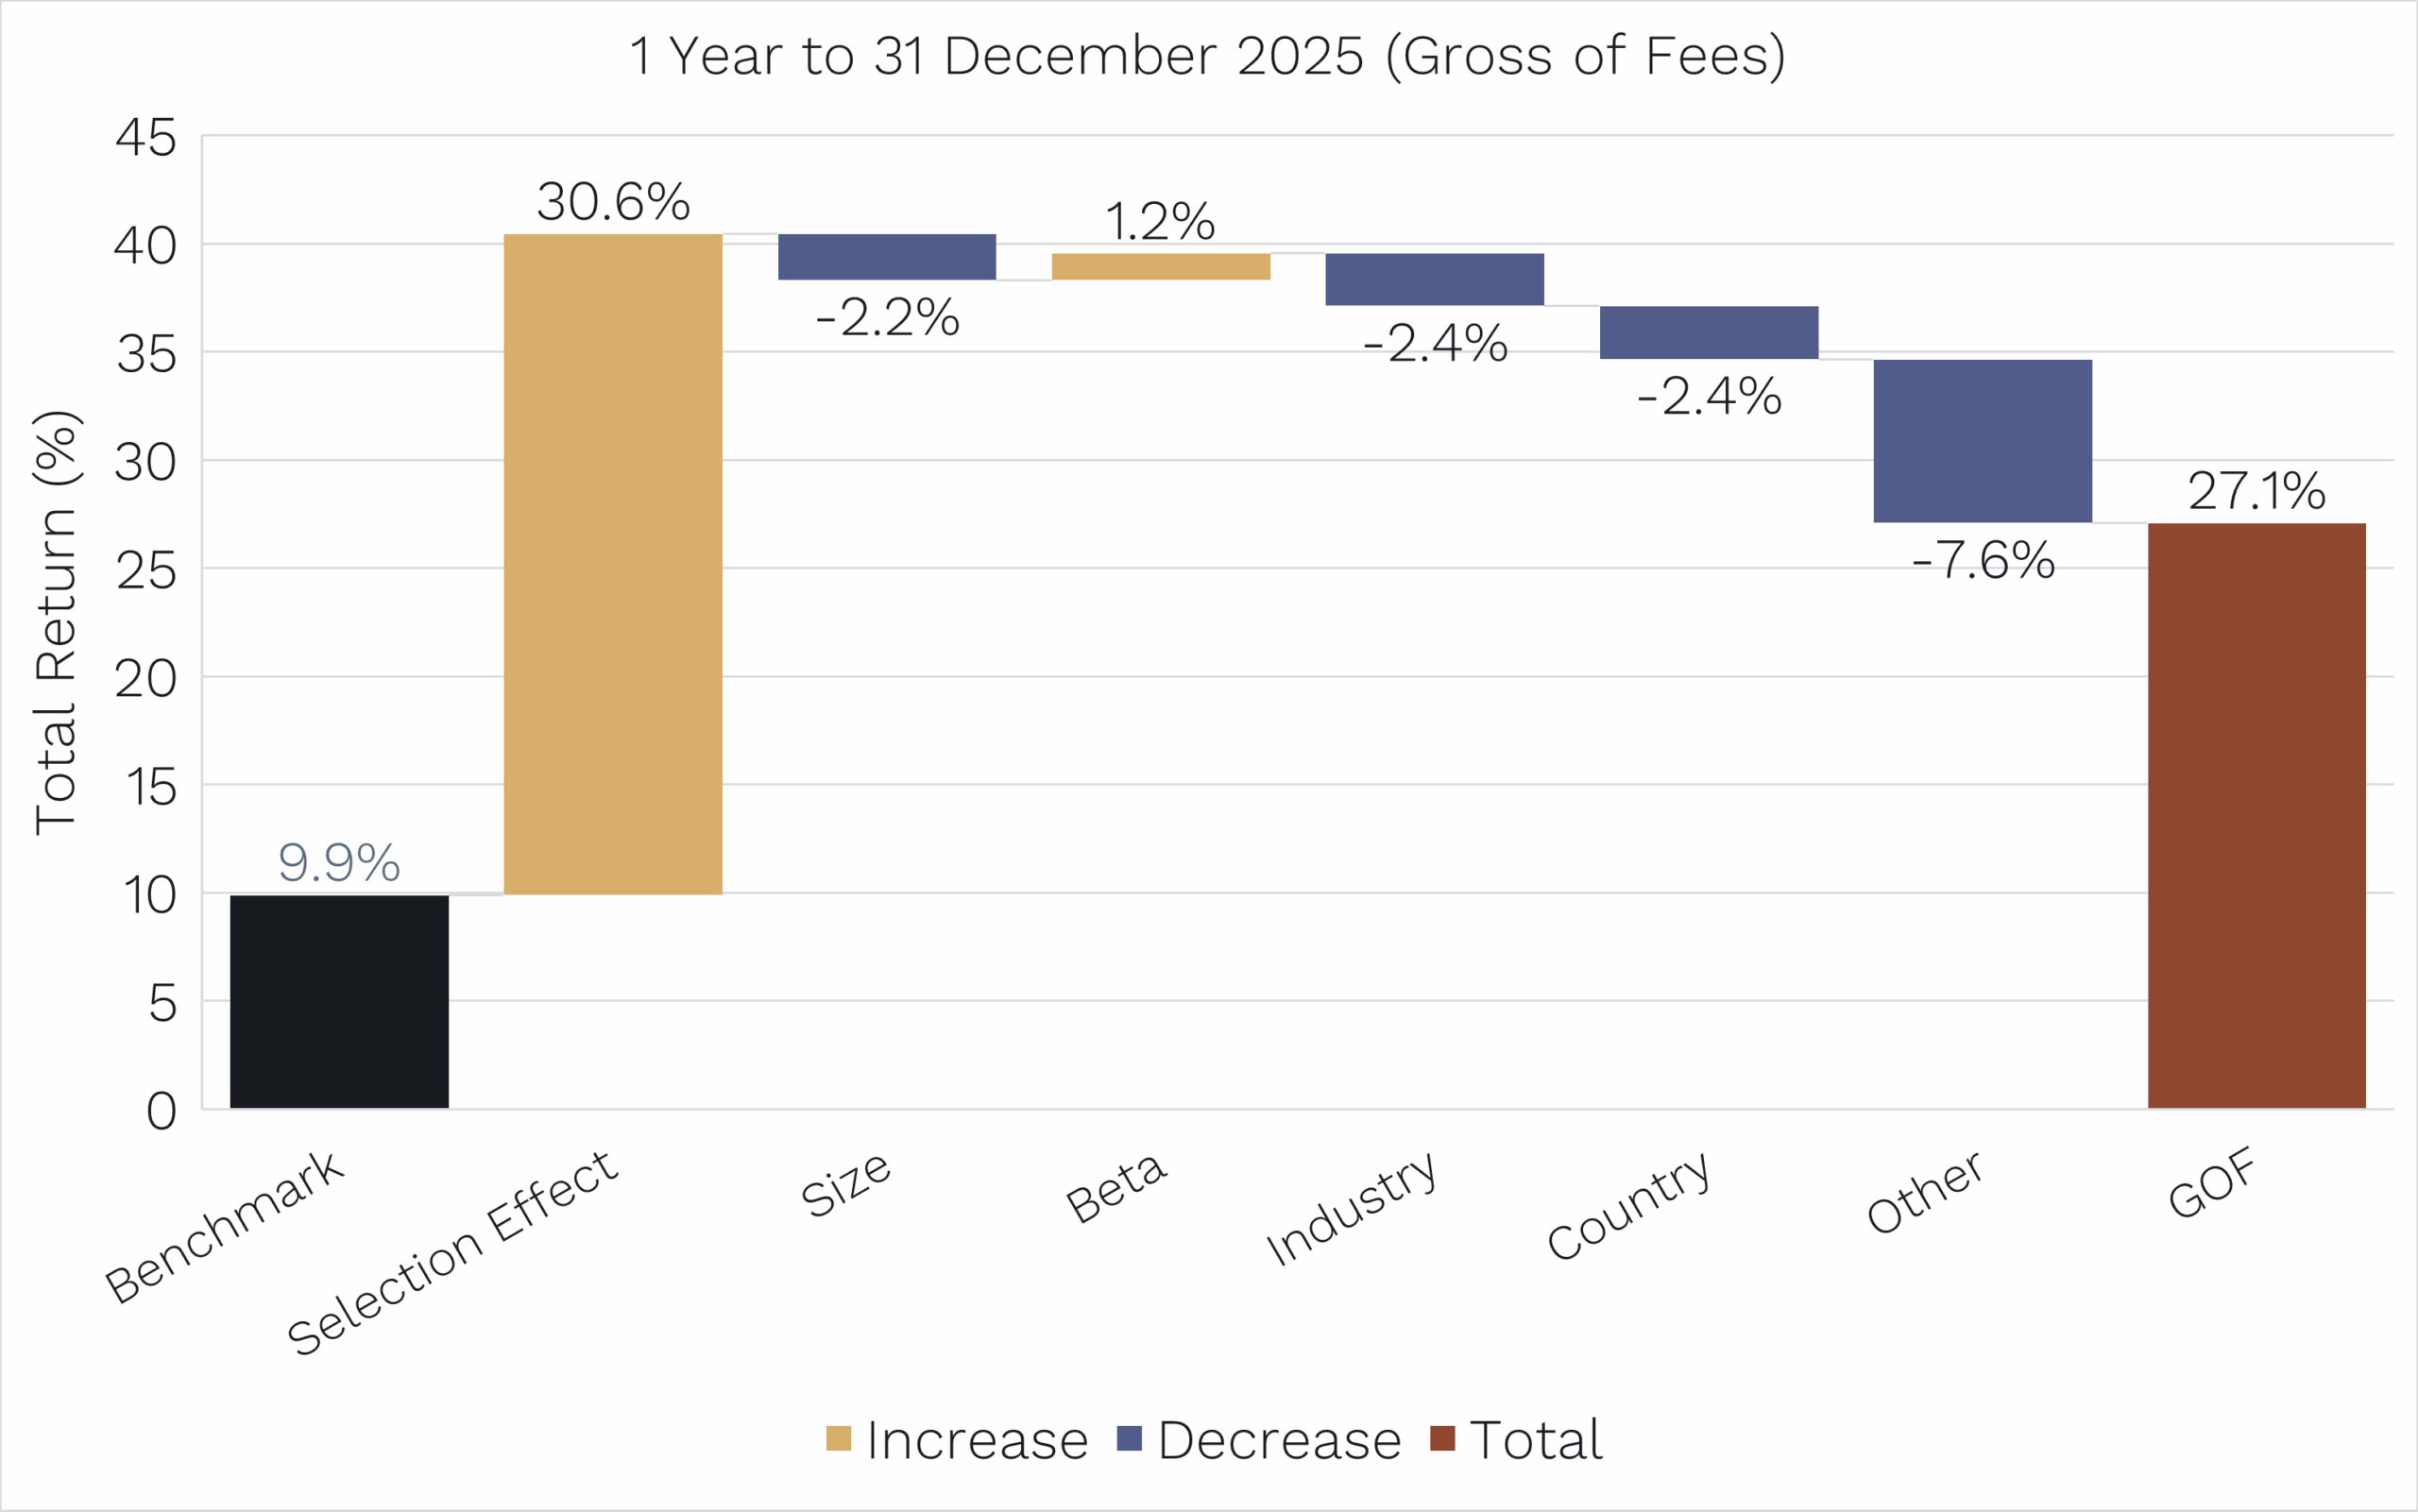
Enter the multi-factor performance attribution we have been sharing with investors over the last few years. In 2025, our Global Opportunities Fund returned +27.1% before fees (+25.6% after fees) compared with its benchmark, the MSCI World SMID Cap Net Return Index (in AUD) which returned +9.9%.
Global Opportunities Fund: Multi Factor Attribution
Source: Ophir, Bloomberg, Citi. Past performance is not a reliable indicator of future performance.
Crucially, this outperformance was not driven by tailwinds from industry or country skews, nor by a bias towards small companies relative to the benchmark. In fact, all of the typical factors or characteristics monitored by our performance attribution software detracted from returns in aggregate.
Instead, “Selection Effect” or stock-picking, accounted for more than 100% of the outperformance, contributing +30.6% of the +17.2% excess return.
As regular readers will know, this is great news.
It confirms that our bottom-up due diligence is doing the heavy lifting, rather than returns being boosted by unintended factor exposures or “free kicks”.
Another stand out feature of the Global Opportunities Fund’s performance in 2025 was how it behaved in both rising and falling markets.
While the return profile remained consistent with our long term style, it was even better than usual.
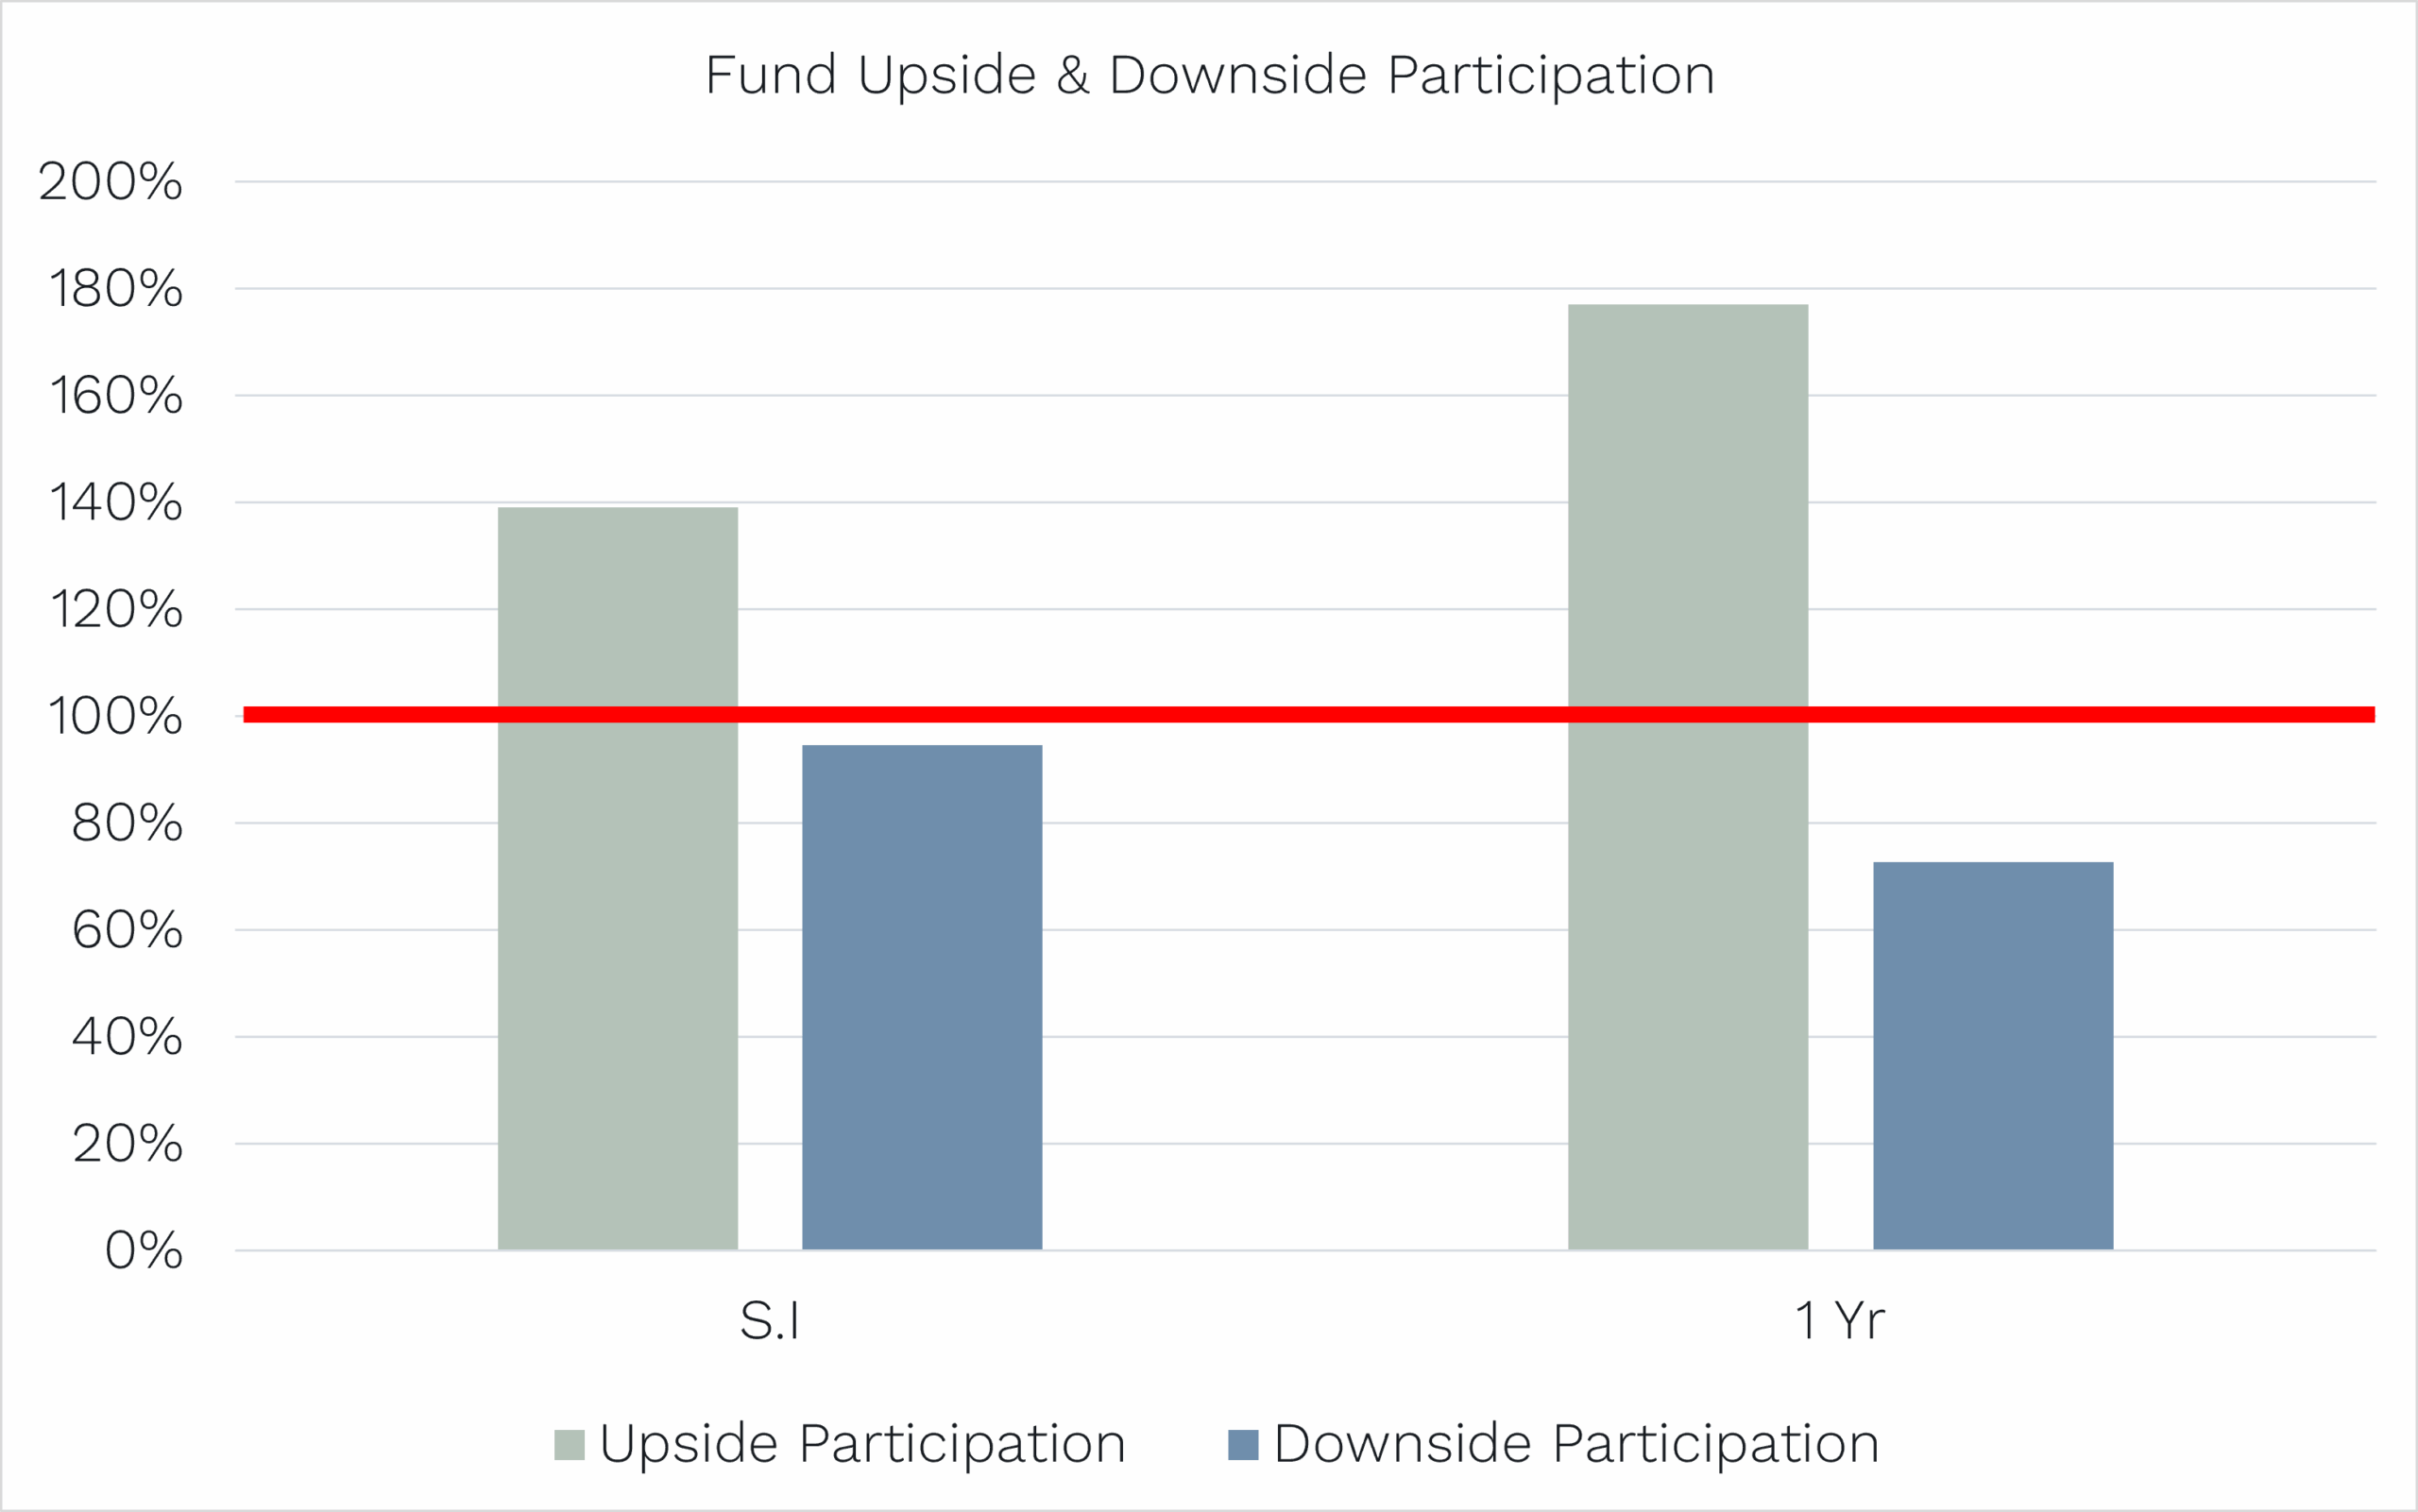
As shown below, since inception “S.I” (October 2018), in months when the benchmark has risen, the fund has delivered, on average, around 140% of the benchmark’s return.
For example, if the benchmark rose by +1.0% in a month, the fund rose by around +1.4% on average. This highlights our tendency to outperform in rising markets.
Global Opportunities Fund: Outperforming in up markets & protecting capital in down markets
Source: Ophir, Citi. Past performance is not a reliable indicator of future performance.
On the flip side, in months when the market has fallen, the fund was down only around 95% of the benchmark on average.
Or for example, if the benchmark fell -1% in a month, we fall around -0.95% on average. This means, on average, we fall less in down markets.
The key takeaway here is that we generally outperform by more in up markets than we tend to outperform in down markets, while still delivering outperformance across both environments. This characteristic is shared across all Ophir funds.
In 2025, this profile was even more favourable. The Global Opportunities Fund captured almost 180% of the upside, well above the long term average of 140%. On the downside, it fell only 73% of the market on average, compared with the long term average of 95%.
The result was a smoother and more attractive experience for investors over the year, something we continually seek to improve.
And finally, on the topic of investor experience, we want to highlight progress in an important statistic called “Tracking Error“, a statistic closely watched by sophisticated institutional allocators, such as large superannuation and pension funds, which has almost halved over recent years – a great thing!
What is tracking error? Put simply, it measures the volatility of a fund’s monthly outperformance or underperformance relative to its benchmark.
For example, in December the Global Opportunities Fund (Class A) returned +1.6% compared with a benchmark return of -0.8%, meaning an outperformance of +2.4%. Tracking error measures how consistent or variable those monthly relative returns are over time [1].
Clearly investors want outperformance, but they also want that outperformance to be delivered consistently. More stable relative returns are generally viewed as more reliable than returns driven by a small number of exceptional months.
Looking at the rolling one-year returns for the Global Opportunities Fund, the volatility of relative performance (1 year tracking error) has fallen sharply to around 6 to 7% per annum, compared with around 12% per annum in the early years of the fund.
Importantly, this improvement has not come at the expense of returns.
Over the past three years, the fund has outperformed its benchmark by +10.9% per annum after fees, delivering +26.0% per annum versus +15.1% per annum. Since inception in 2018, outperformance has averaged +9.4% per annum after fees, with returns of +18.5% per annum versus the benchmark’s +9.1% per annum.
More outperformance, delivered more smoothly. That’s something every investor wants.
Global Opportunities Fund: Volatility of out/underperformance almost halved
![]()
Source: Ophir, Citi. Past performance is not a reliable indicator of future performance.
The Missing Ingredient: Earnings
There is no shortage of geopolitical risks for investors to digest, from ICE raids in Minnesota, to the toppling of a dictator in Venezuela, and the prospect of military action involving Iran and Greenland, to name just a few.
From an economic perspective, however, particularly in the U.S. as the world’s primary growth engine, there are several positives supporting ongoing equity market strength:
- The lagged effect of Fed interest rate cuts with the potential for more to come;
- Falling oil prices which effectively act as a tax cut for consumers;
- Large tax refunds flowing to U.S. households, alongside accelerated depreciation for capex and R&D expenditure under Trump’s One Big Beautiful Bill;
- Ongoing deregulation, with the likelihood of further stimulus and affordability measures ahead of the U.S. mid term elections in November.
Together, these factors have recently driven outperformance in more cyclical areas of the U.S. share market, such as transport, housing and manufacturing, helping broaden market participation beyond a narrow group of stocks.
Since the rates induced sell-off in equity markets in late 2021, small caps, one of the more cyclical and risk sensitive segments of the market, have underperformed.
This is illustrated in the chart below, where the red line shows the Russell 2000 (U.S. small caps) divided by the S&P 500 (U.S. large caps). It’s been heading south for a LONG time which highlights prolonged small cap underperformance relative to large caps.
While there have been brief rallies lasting days or weeks linked to hopes for lower inflation or interest rates, these moves have not been sustained.
What has been missing is the key catalyst investors expect lower rates to deliver: earnings growth. The gold line in the chart shows small cap earnings expectations relative to large caps over the next twelve months.
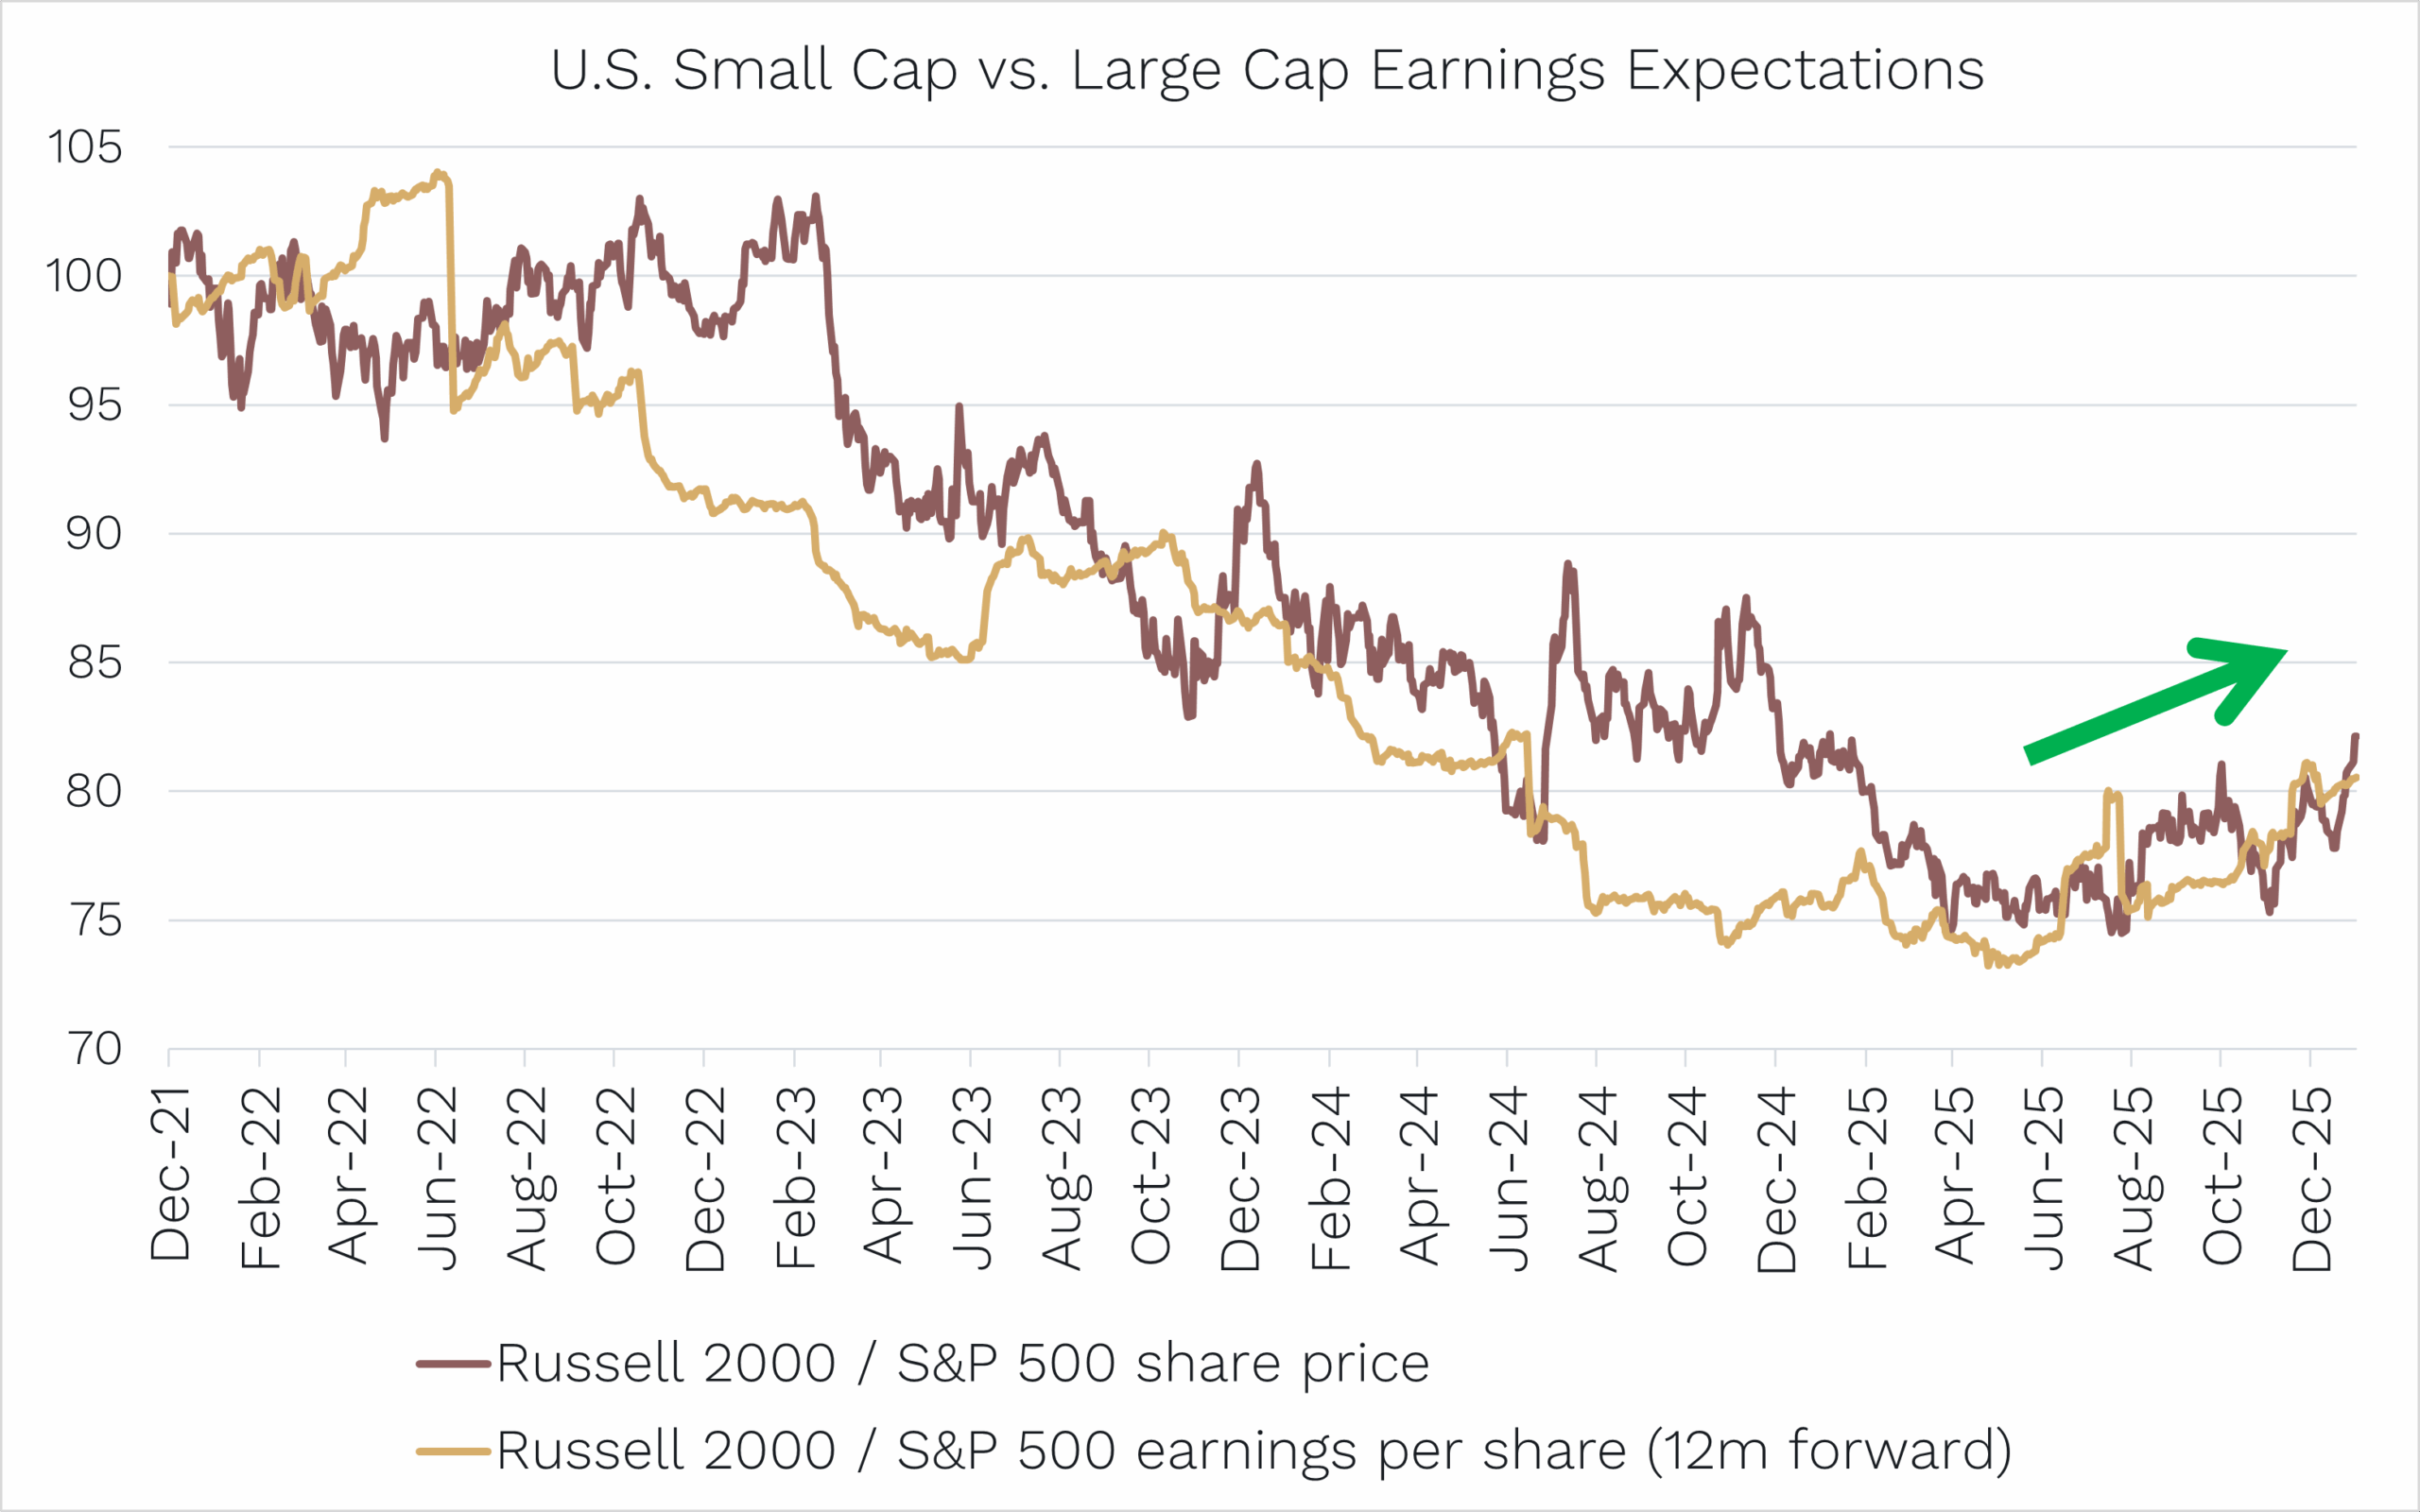
Source: Bloomberg. Indices indexed to 100.
As with individual stocks, earnings are the primary long term driver of index performance. From 2022 through to mid 2025, small cap underperformance closely mirrored their relative earnings underperformance.
There is now compelling evidence that this is changing.
When combined with improving momentum in early cycle sectors, a supportive economic backdrop and broader market participation, this emerging earnings outperformance represents the final ingredient needed to support sustained small cap outperformance.
It has been a long wait, but as small cap specialists, we believe this shift sets up a favourable tailwind for the asset class in 2026 and beyond, and ultimately for the Ophir funds.
[1] Technically tracking error is calculated as the standard deviation (volatility) of monthly out or underperformance.
As always, if you’d like to chat to us about any of the Funds, please feel free to call us on (02) 8188 0397 or email us at ophir@ophiram.com.
Thank you for entrusting your capital with us.
Kindest regards,


Andrew Mitchell & Steven Ng
Co-Founders & Senior Portfolio Managers
Ophir Asset Management
This document has been prepared by Ophir Asset Management Pty Ltd (ABN 88 156 146 717, AFSL 420082) (“Ophir”) and contains information about one or more managed investment schemes managed by Ophir (the “Funds”) as at the date of this document. The Trust Company (RE Services) Limited ABN 45 003 278 831, the responsible entity of, and issuer of units in, the Ophir High Conviction Fund (ASX: OPH), the Ophir Global Opportunities Fund and the Ophir Global High Conviction Fund. Ophir is the trustee and issuer of the Ophir Opportunities Fund.
This is general information only and is not intended to provide you with financial advice and does not consider your investment objectives, financial situation or particular needs. You should consider your own investment objectives, financial situation and particular needs before acting upon any information provided and consider seeking advice from a financial advisor if necessary. Before making an investment decision, you should read the relevant Product Disclosure Statement (“PDS”) and Target Market Determination (“TMD”) available at www.ophiram.com or by emailing Ophir at ophir@ophiram.com. The PDS does not constitute a direct or indirect offer of securities in the US to any US person as defined in Regulation S under the Securities Act of 1993 as amended (US Securities Act).
All Ophir Funds are deemed high risk within their respective Target Market Determination documentation. Ophir does not guarantee the performance of the Funds or return of capital. An investment may achieve a lower than expected return and investors risk losing some or all of their principal investment. Past performance is not a reliable indicator of future performance. Any opinions, forecasts, estimates or projections reflect our judgment at the date of this was prepared, and are subject to change without notice. Rates of return cannot be guaranteed and any forecasts, estimates or projections as to future returns should not be relied on, as they are based on assumptions which may or may not ultimately be correct.
Actual returns could differ significantly from any forecasts, estimates or projections provided.
The Trust Company (RE Services) Limited is a part of the Perpetual group of companies. No company in the Perpetual Group (Perpetual Limited ABN 86 000 431 827 and its subsidiaries) guarantees the performance of any fund or the return of an investor’s capital.