An all-time month for Ophir’s flagship Funds in April
In this Letter to Investors, we look at:
- The big reason the U.S. market keeps charging higher despite the Iran war remaining unresolved.
- The pleasing explanation for why our Global Opportunities Fund had its best month ever.
- Our flagship Global and Aussie small-cap Funds topping the leaderboards in April.
- The potential for a ‘soft close’ of our Global Opportunities Fund to help optimise our ability to generate returns.
- The hot industry sector in the AI thematic that has killed it over the last year, including a stock up a massive 2,939%.
- Why we don’t need big skews to risky ‘hot themes’ to drive our strong performance.
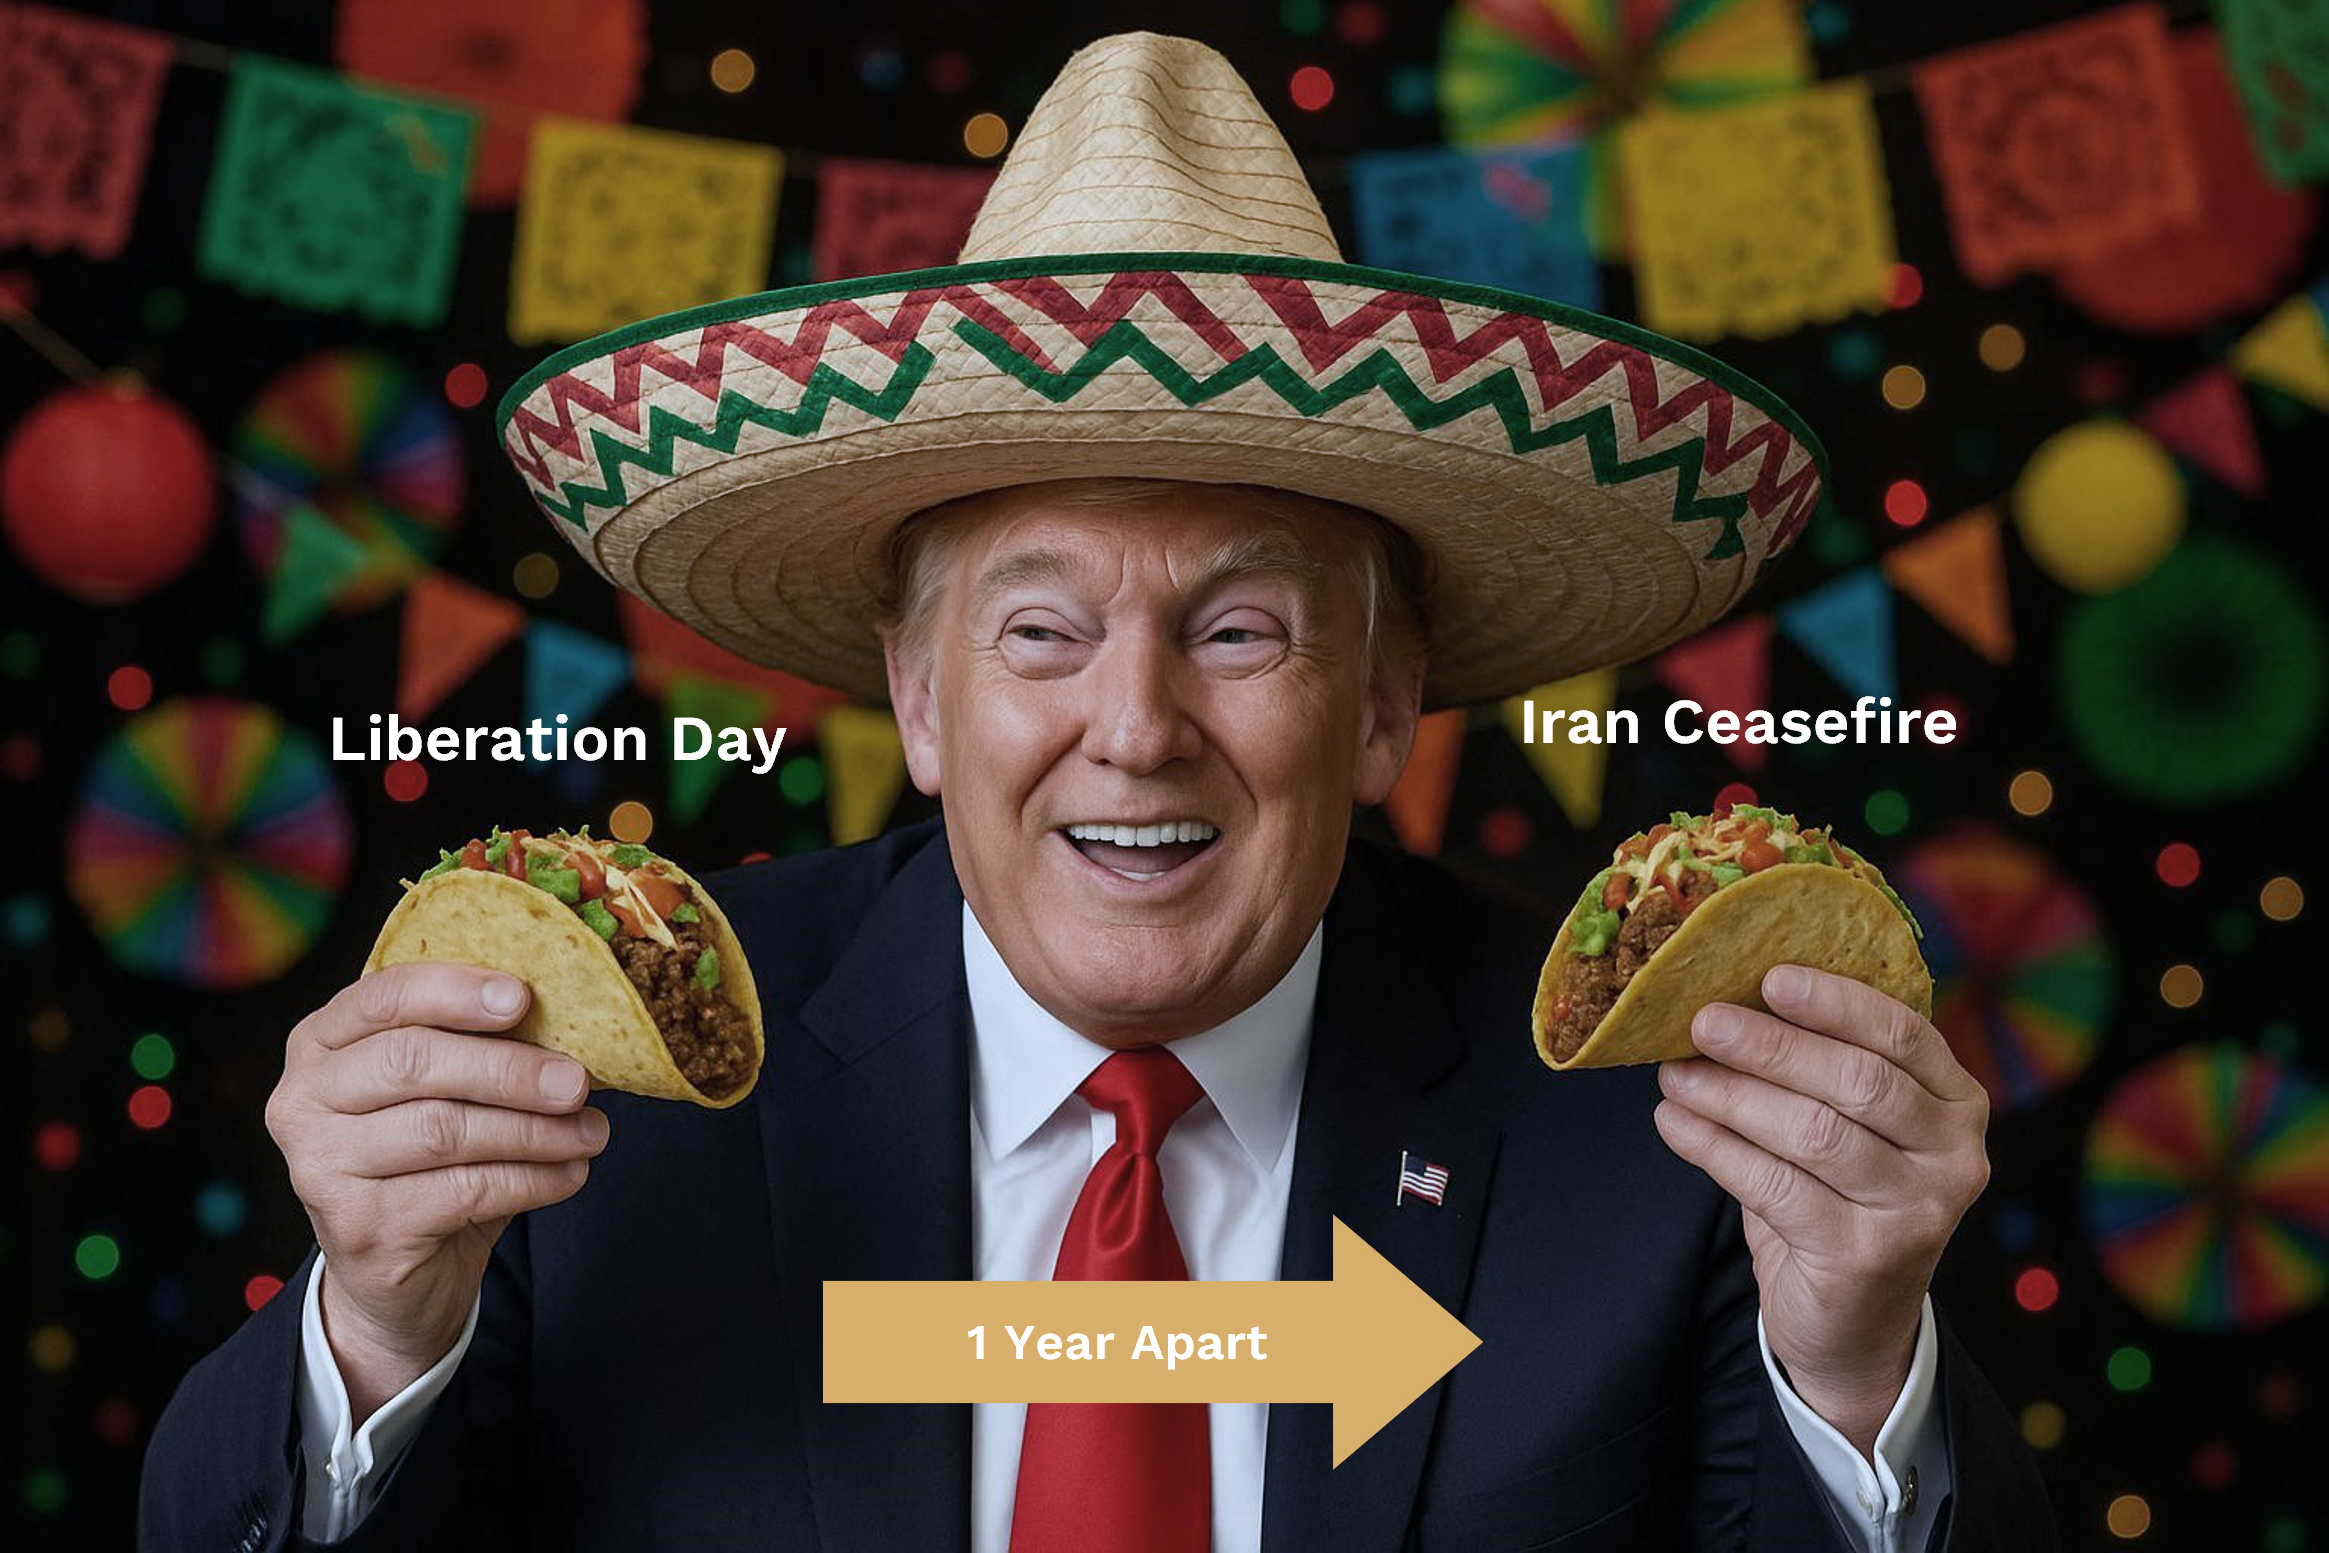
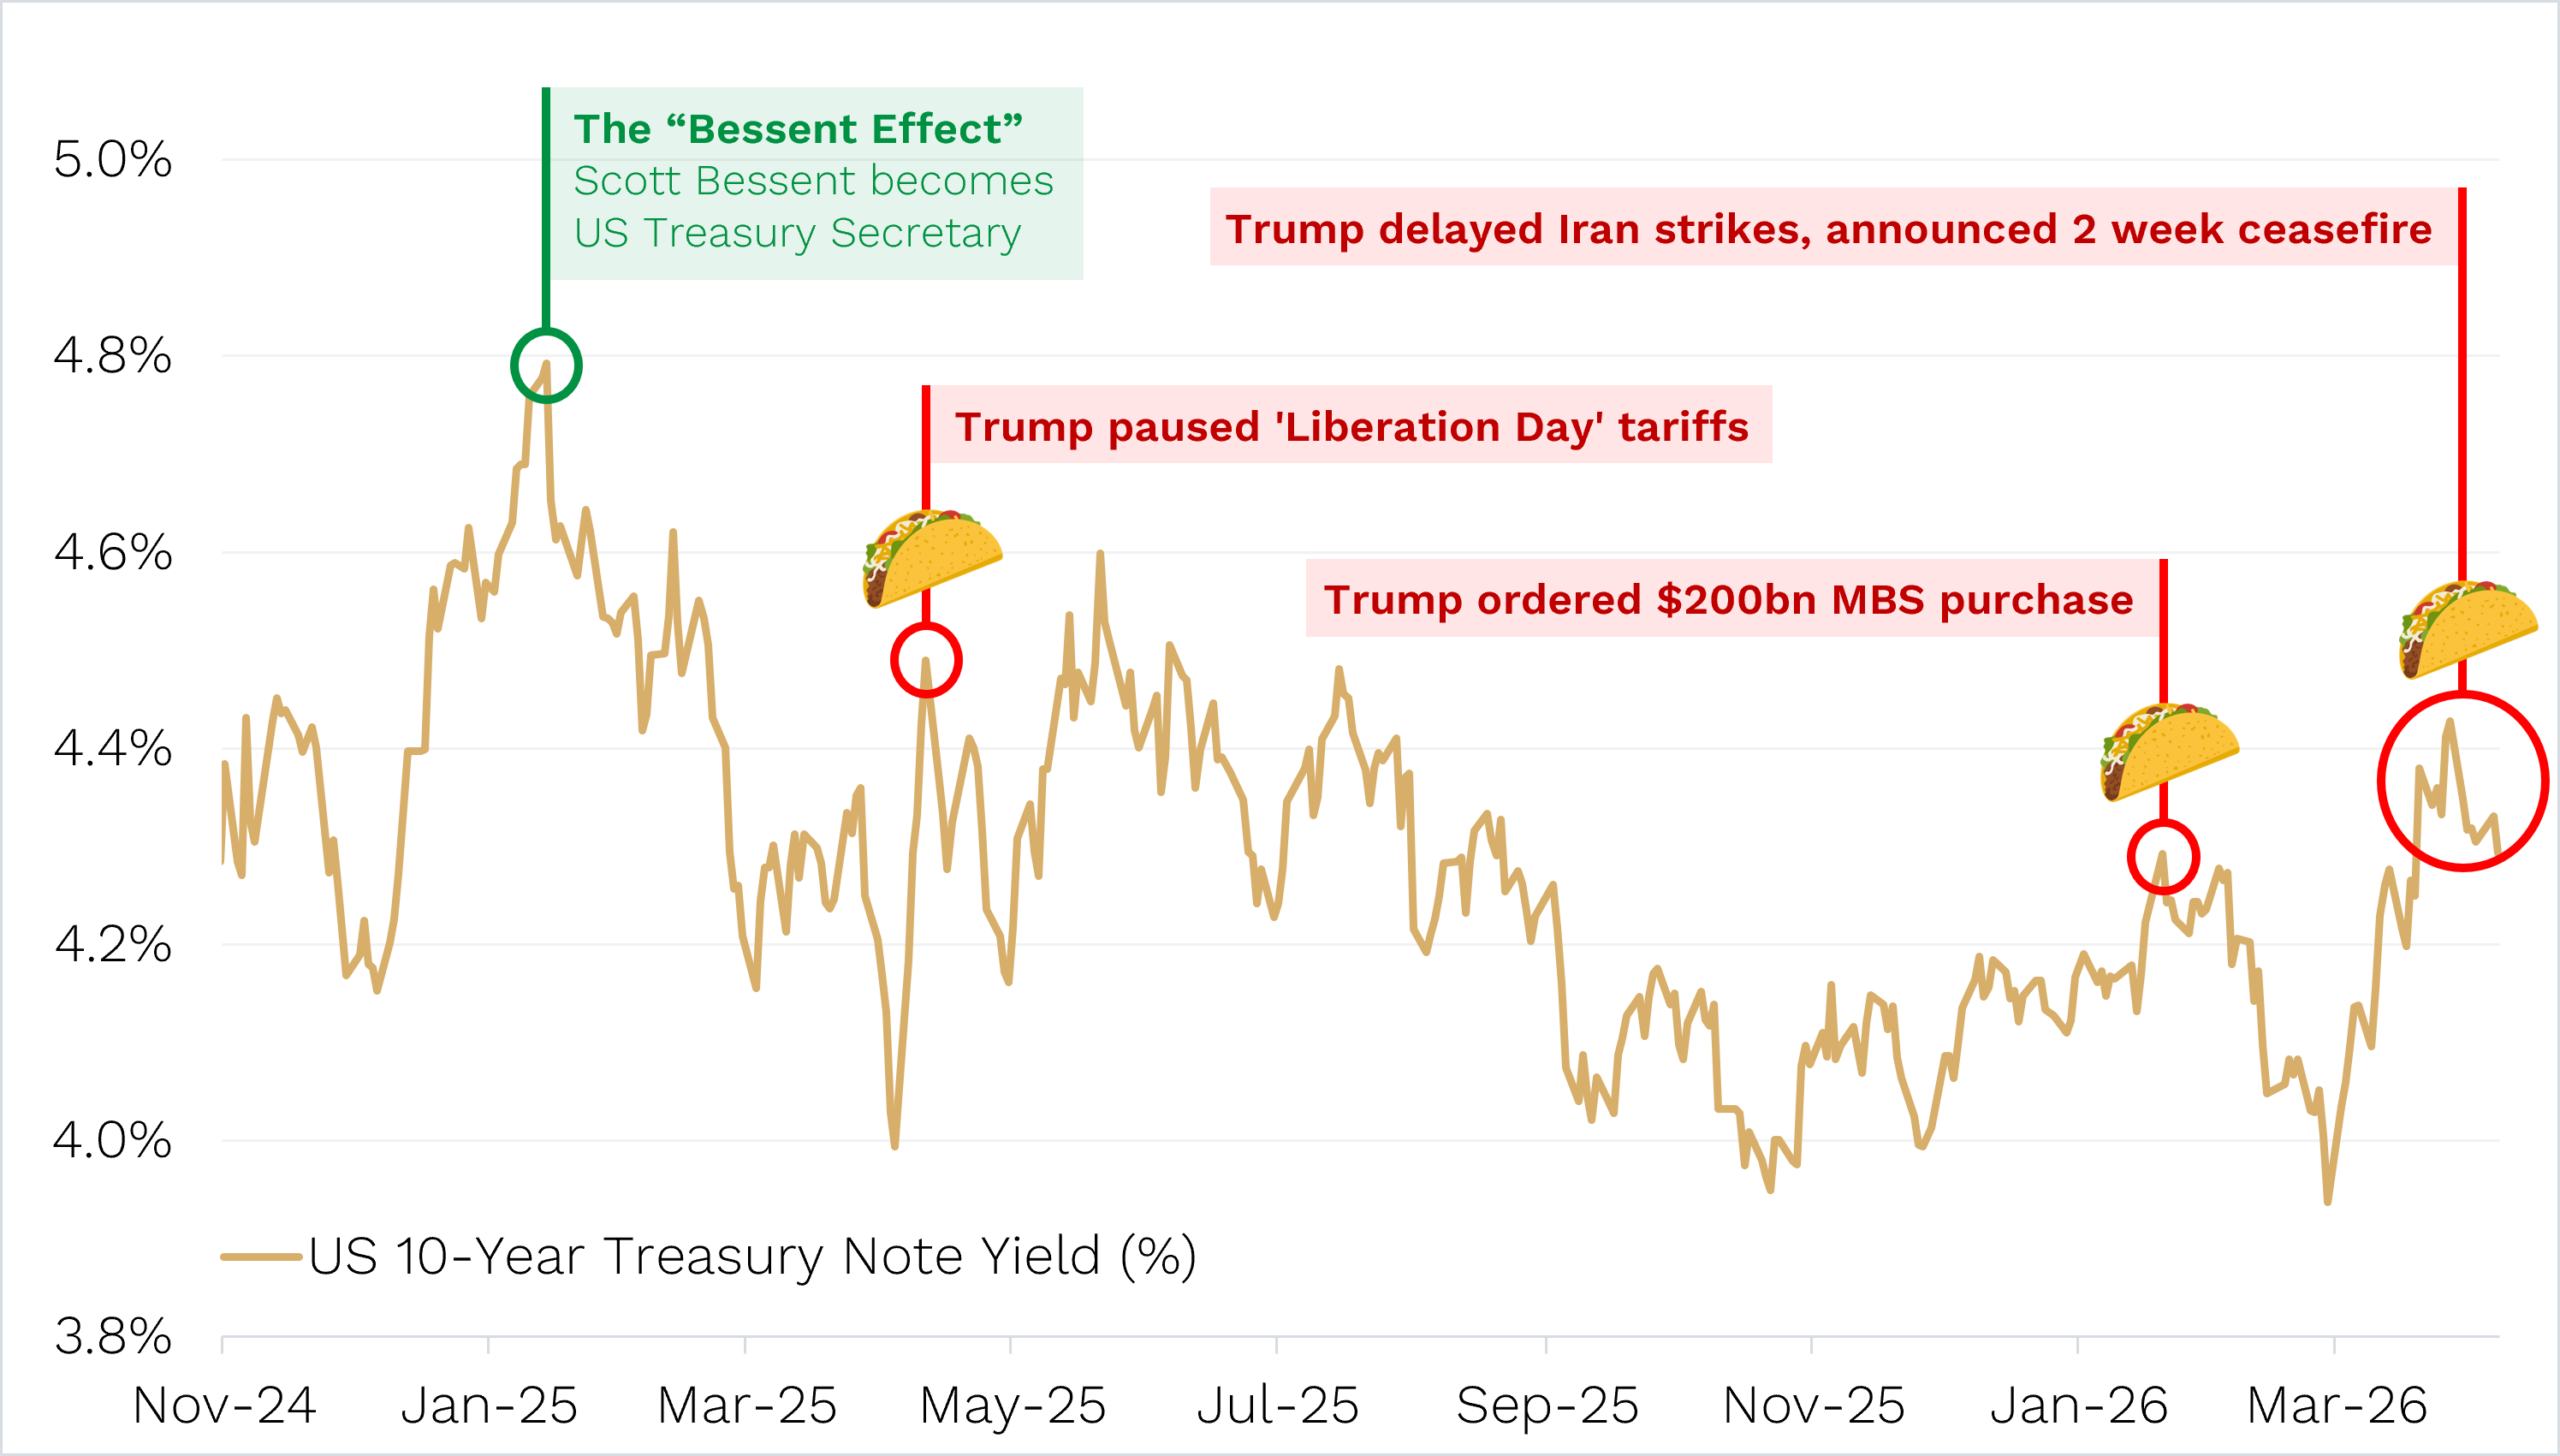
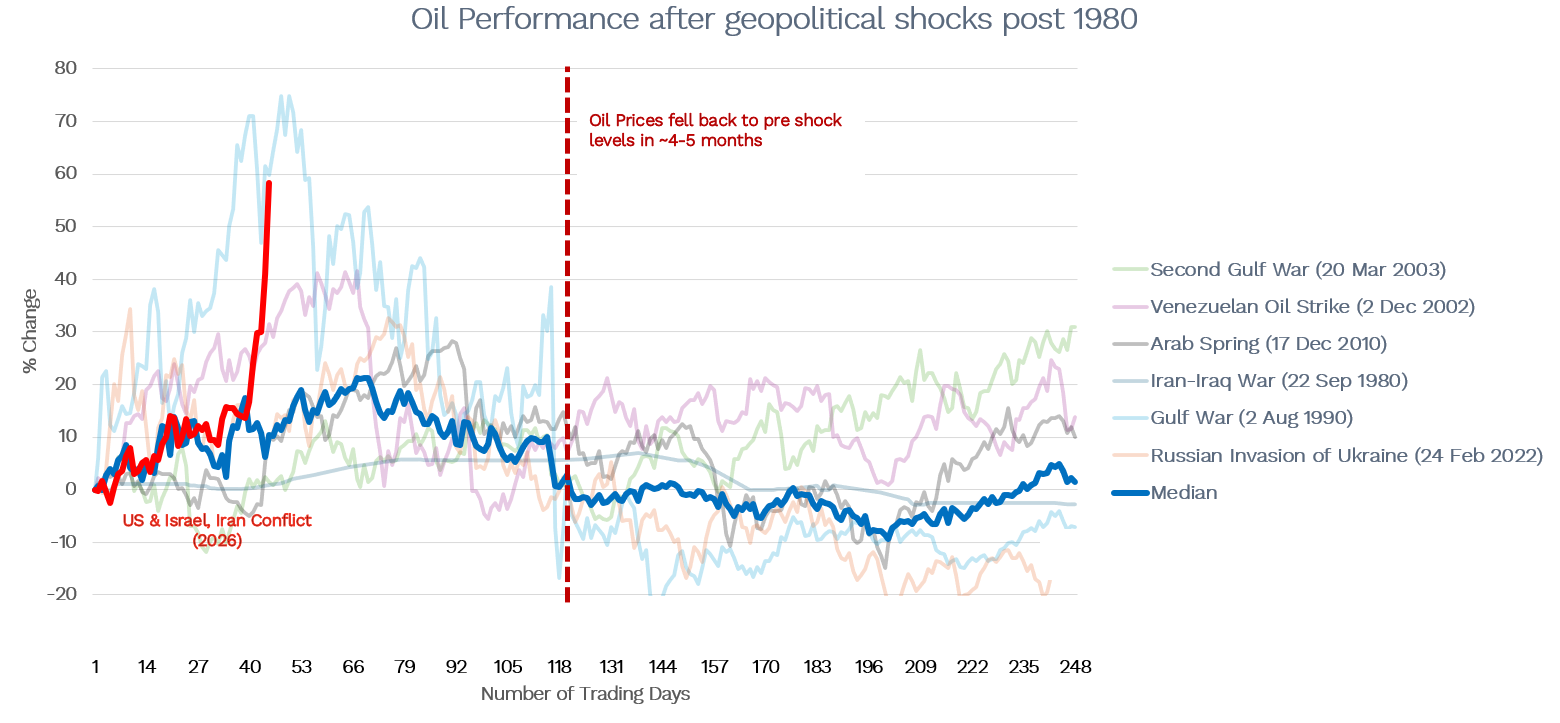
The outbreak of the Iran war triggered an ‘every equity market down month’ in March. But then in April we saw an almost universal relief rally in markets as investors got more comfortable that there was likely to be a de-escalation in military hostilities.
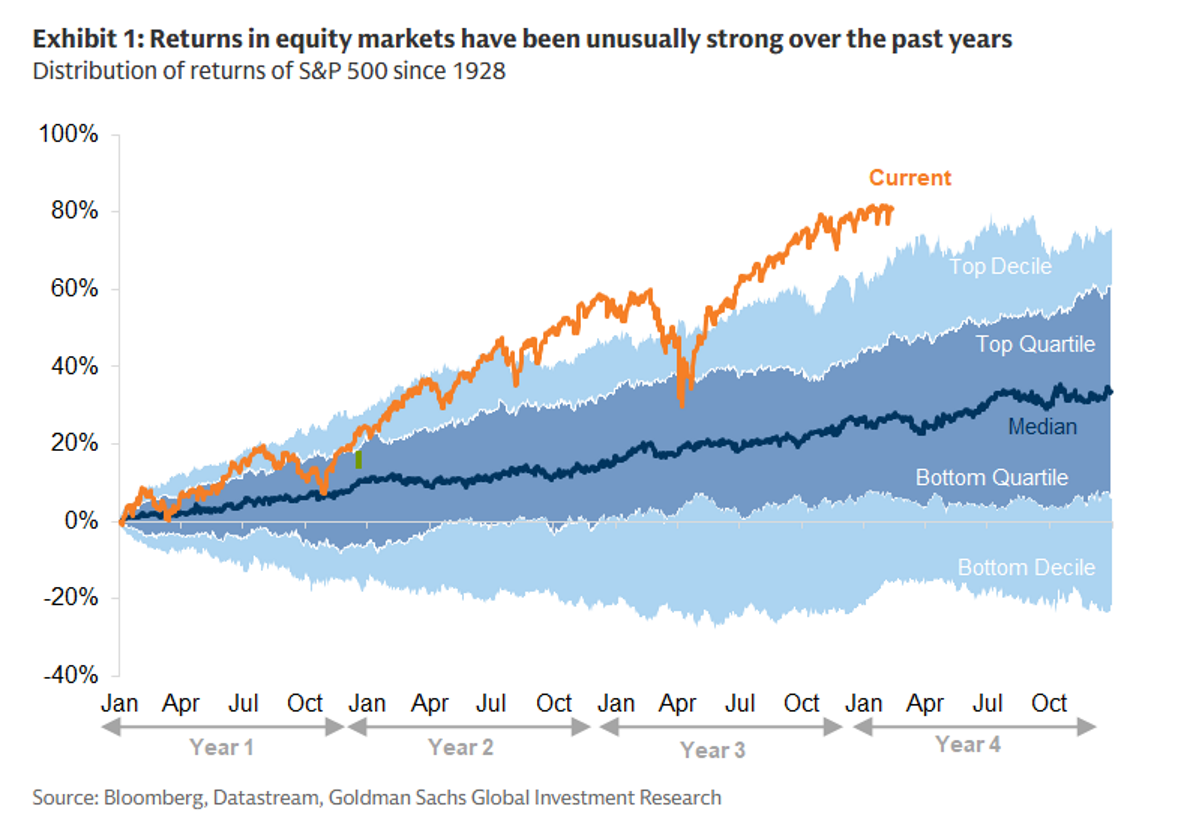
During the month, the S&P 500 ripped +10.5% to new all-time highs. Domestically, however, the RBA’s continued hiking led to a relatively muted +2.2% gain for the ASX 200.
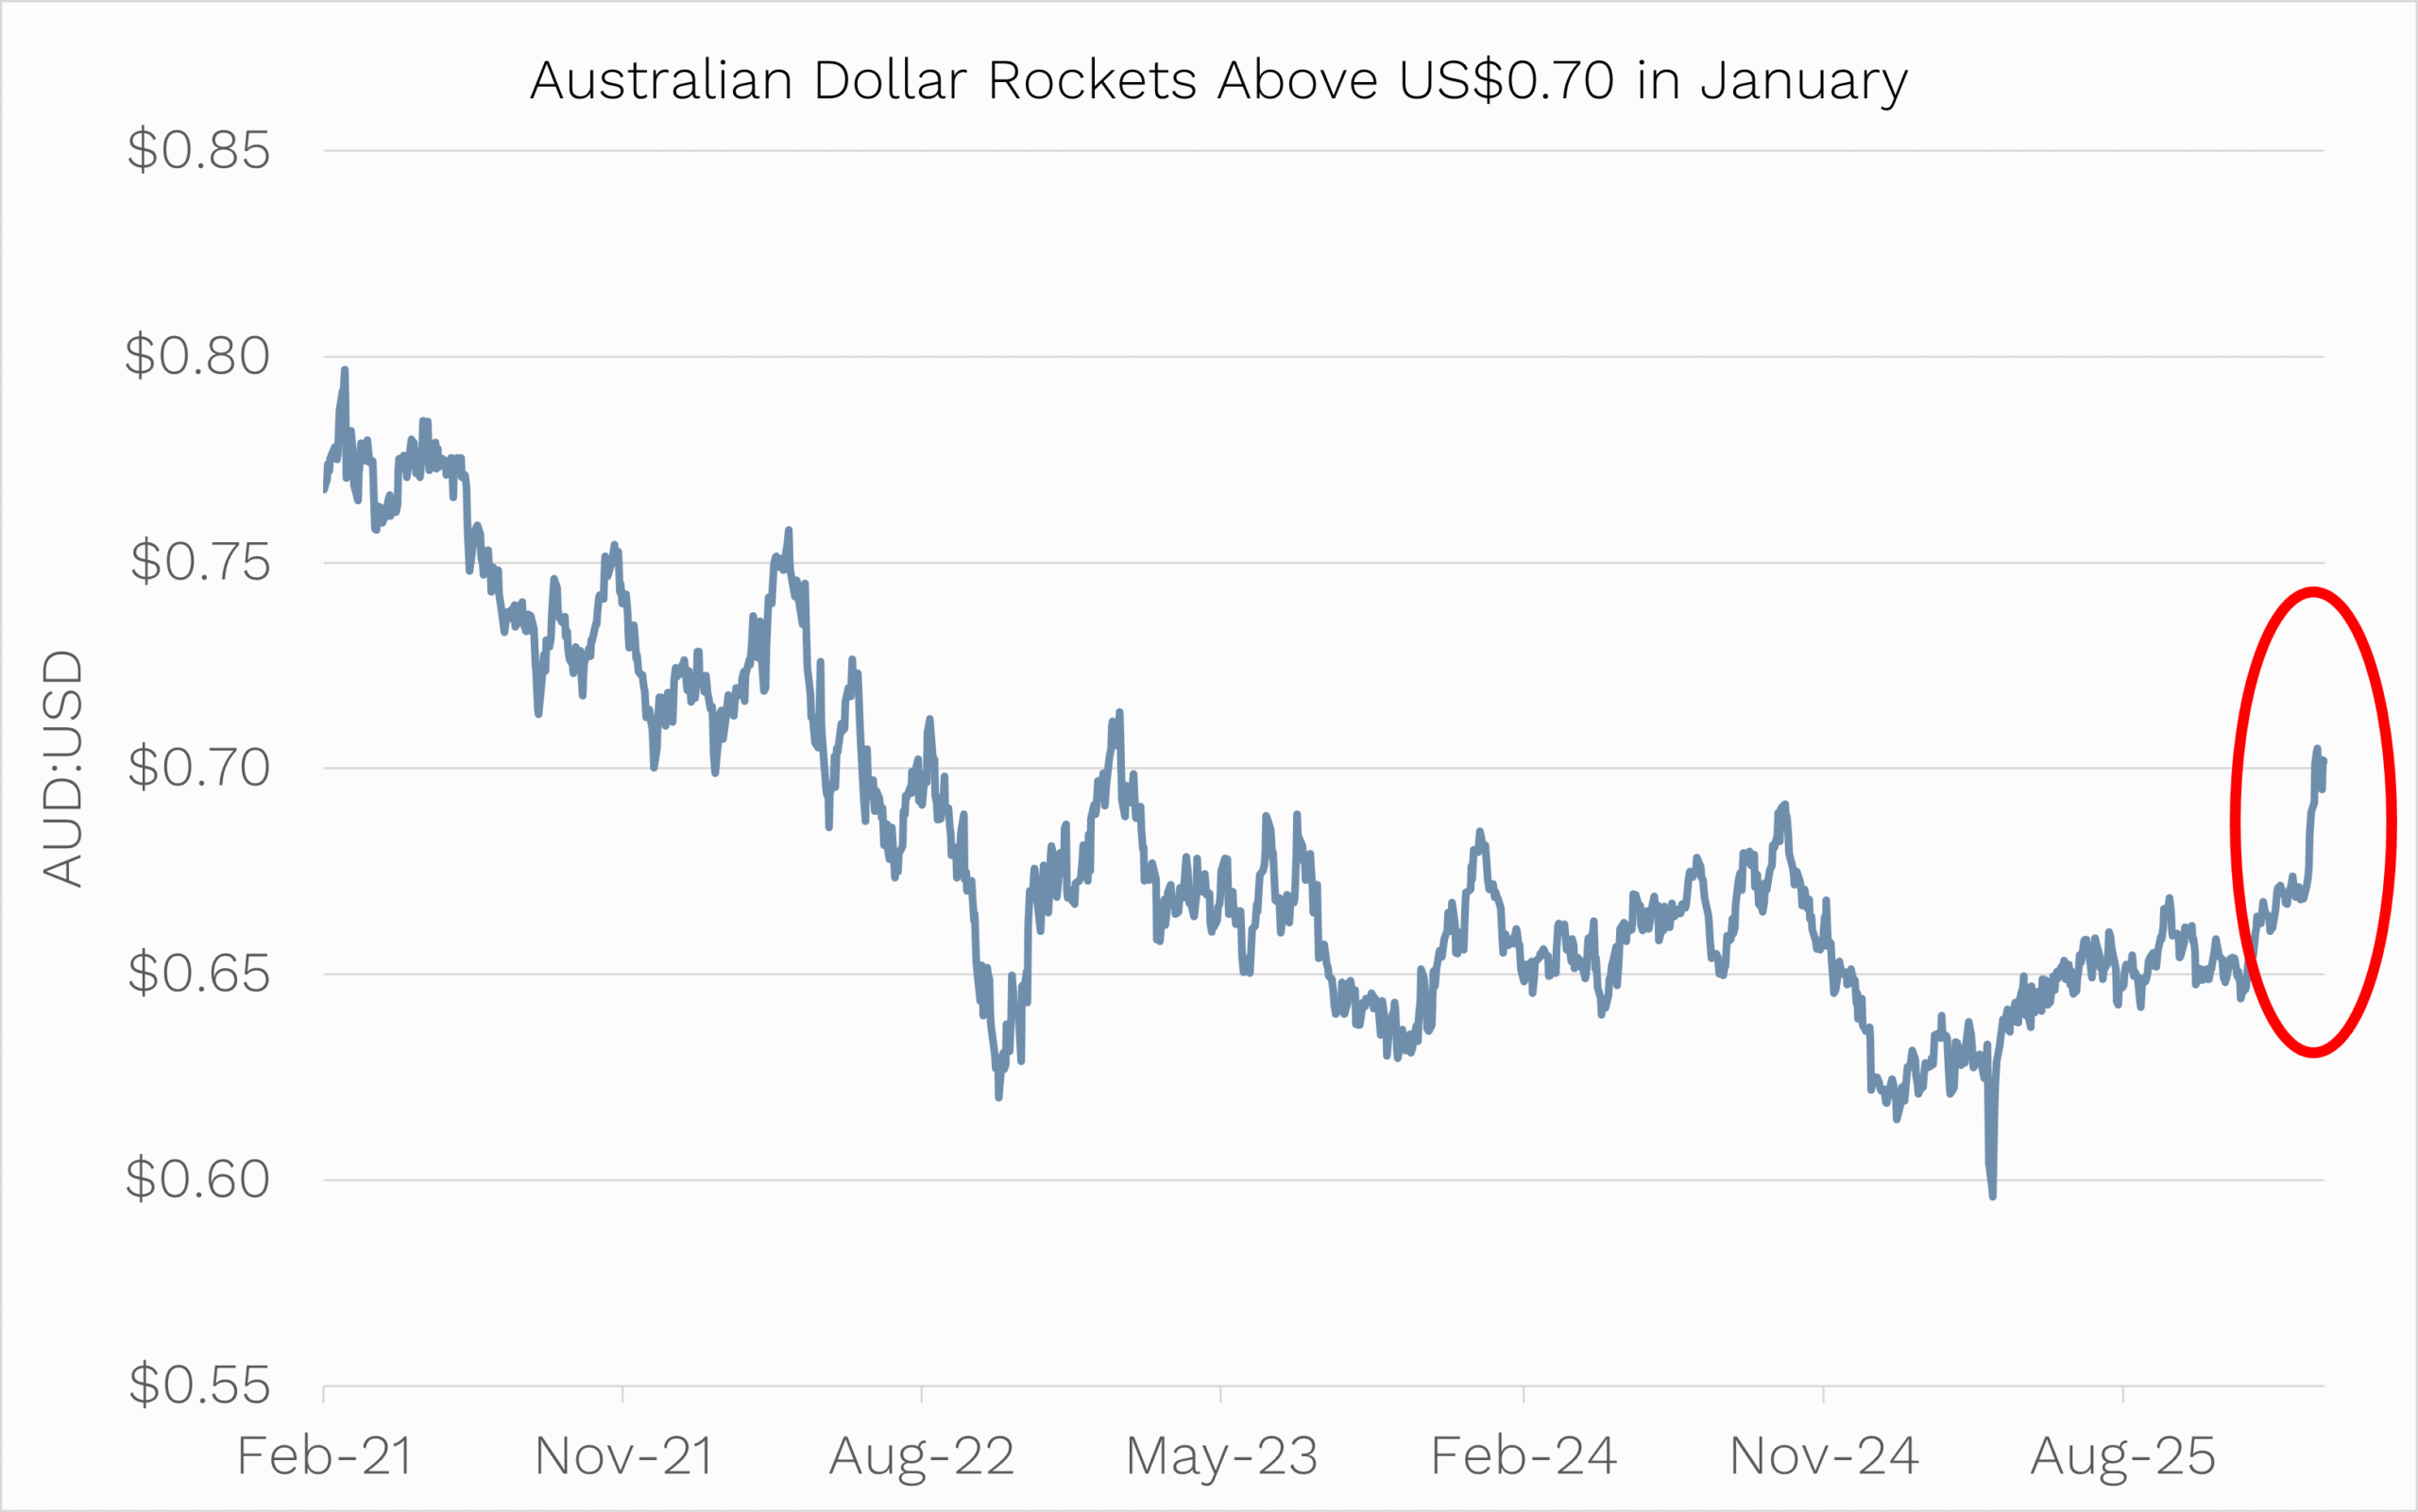
A hawkish RBA also saw the Australian dollar jump +4.4% versus the U.S. dollar, which trimmed offshore gains for unhedged Aussie investors. Global equities (MSCI World Index) were up +9.6% in U.S. dollar terms in April. But in Australian dollar terms gains were almost cut in half to +5.1%.[1]
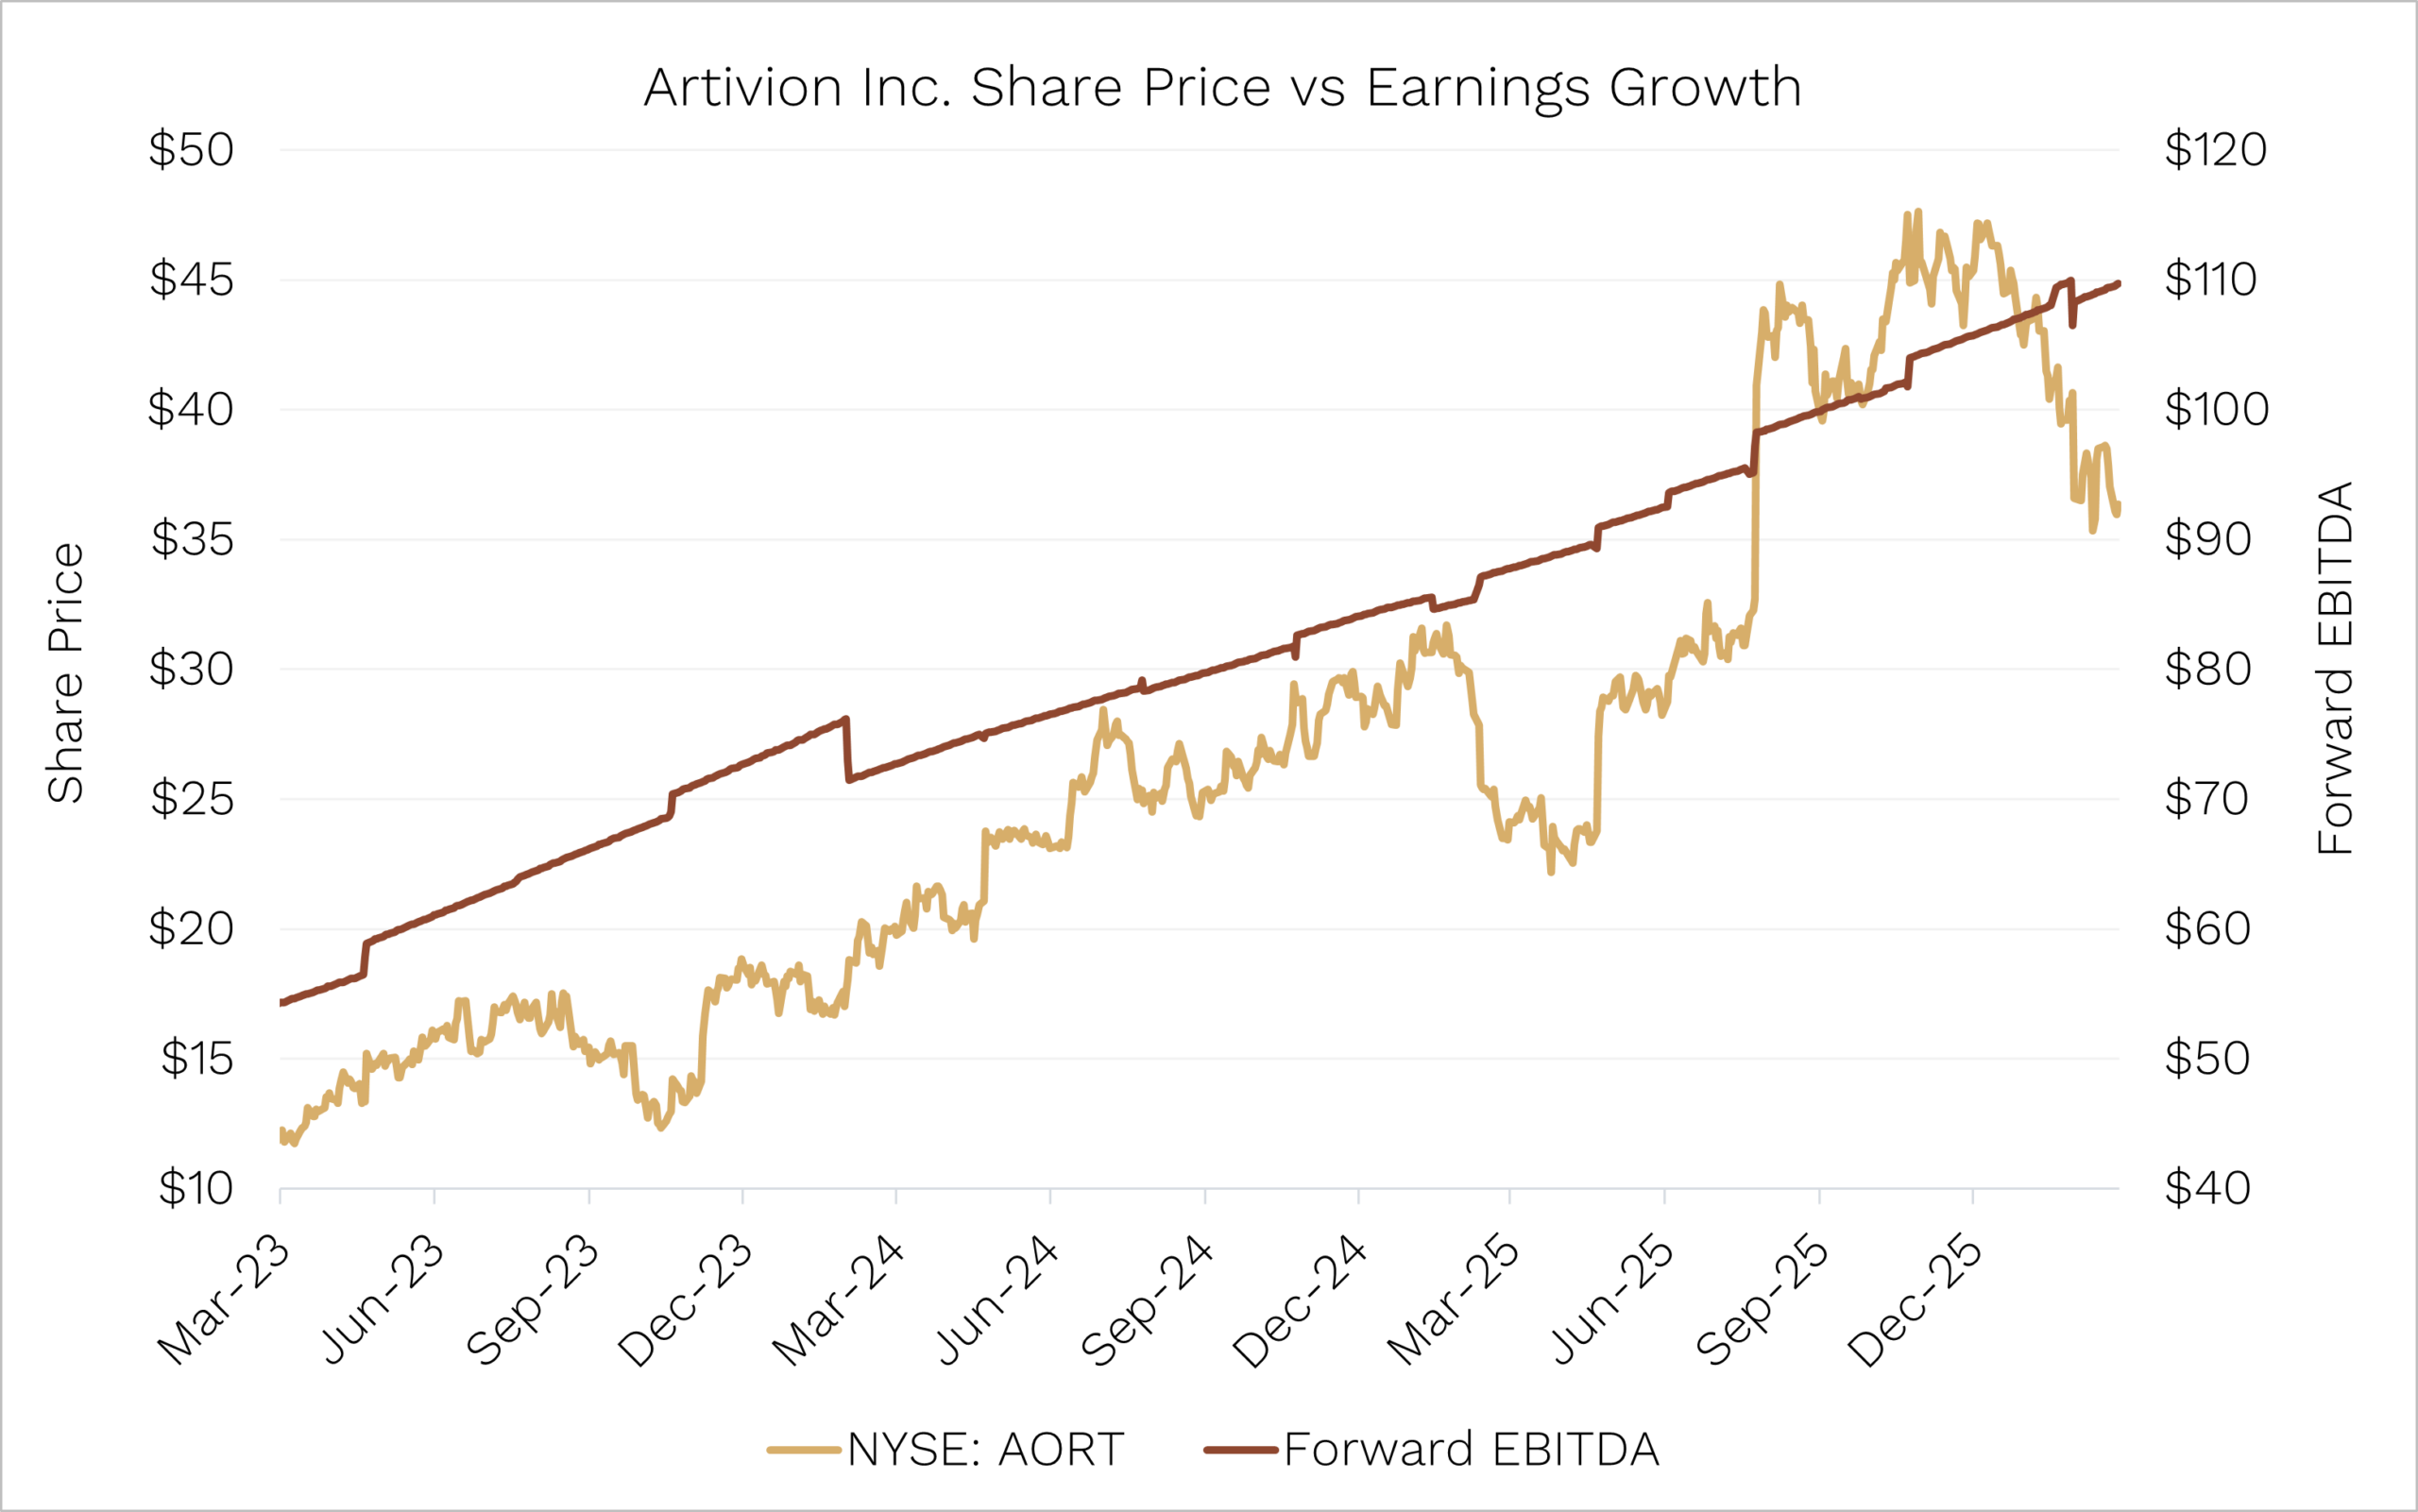
It’s earnings, stupid
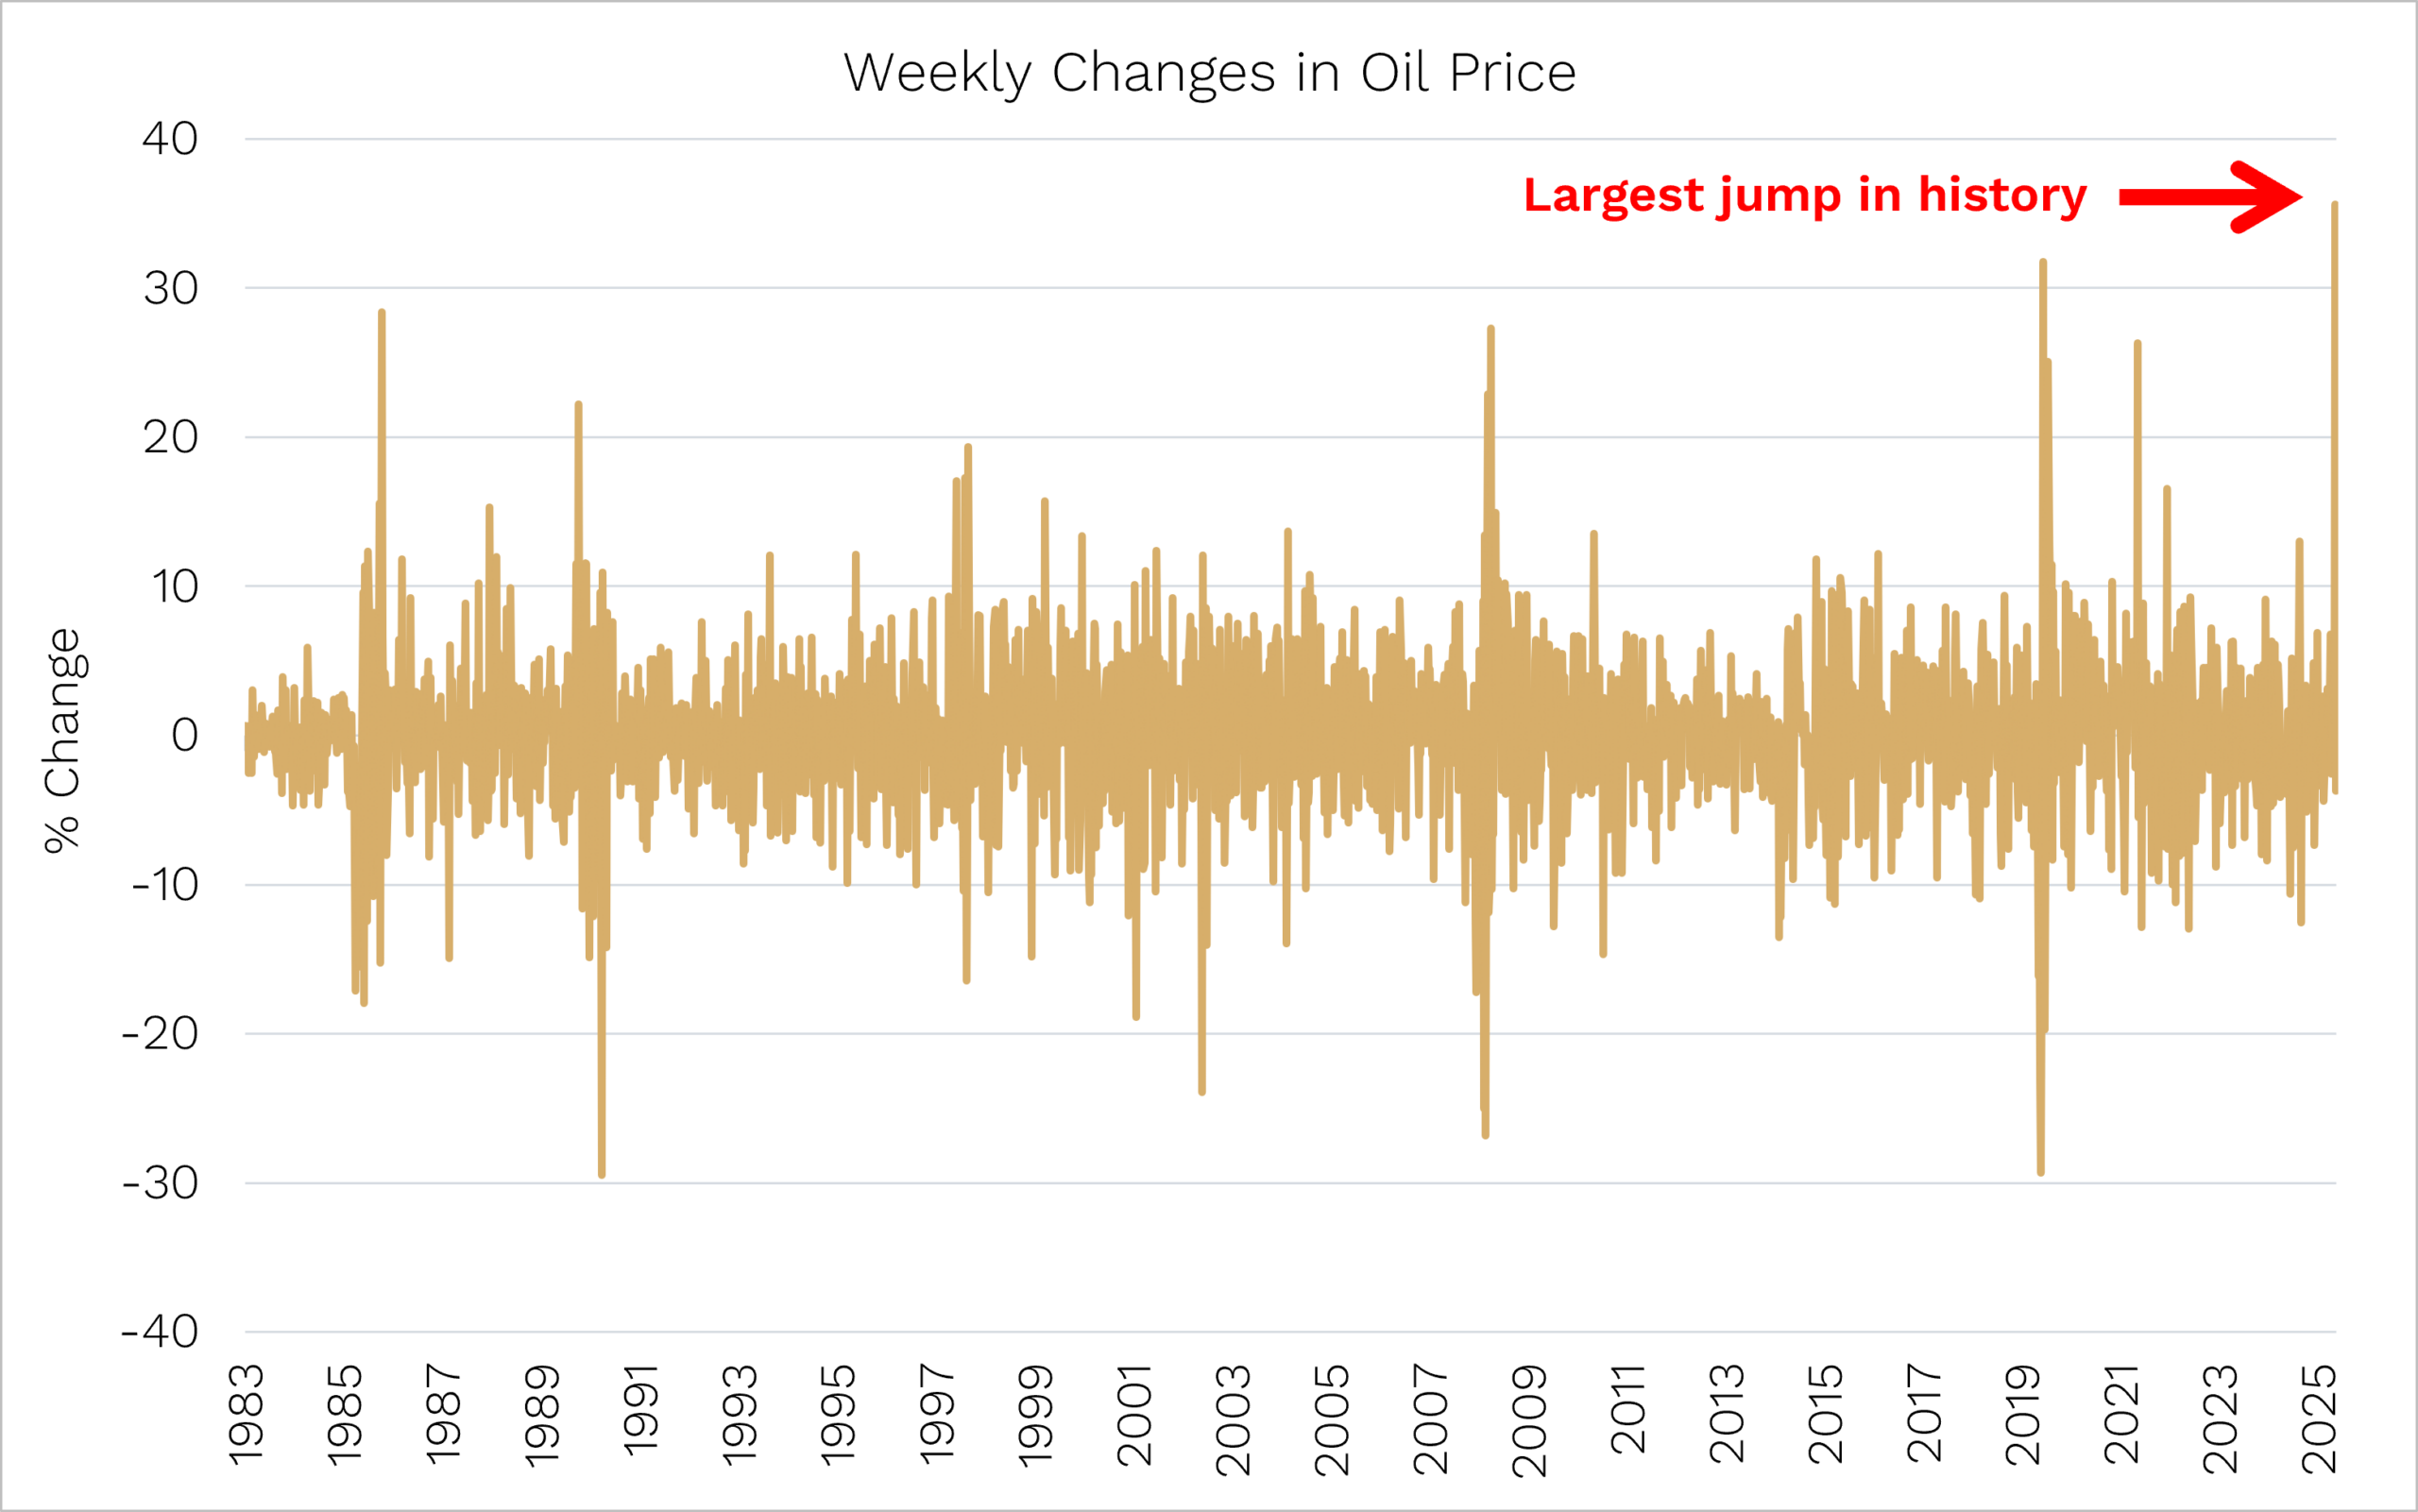
Understandably, investors have been scratching their heads and wondering why the US share market is back at all-time highs when the Iran war and the global oil supply situation remain unresolved.
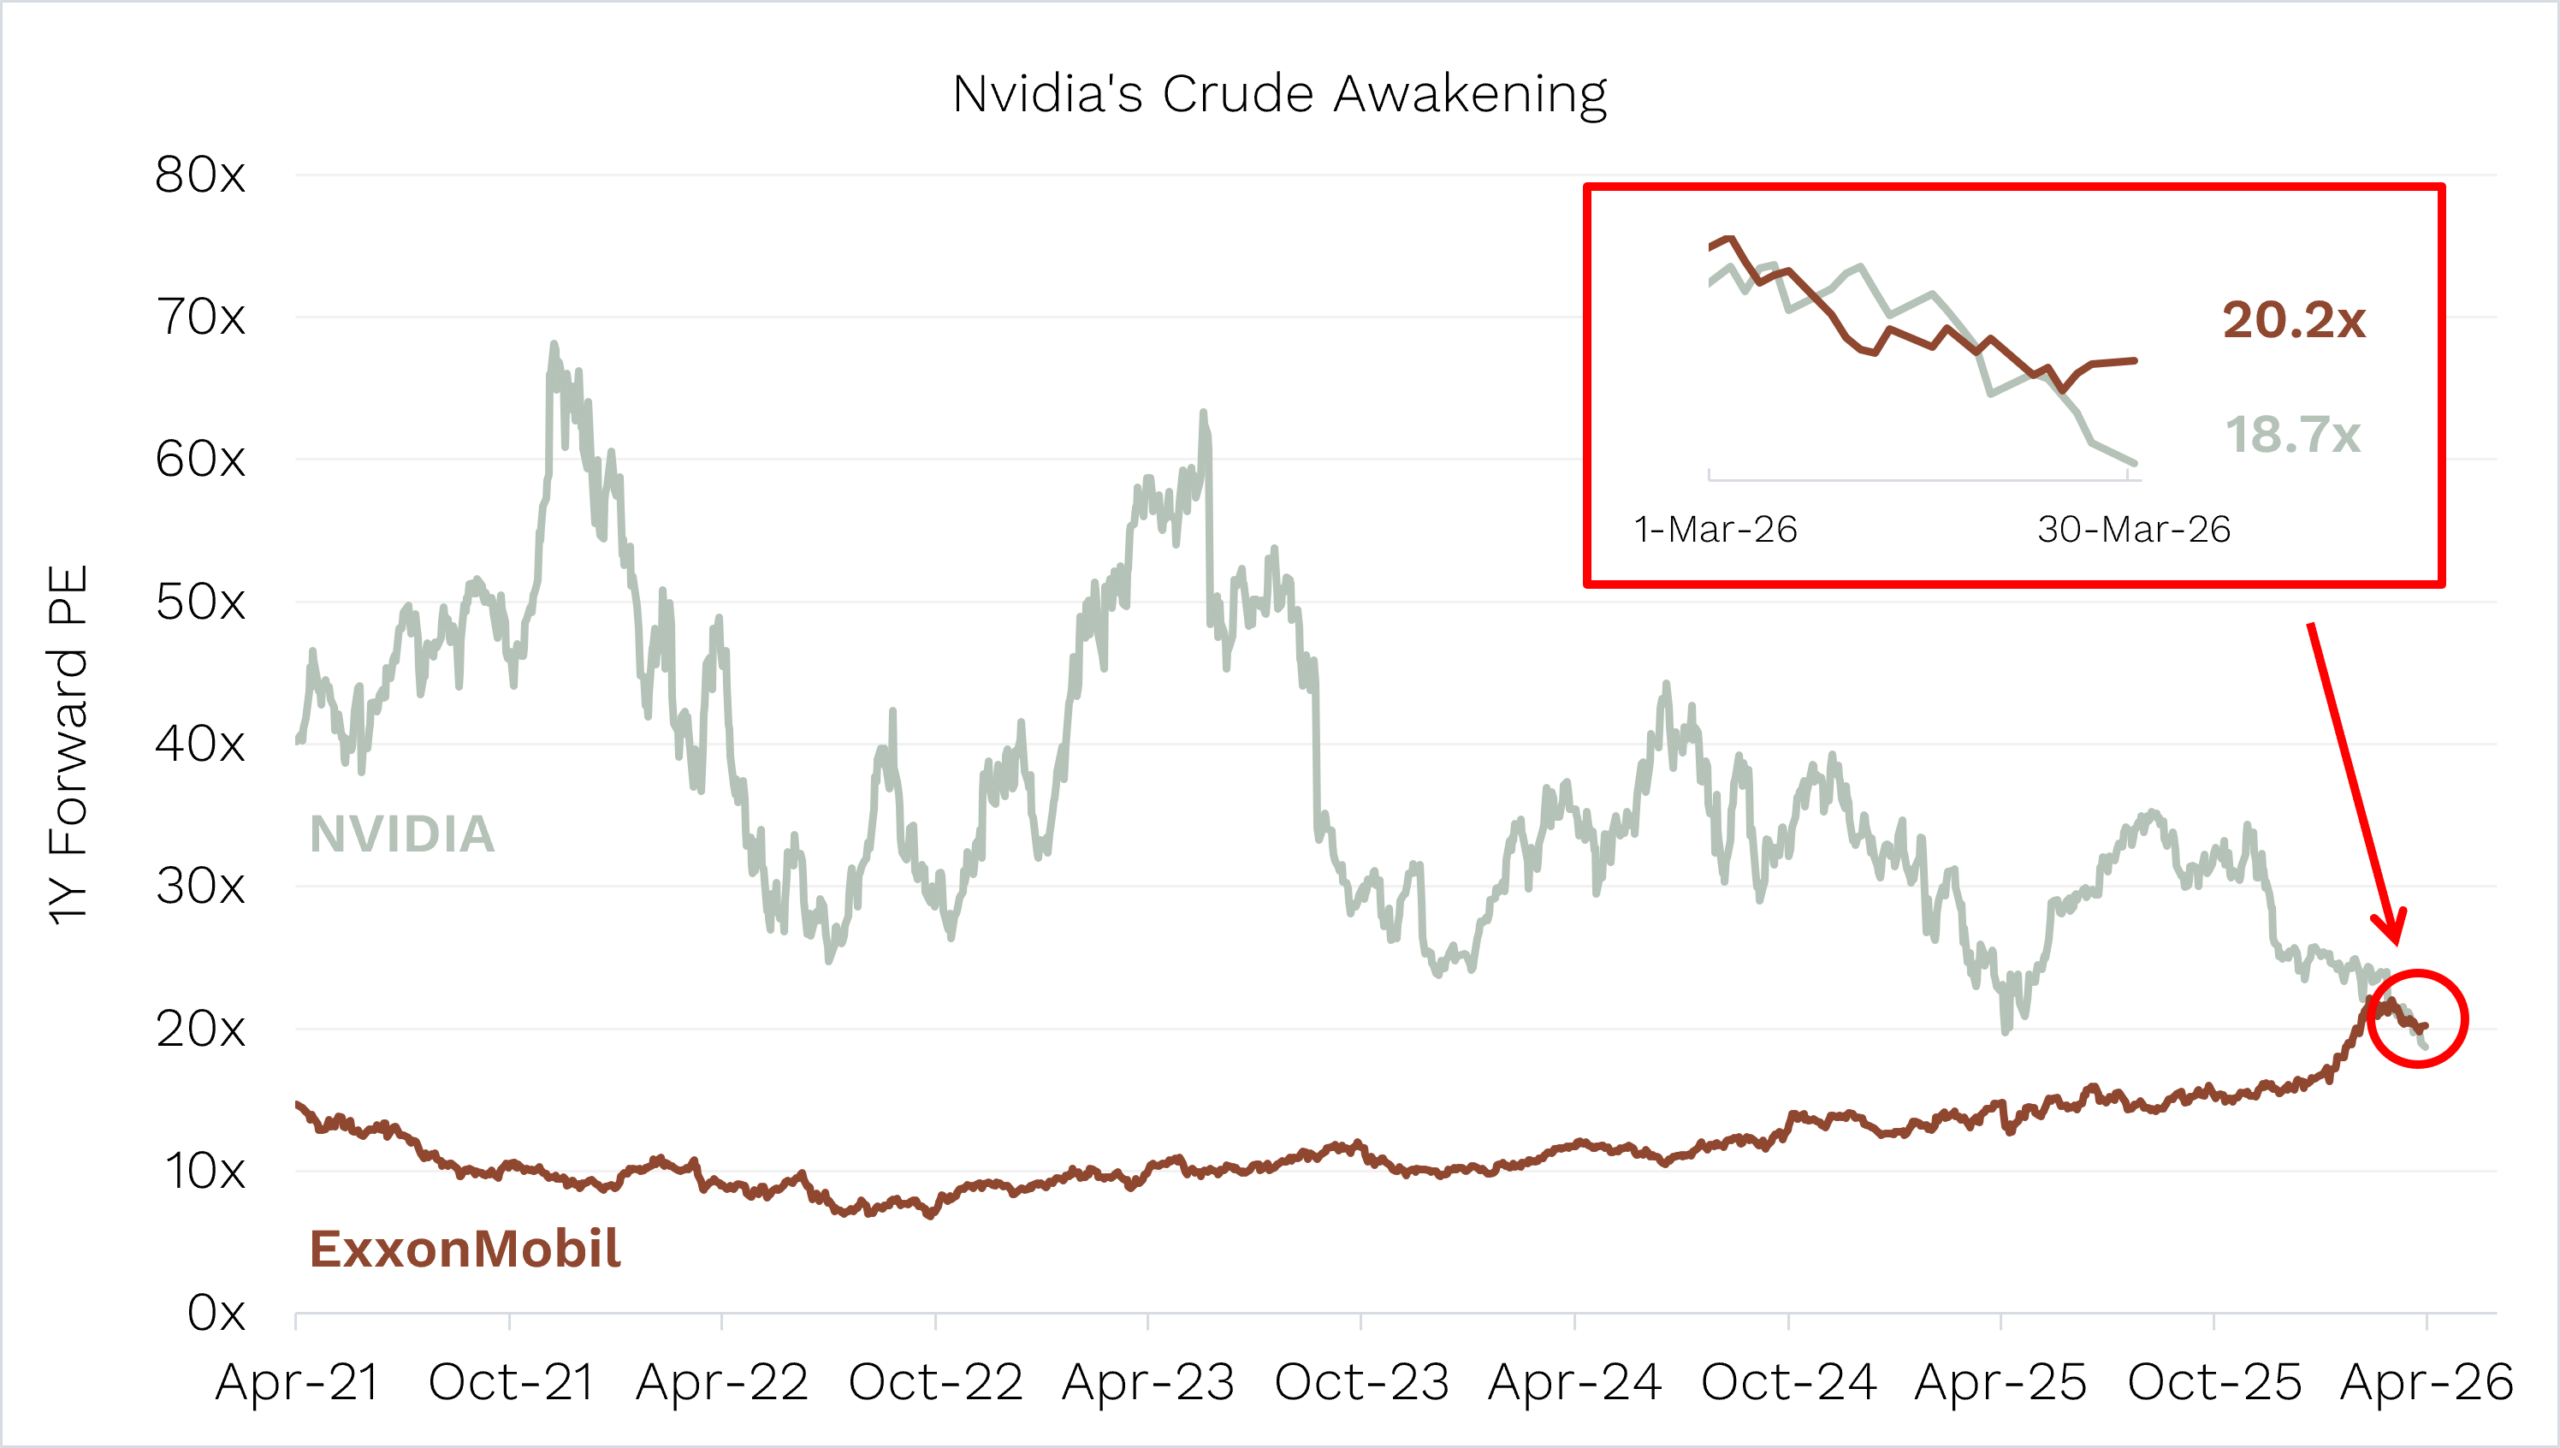
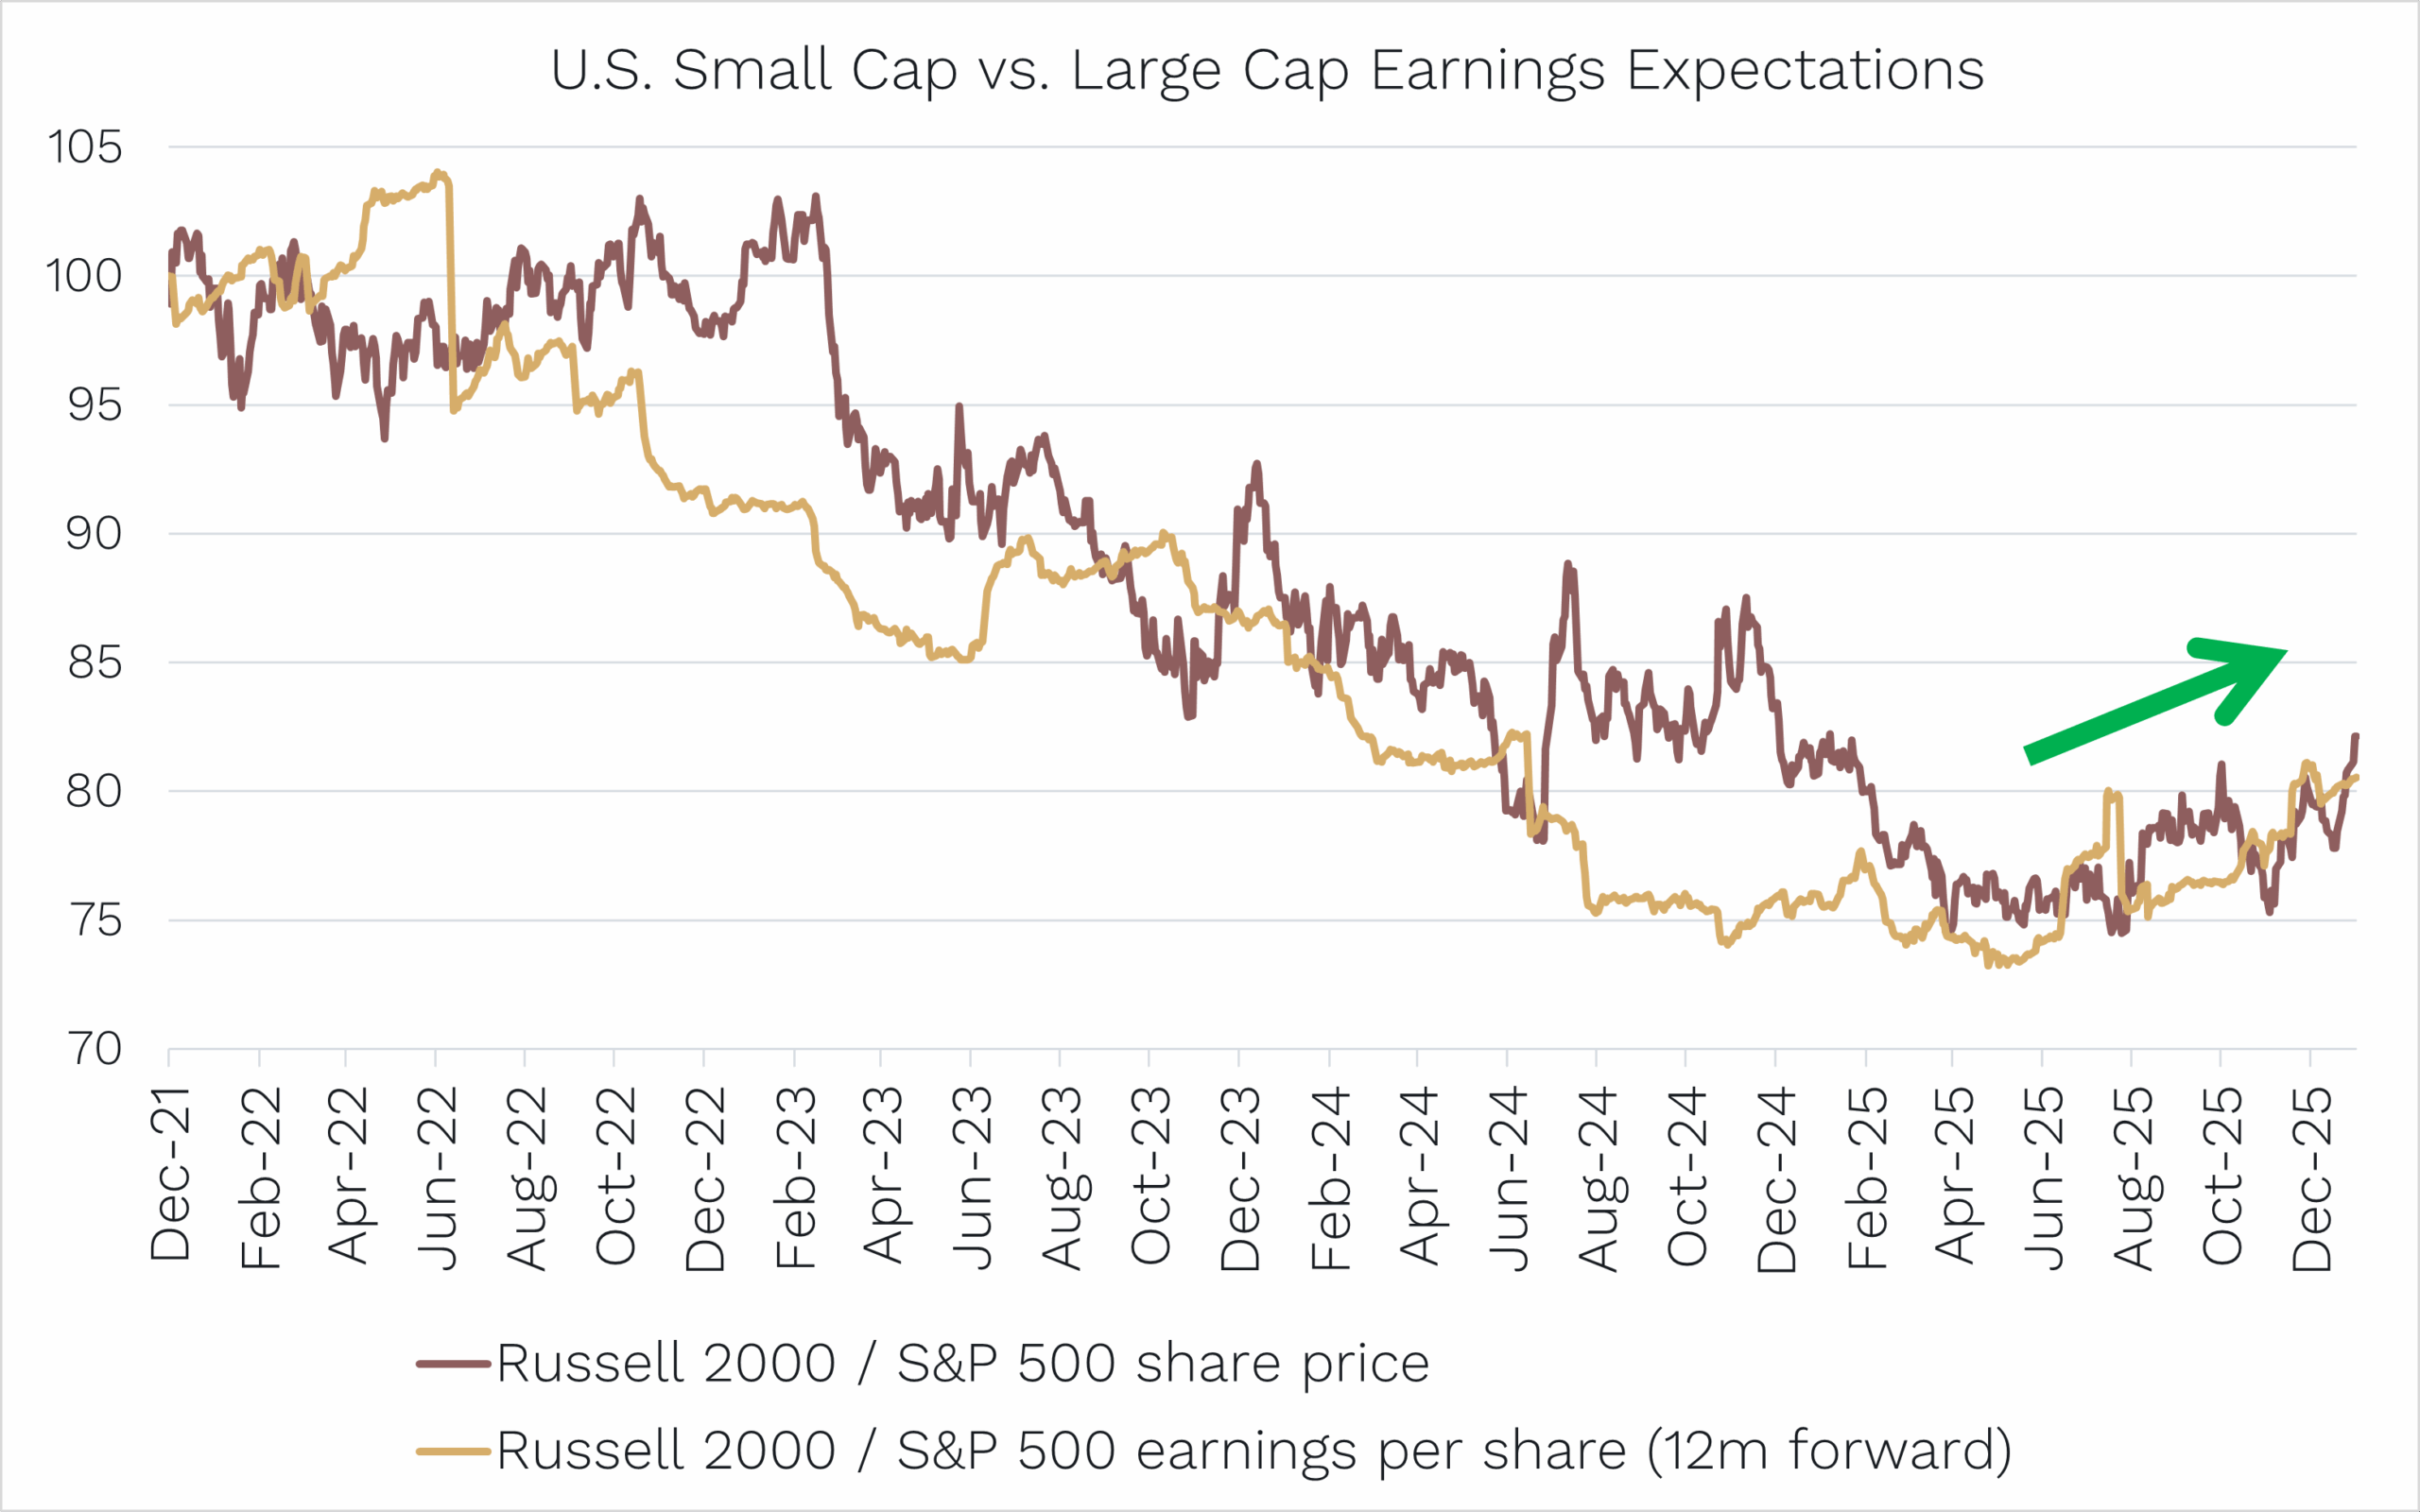
The answer likely lies in the chart below.
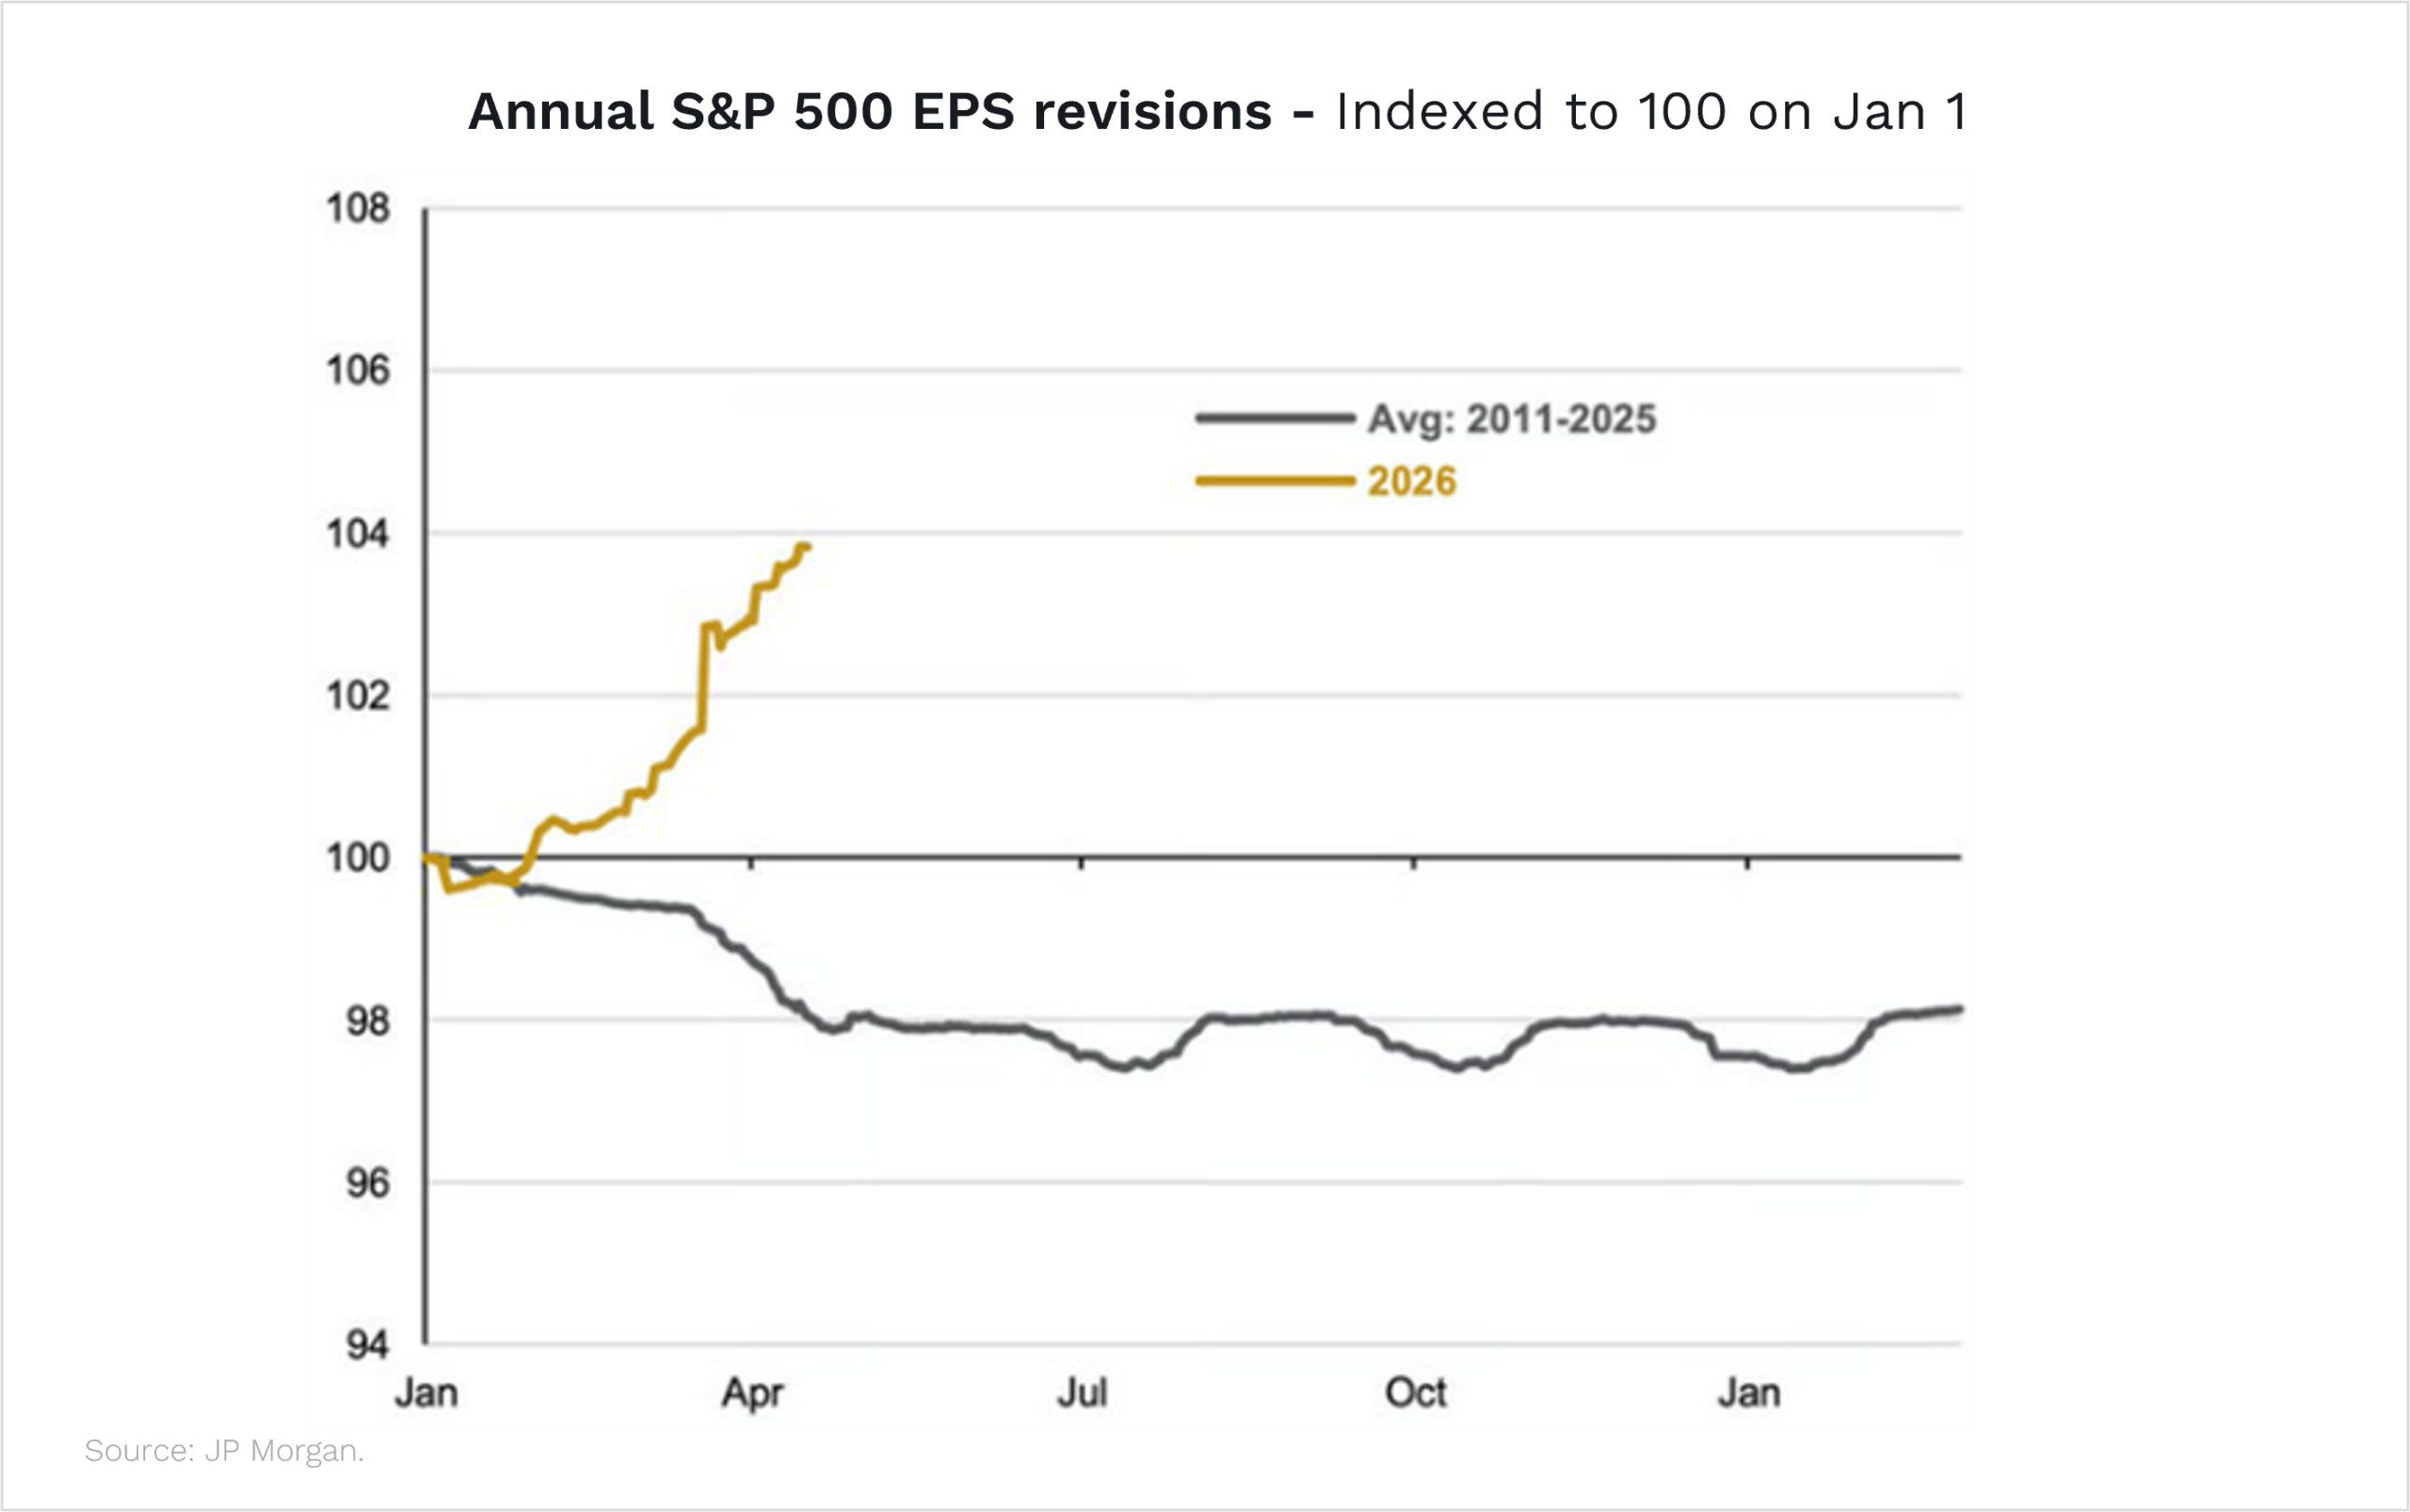
It’s earnings!
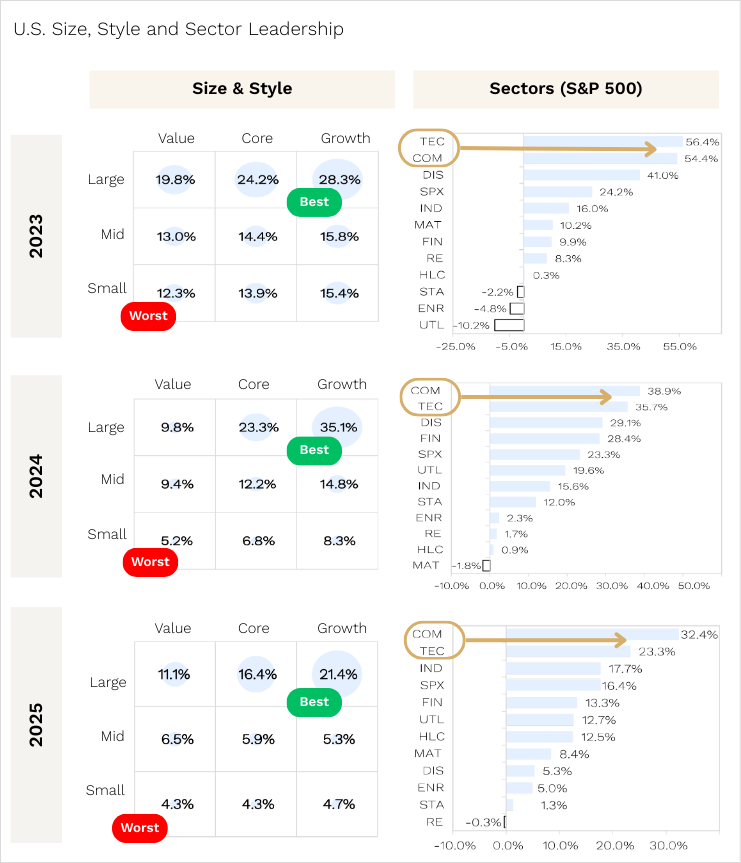
Normally in the first few months of the year (as shown by the grey line), corporate earnings expectations in the U.S. get downgraded.
But this year, earnings expectations have been going bananas.
They’ve been juiced up by stellar growth from AI-related businesses.
But expectations for earnings growth have also been strong outside the Magnificent 7, including in small-cap land where we fish.
How Ophir’s stock picking drove April outperformance
Our Ophir Funds in April collectively had one of their best months ever.
In fact, measured by the collective increase in our Funds Under Management due to investment returns, we added more to our investors’ back pockets in April than any month before!
Of course, in our view, investing in shares is a long-term endeavour and that is what’s most important, but it’s nonetheless pleasing to have had a good month.
Leading the way was our Global Opportunities Fund (global small caps), which in April was up +12.3%.
As you can see in the chart below, over the 91 months since it started in October 2018, this was its best month ever.
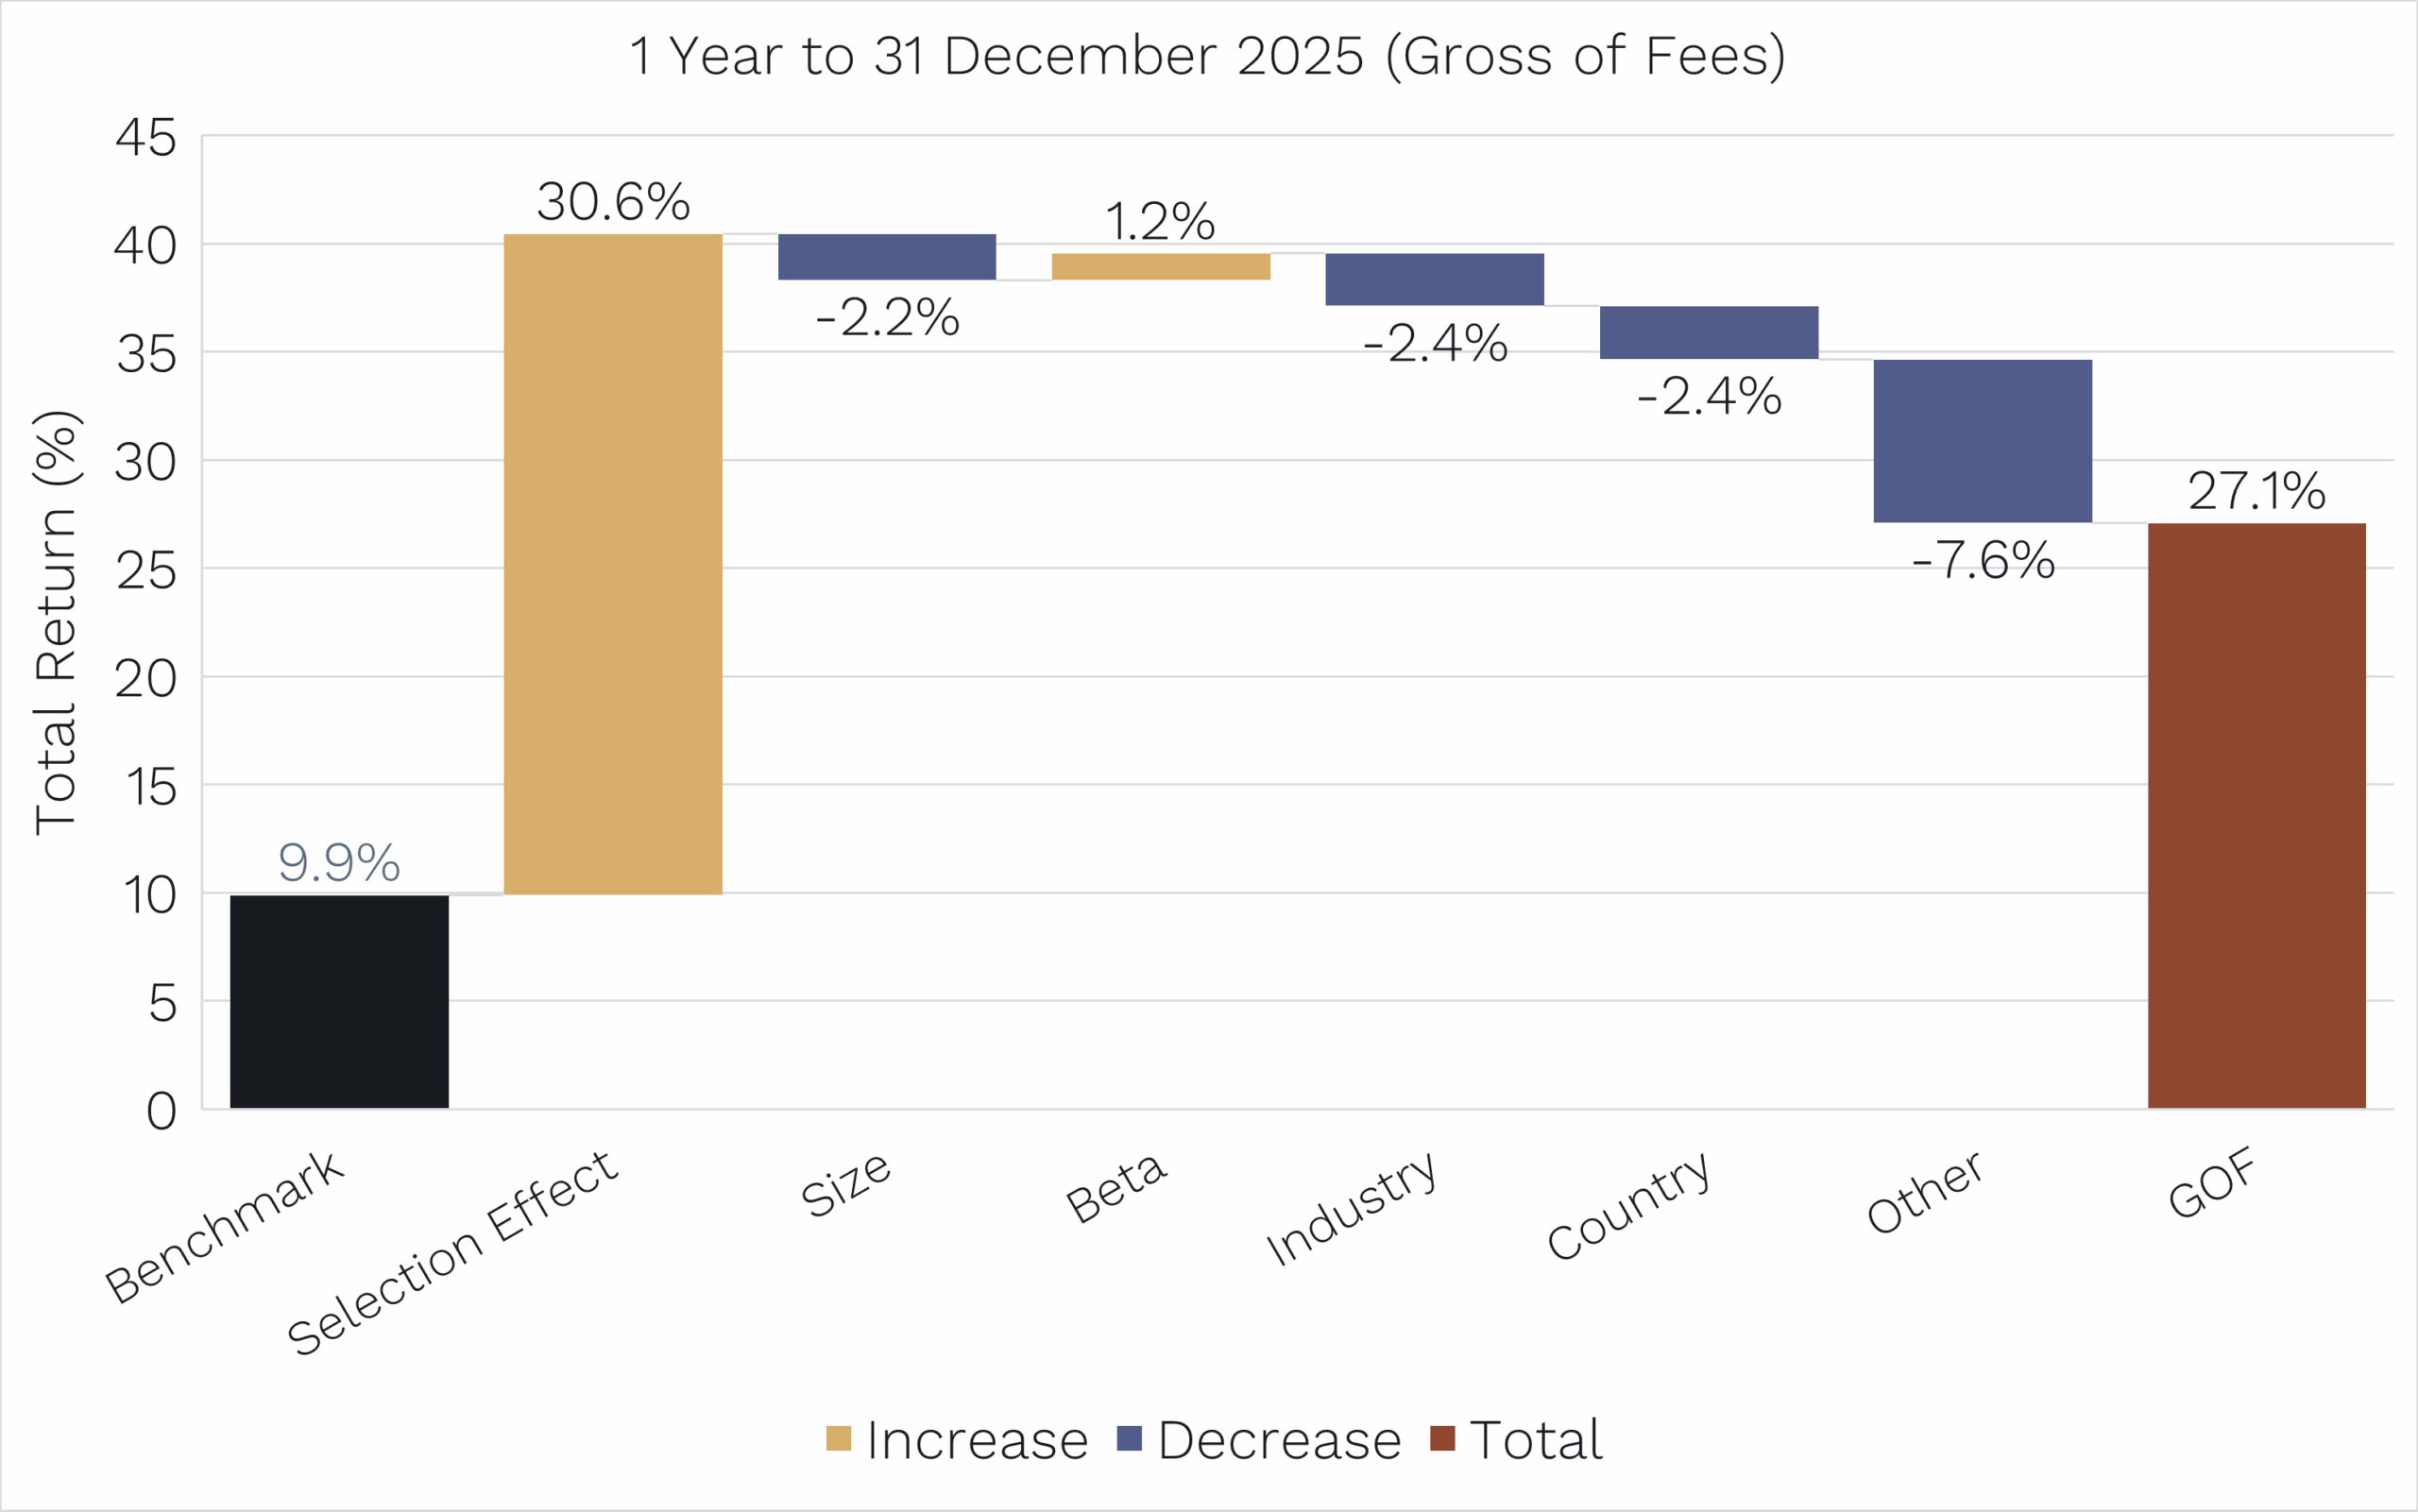
Importantly, most of this return was outperformance.
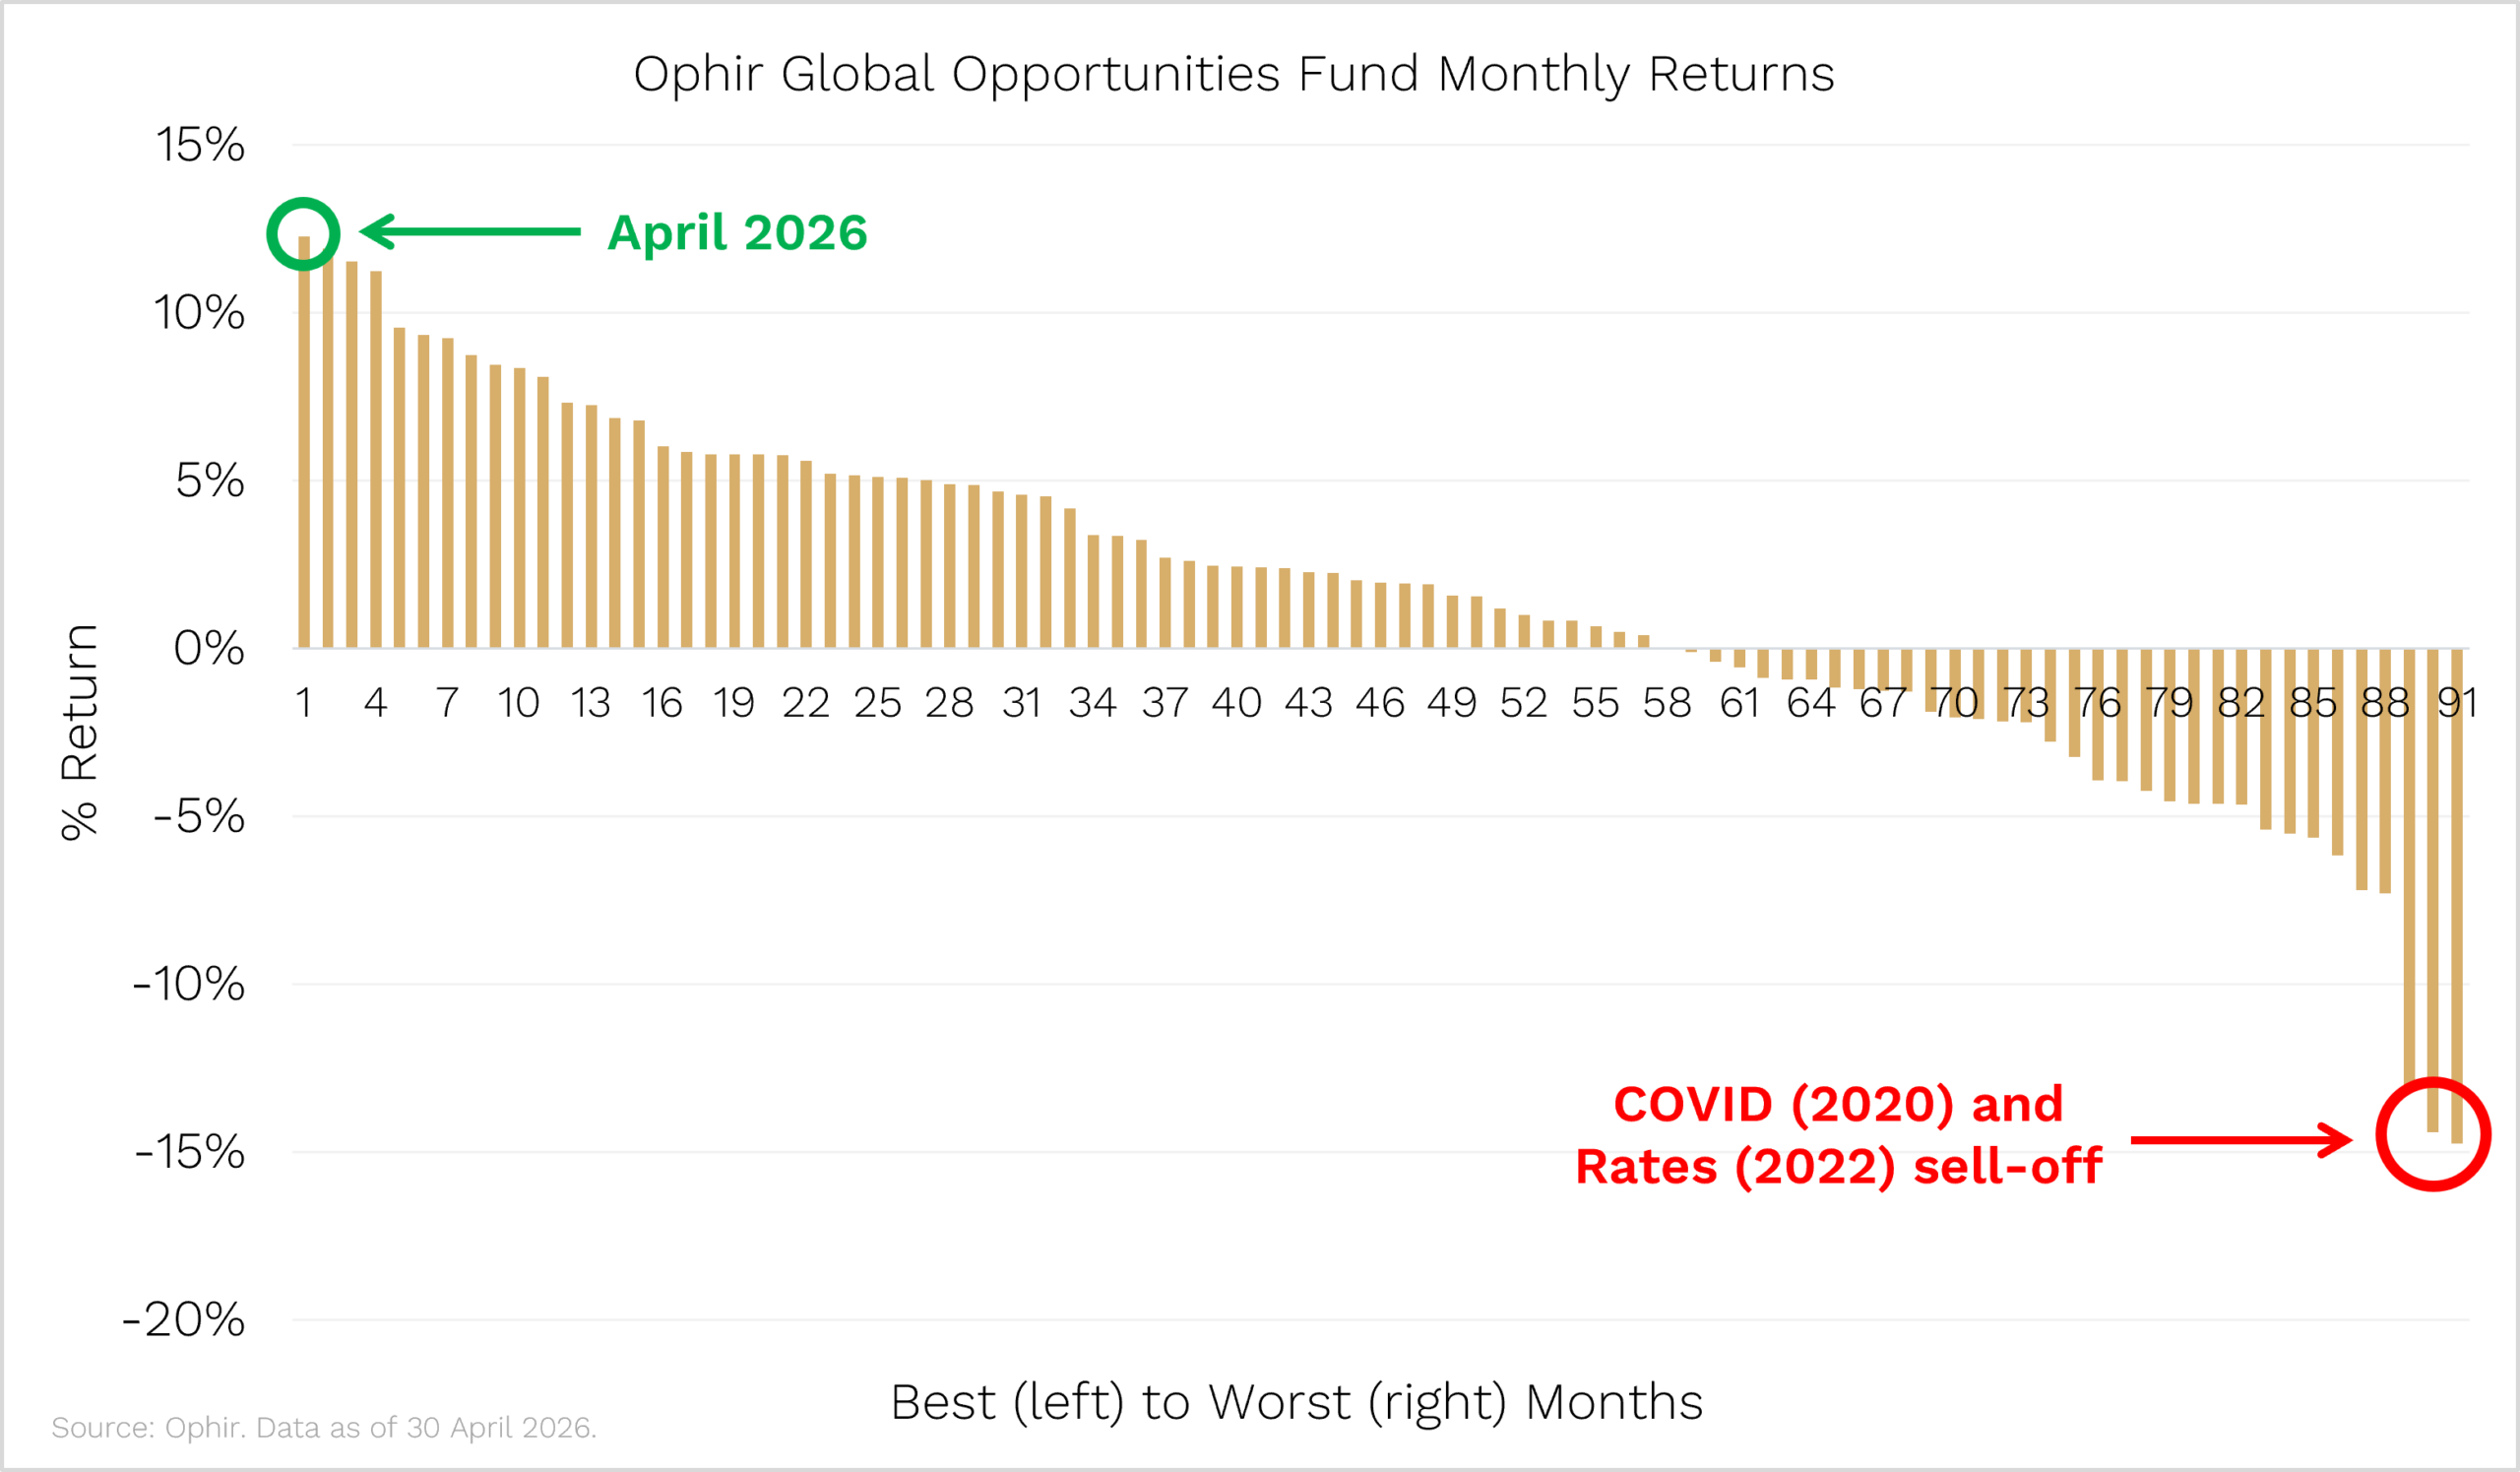
While the Fund was up 12.3 per cent in April, its benchmark (MSCI World SMID Cap Index NR AUD) rose +3.2% — an outperformance of 9.1%.
Just as important, the vast majority of that 9.1% outperformance came, not from a big factor or thematic tailwind, but from stock picking (a point we’ll elaborate on later).
The April outperformance was essentially the stock prices of our companies catching up with the Feb/March reporting season.
While they handed down strong earnings back then, they weren’t fully rewarded at the time because the Iran war had stolen the market’s attention.
Ophir Flagship Funds top leaderboards
Not only was April the best month for our Global Opportunities Fund in its history. But it was also the best performance in April of any global small/mid-cap fund available in Australia (see chart below).
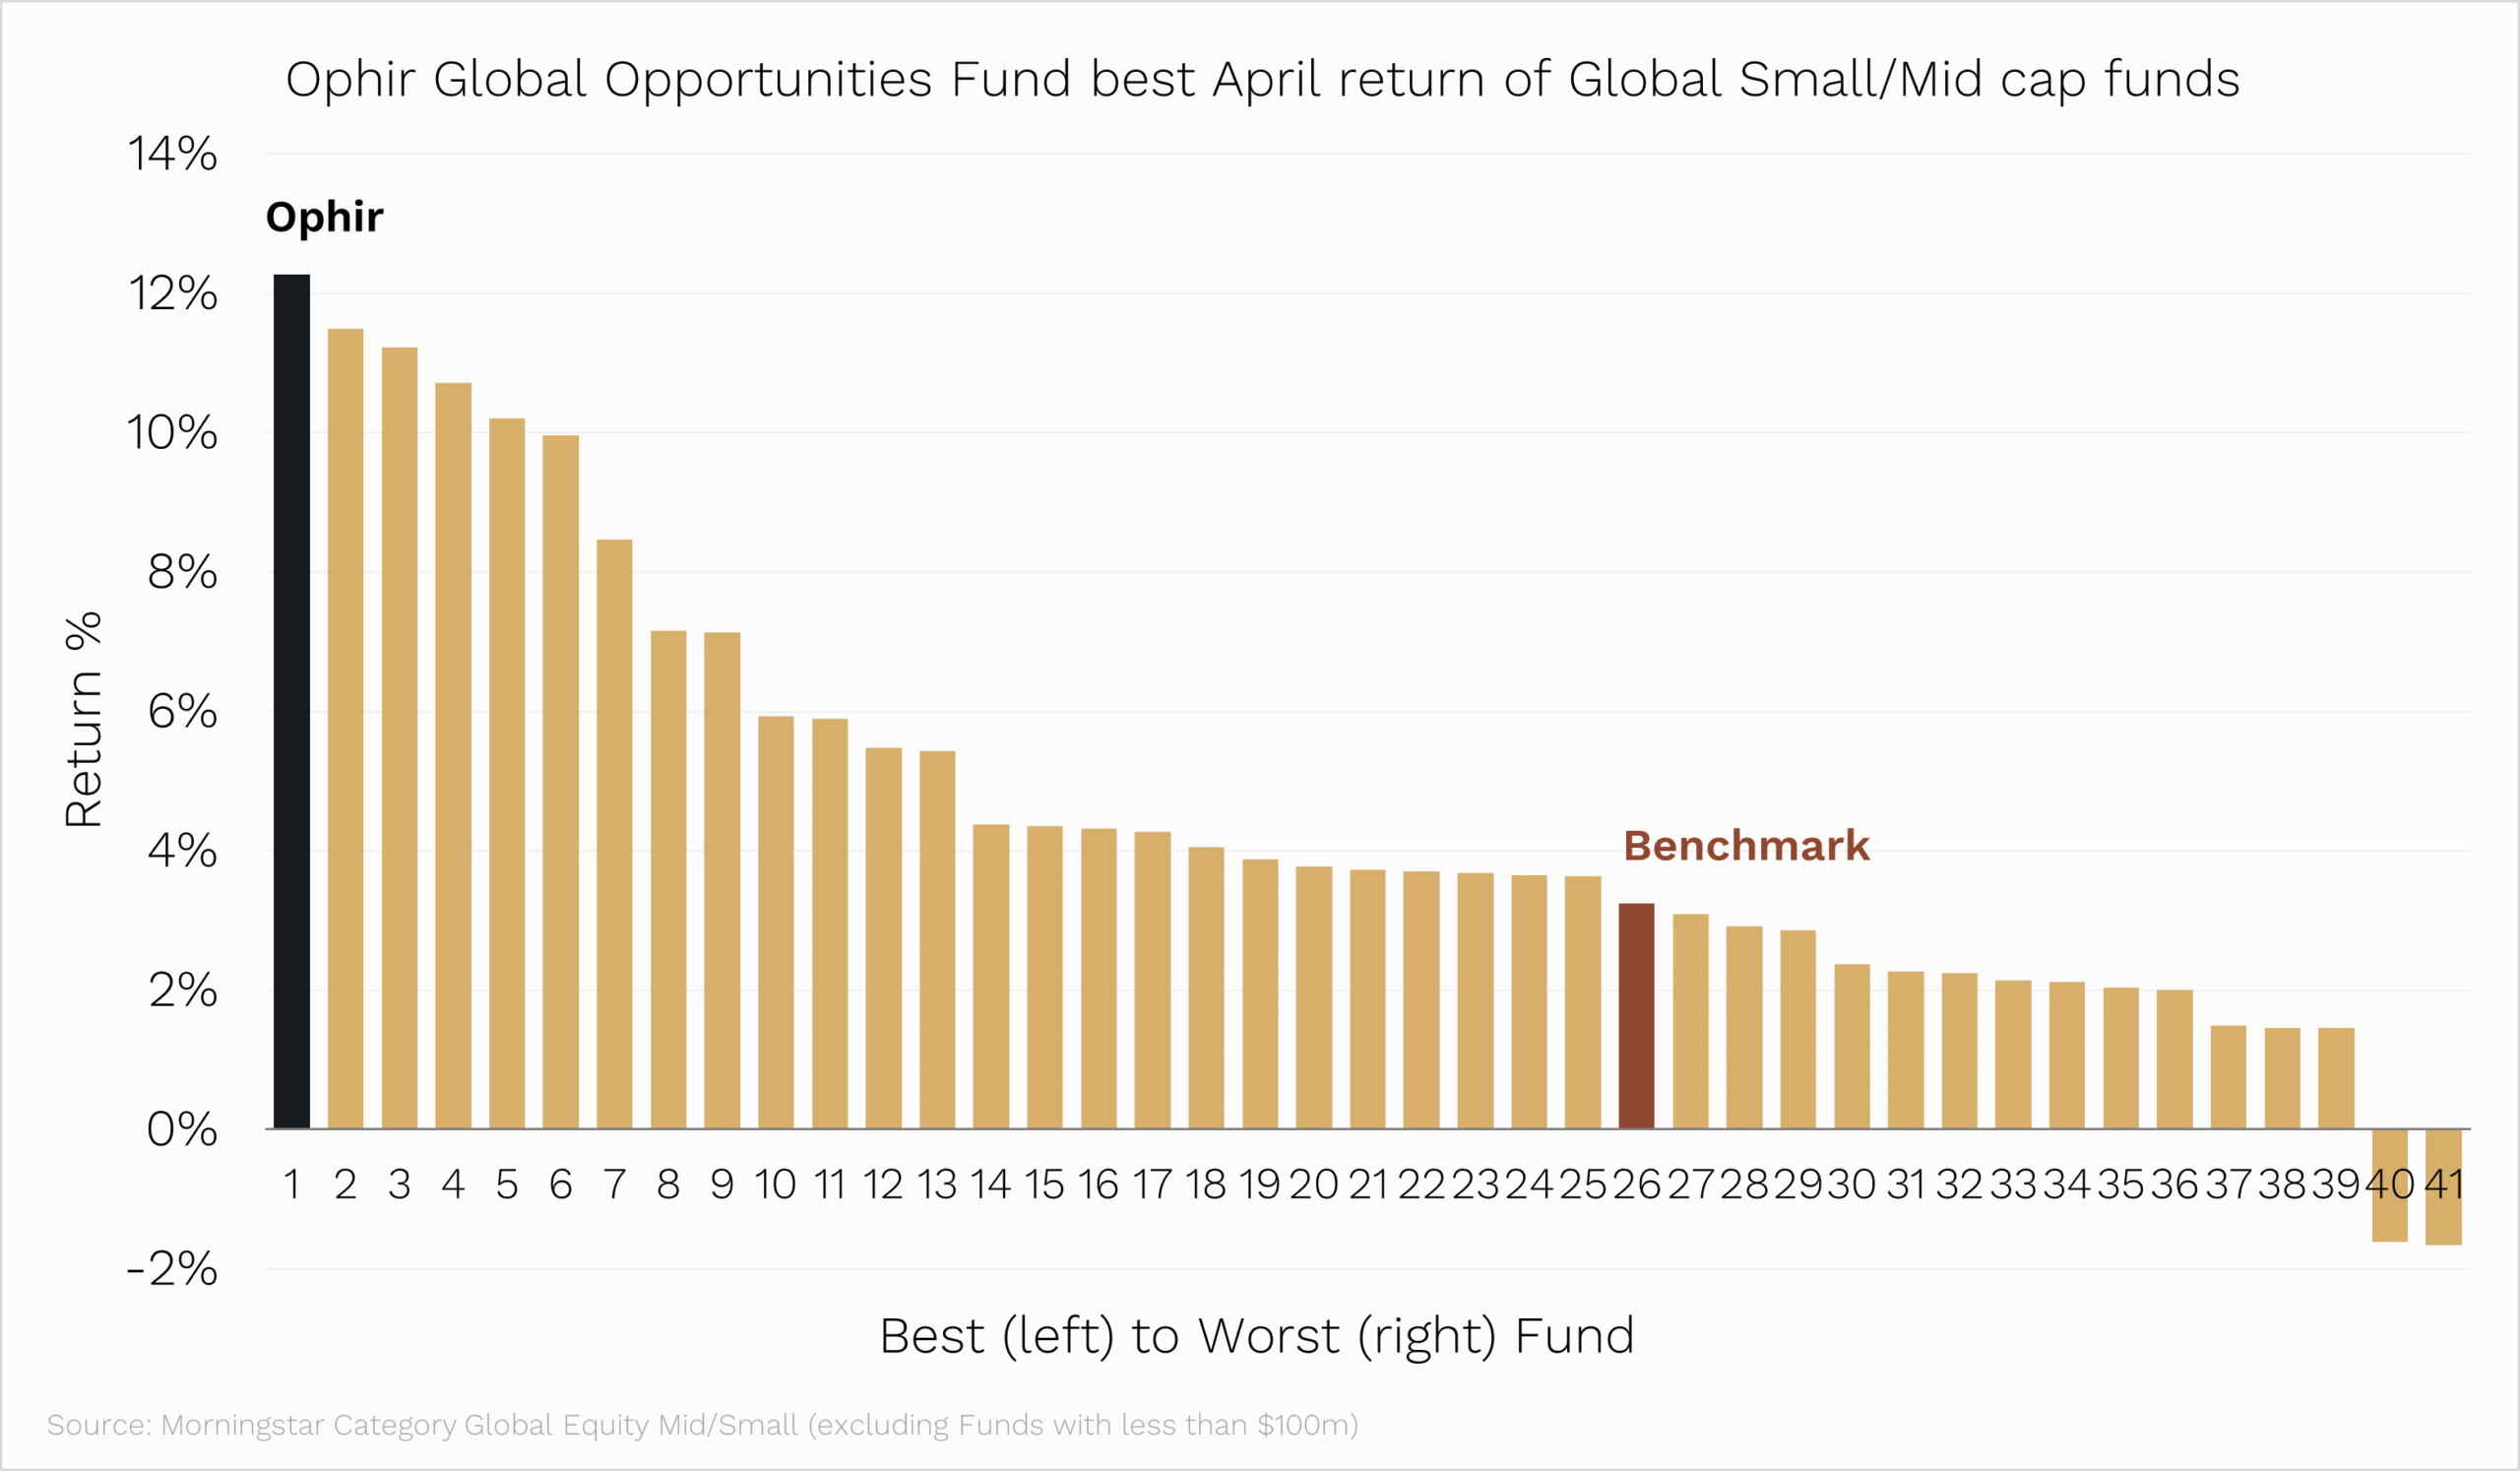
For prospective investors in the Fund, a natural question might be: “Have I missed out? Have all the returns already been squeezed from the current portfolio?”
Well, we’d note that the competition for stocks to get into our Global Opportunities Fund remains amongst the highest it’s ever been.
Many great ideas have been relegated to ‘bench’ stocks, so we can keep the Fund full of just our very best ideas. Given this, we have been personally allocating significant amounts to the Fund at the start of May.
Market leading performance
But it wasn’t just our flagship Global Fund that had a good April.
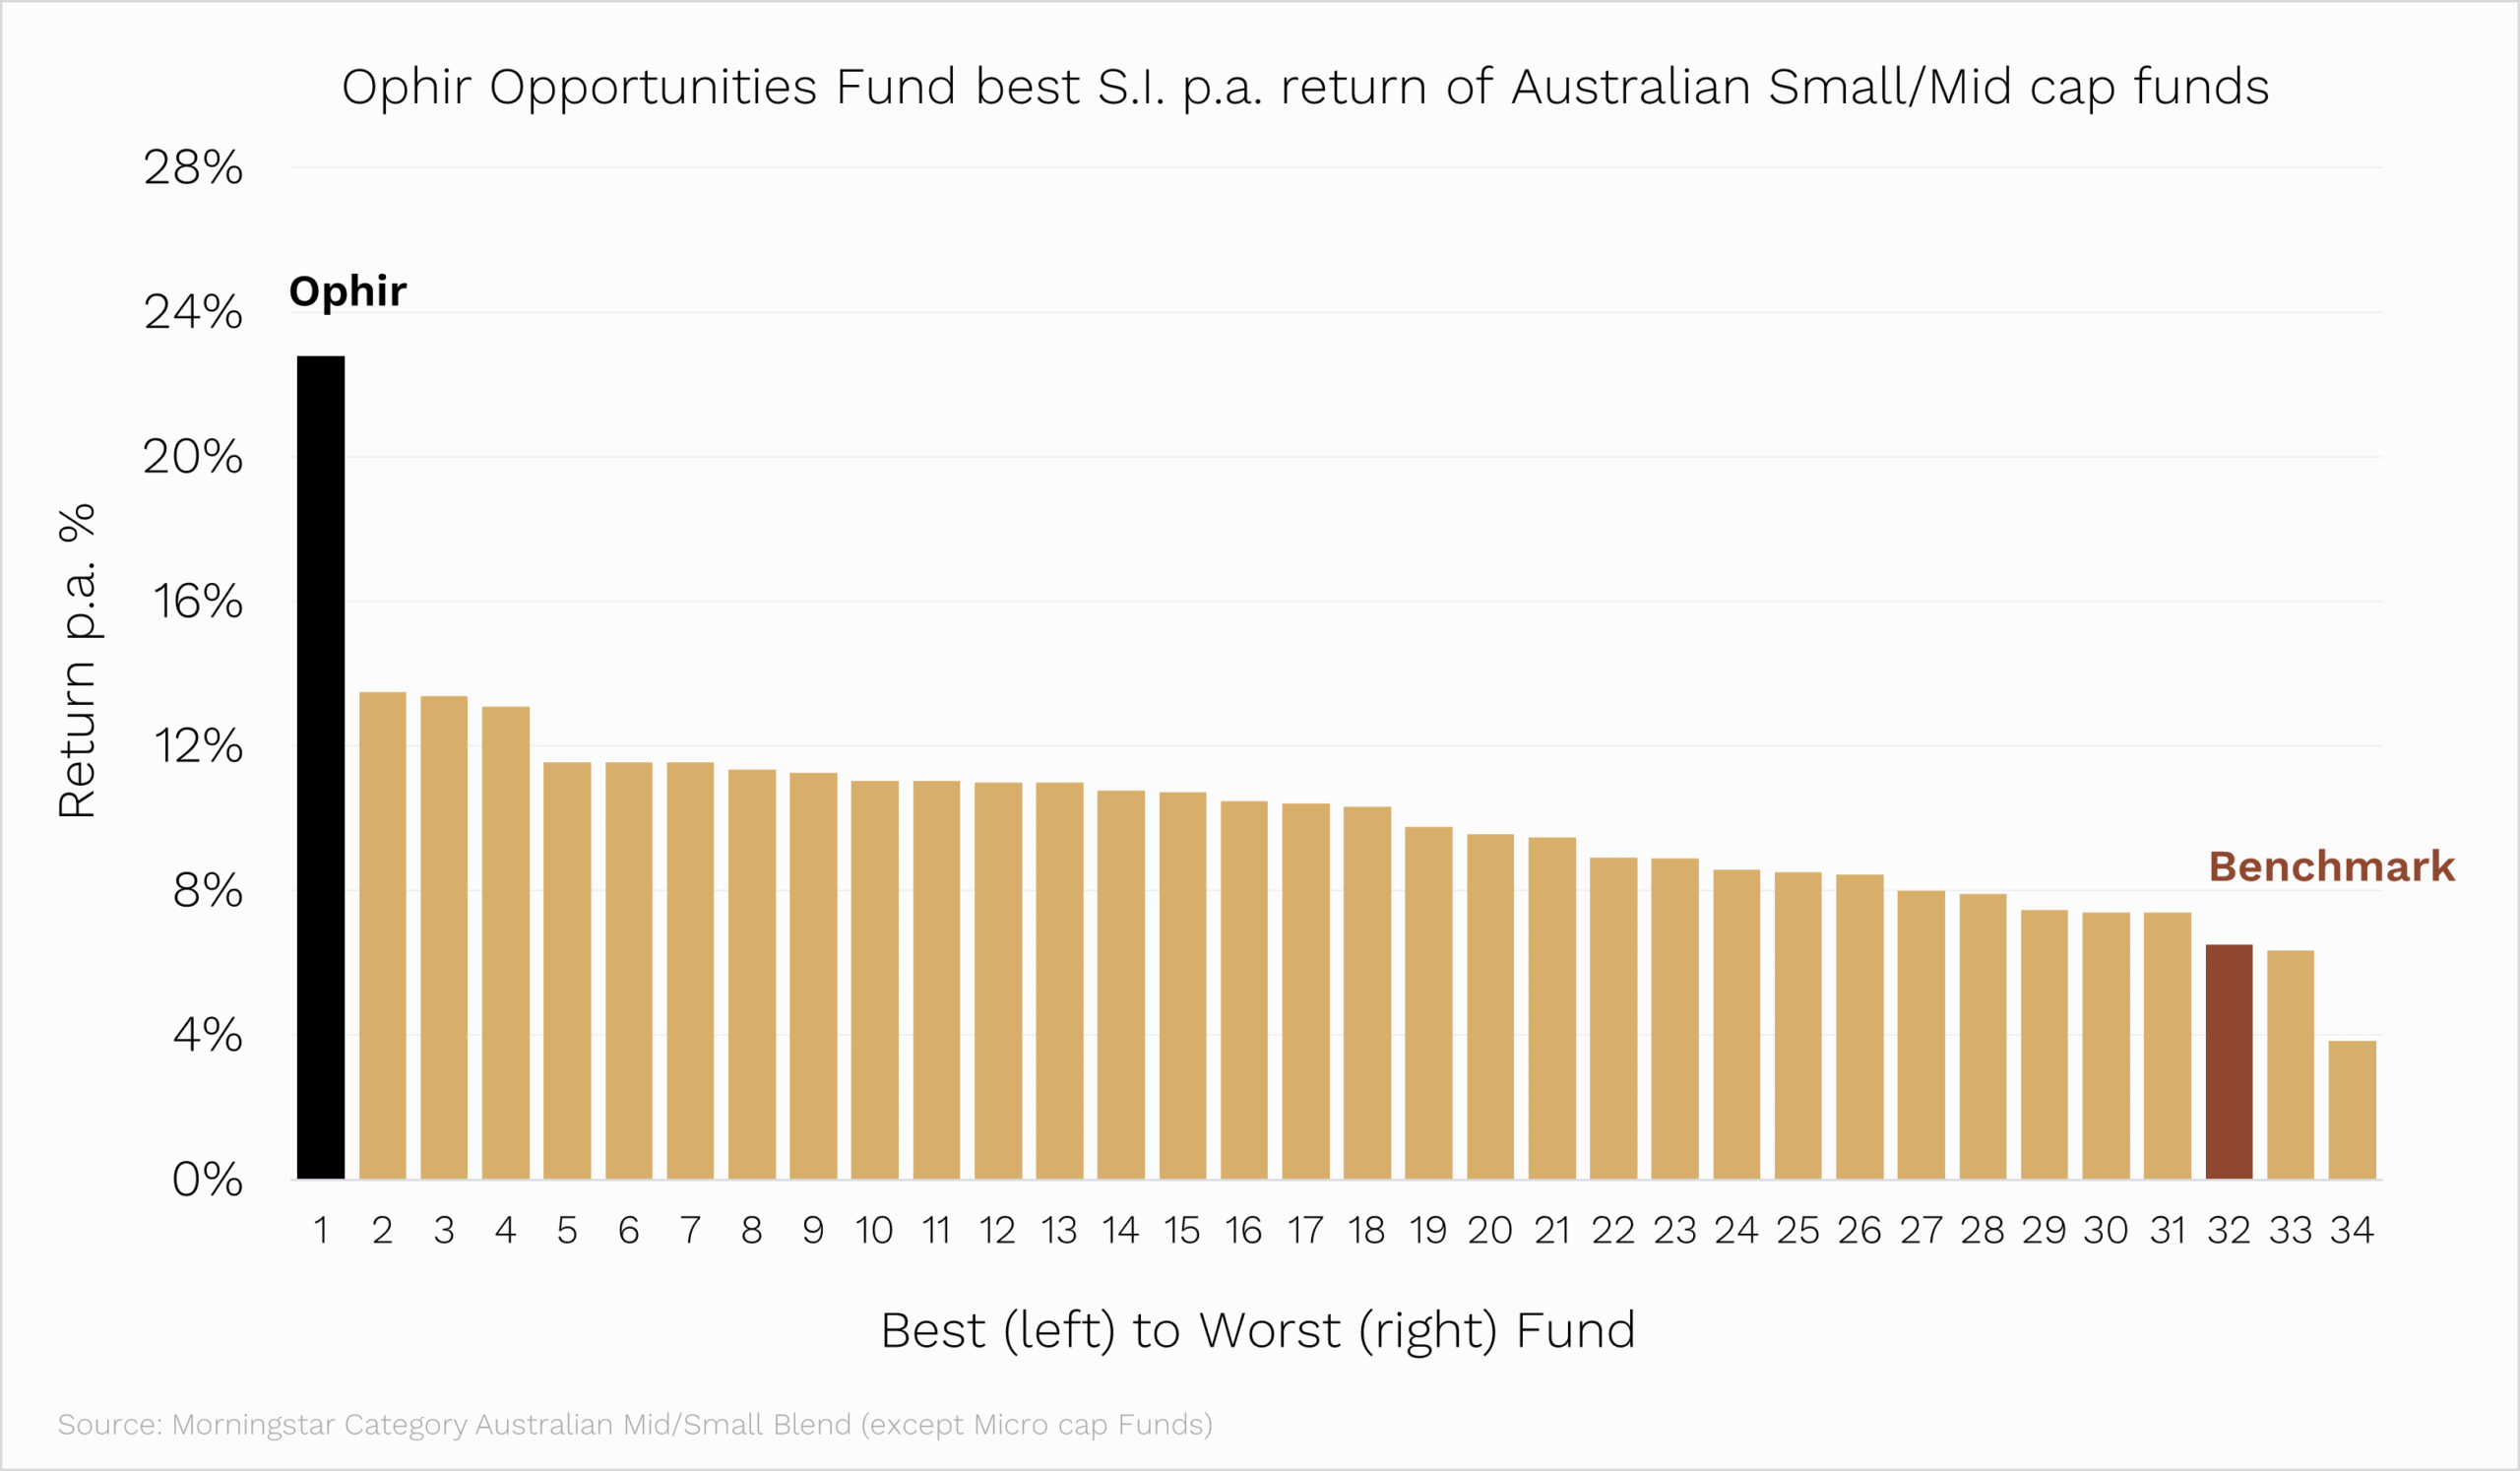
Our original Aussie small-cap fund, the Ophir Opportunities Fund, also outperformed all other Aussie small/mid-cap funds during April, rising +8.4%.
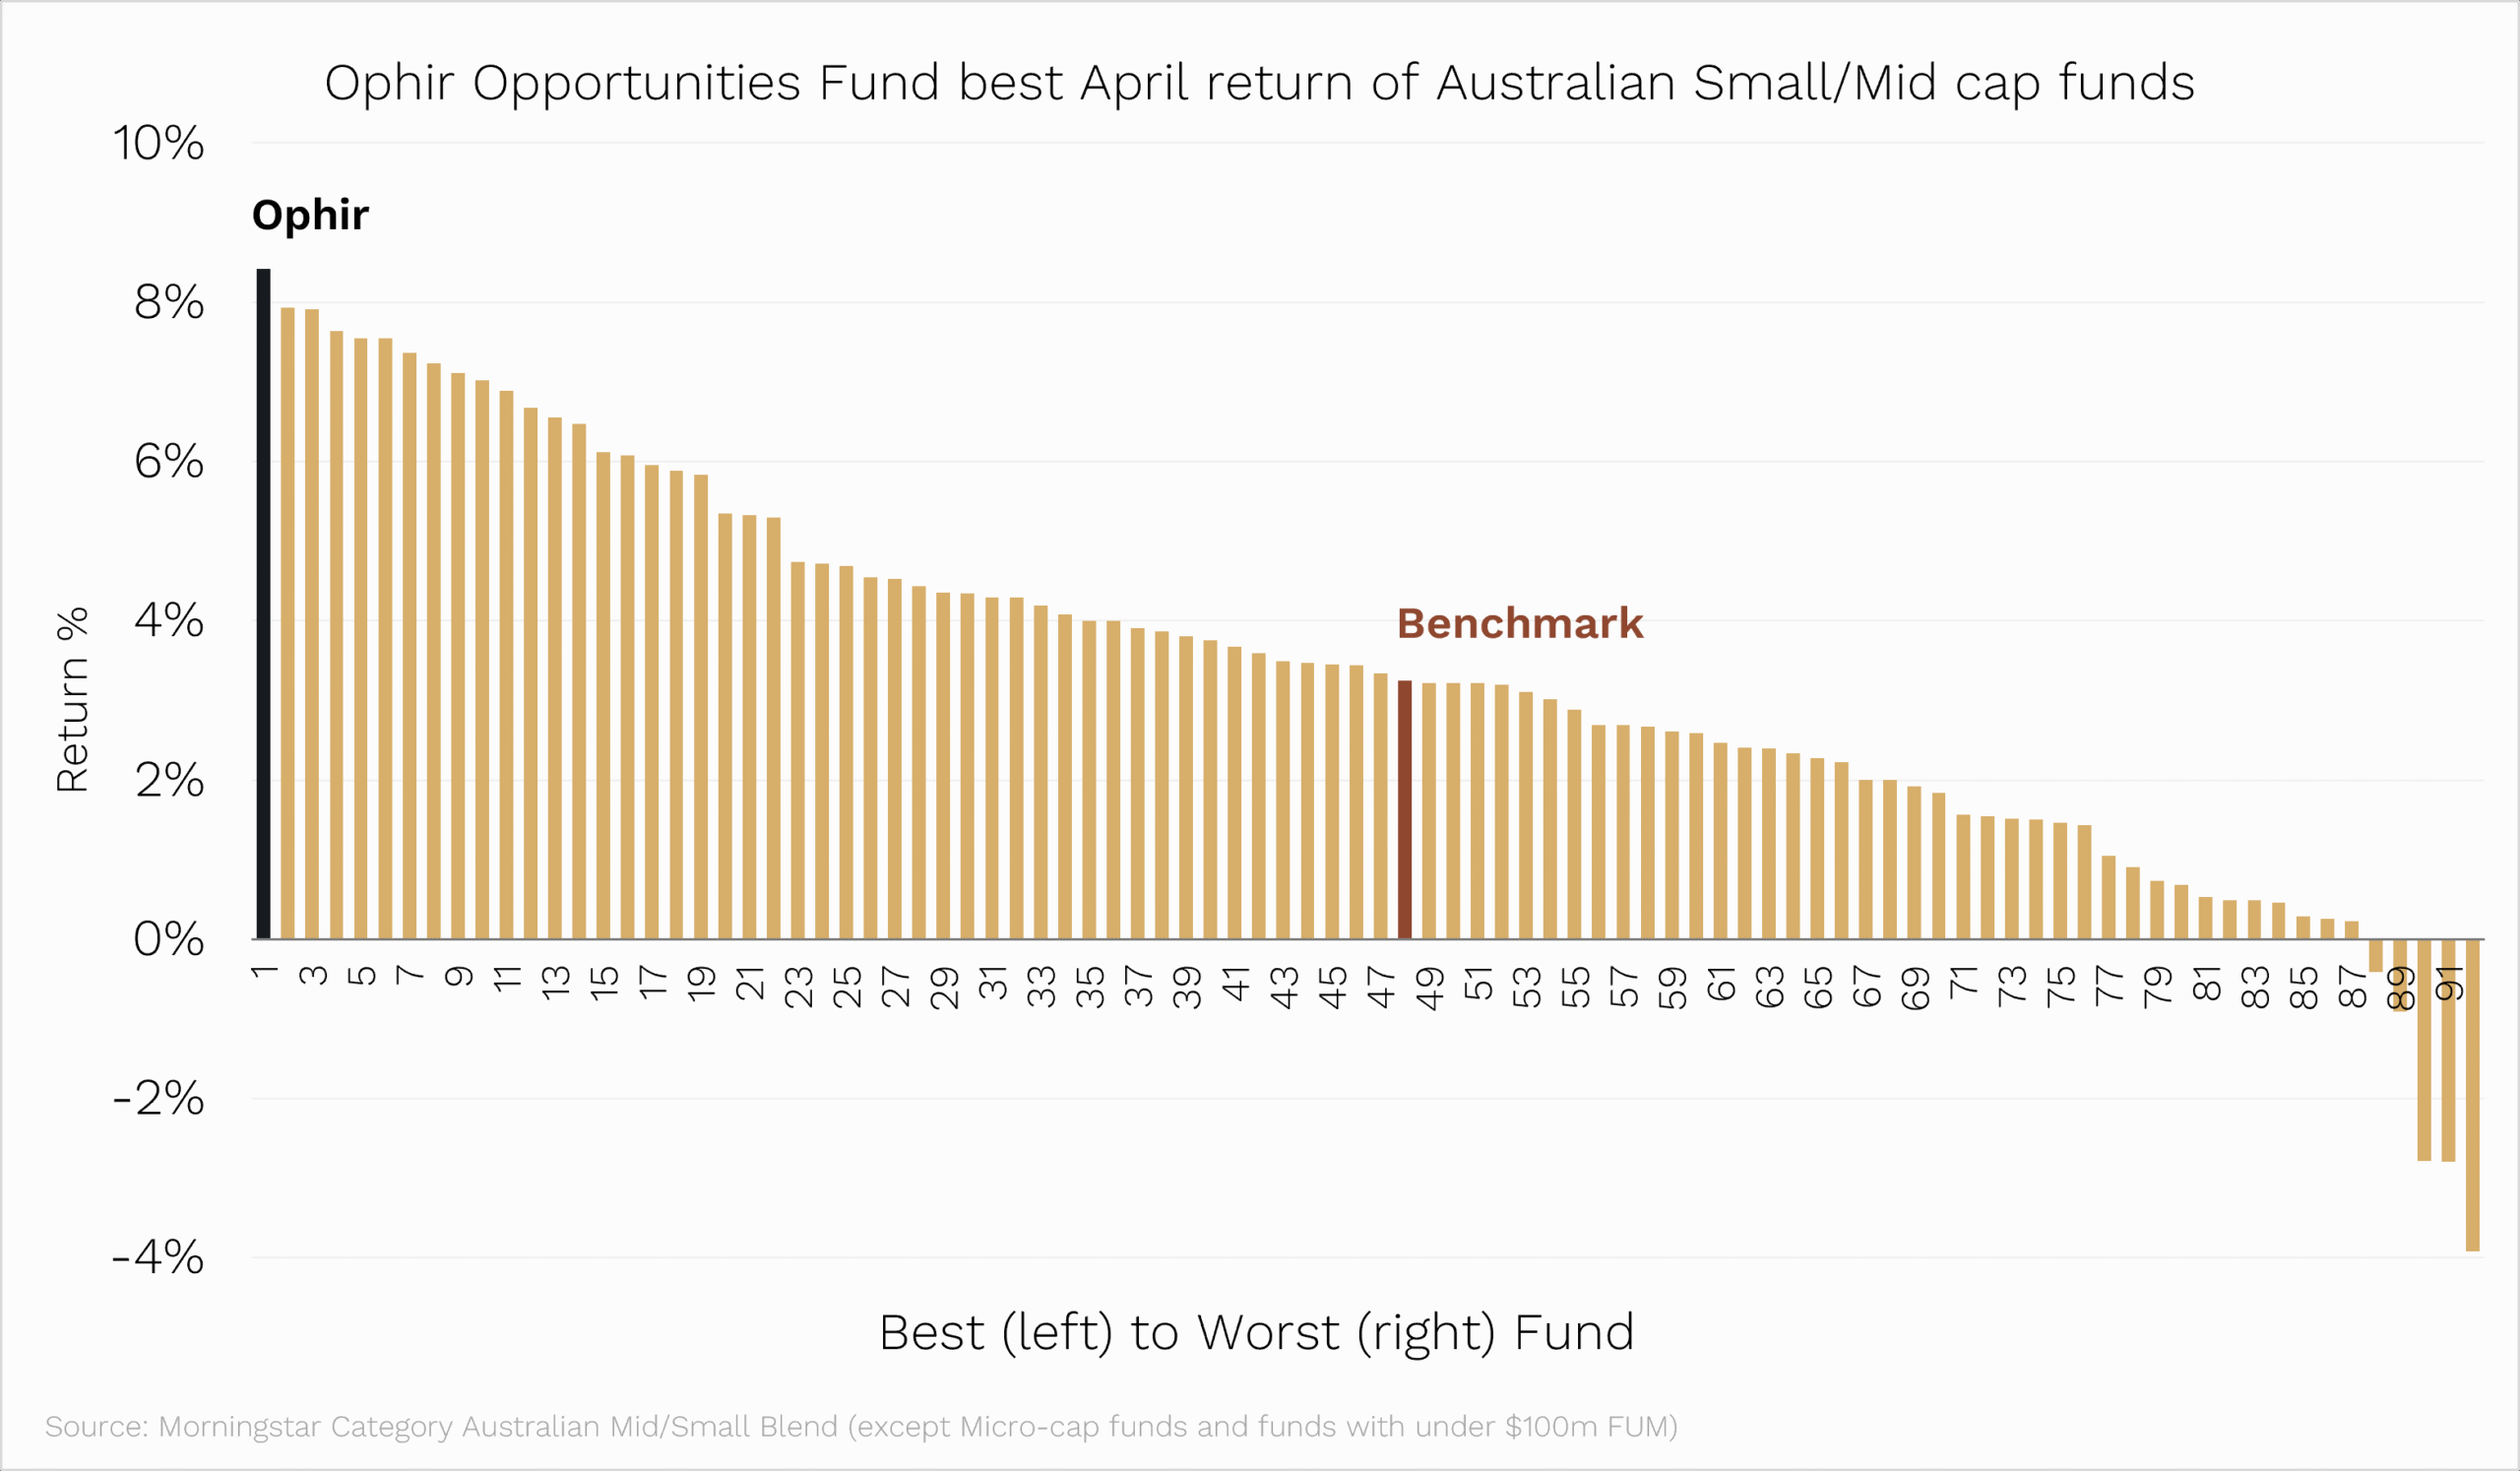
It wasn’t the Ophir Opportunities Fund’s best month ever in absolute terms. But after beating its benchmark (the ASX Small Ordinaries Index +3.3%) by 5.1% in April, it was a top-10 outperformance month. Not bad for a fund that’s been going 165 months (almost 14 years).
Since its 2012 inception, that original Ophir Opportunities Fund has now returned +22.8% per annum after all fees.
That puts it a long way ahead of the other Australian small/mid-cap funds that have been going since 2012. And way ahead of the ASX Small Ordinaries total return index which has returned 6.7% per annum – see chart below.
Why the Global Opportunities Fund may follow in the footsteps of the Ophir Opportunities Fund with a ‘soft close’
Relative to other global small/mid-cap funds available in Australia that have been going since at least the Fund’s inception in 2018, our Global Opportunities Fund also has a significant outperformance gap (see below).
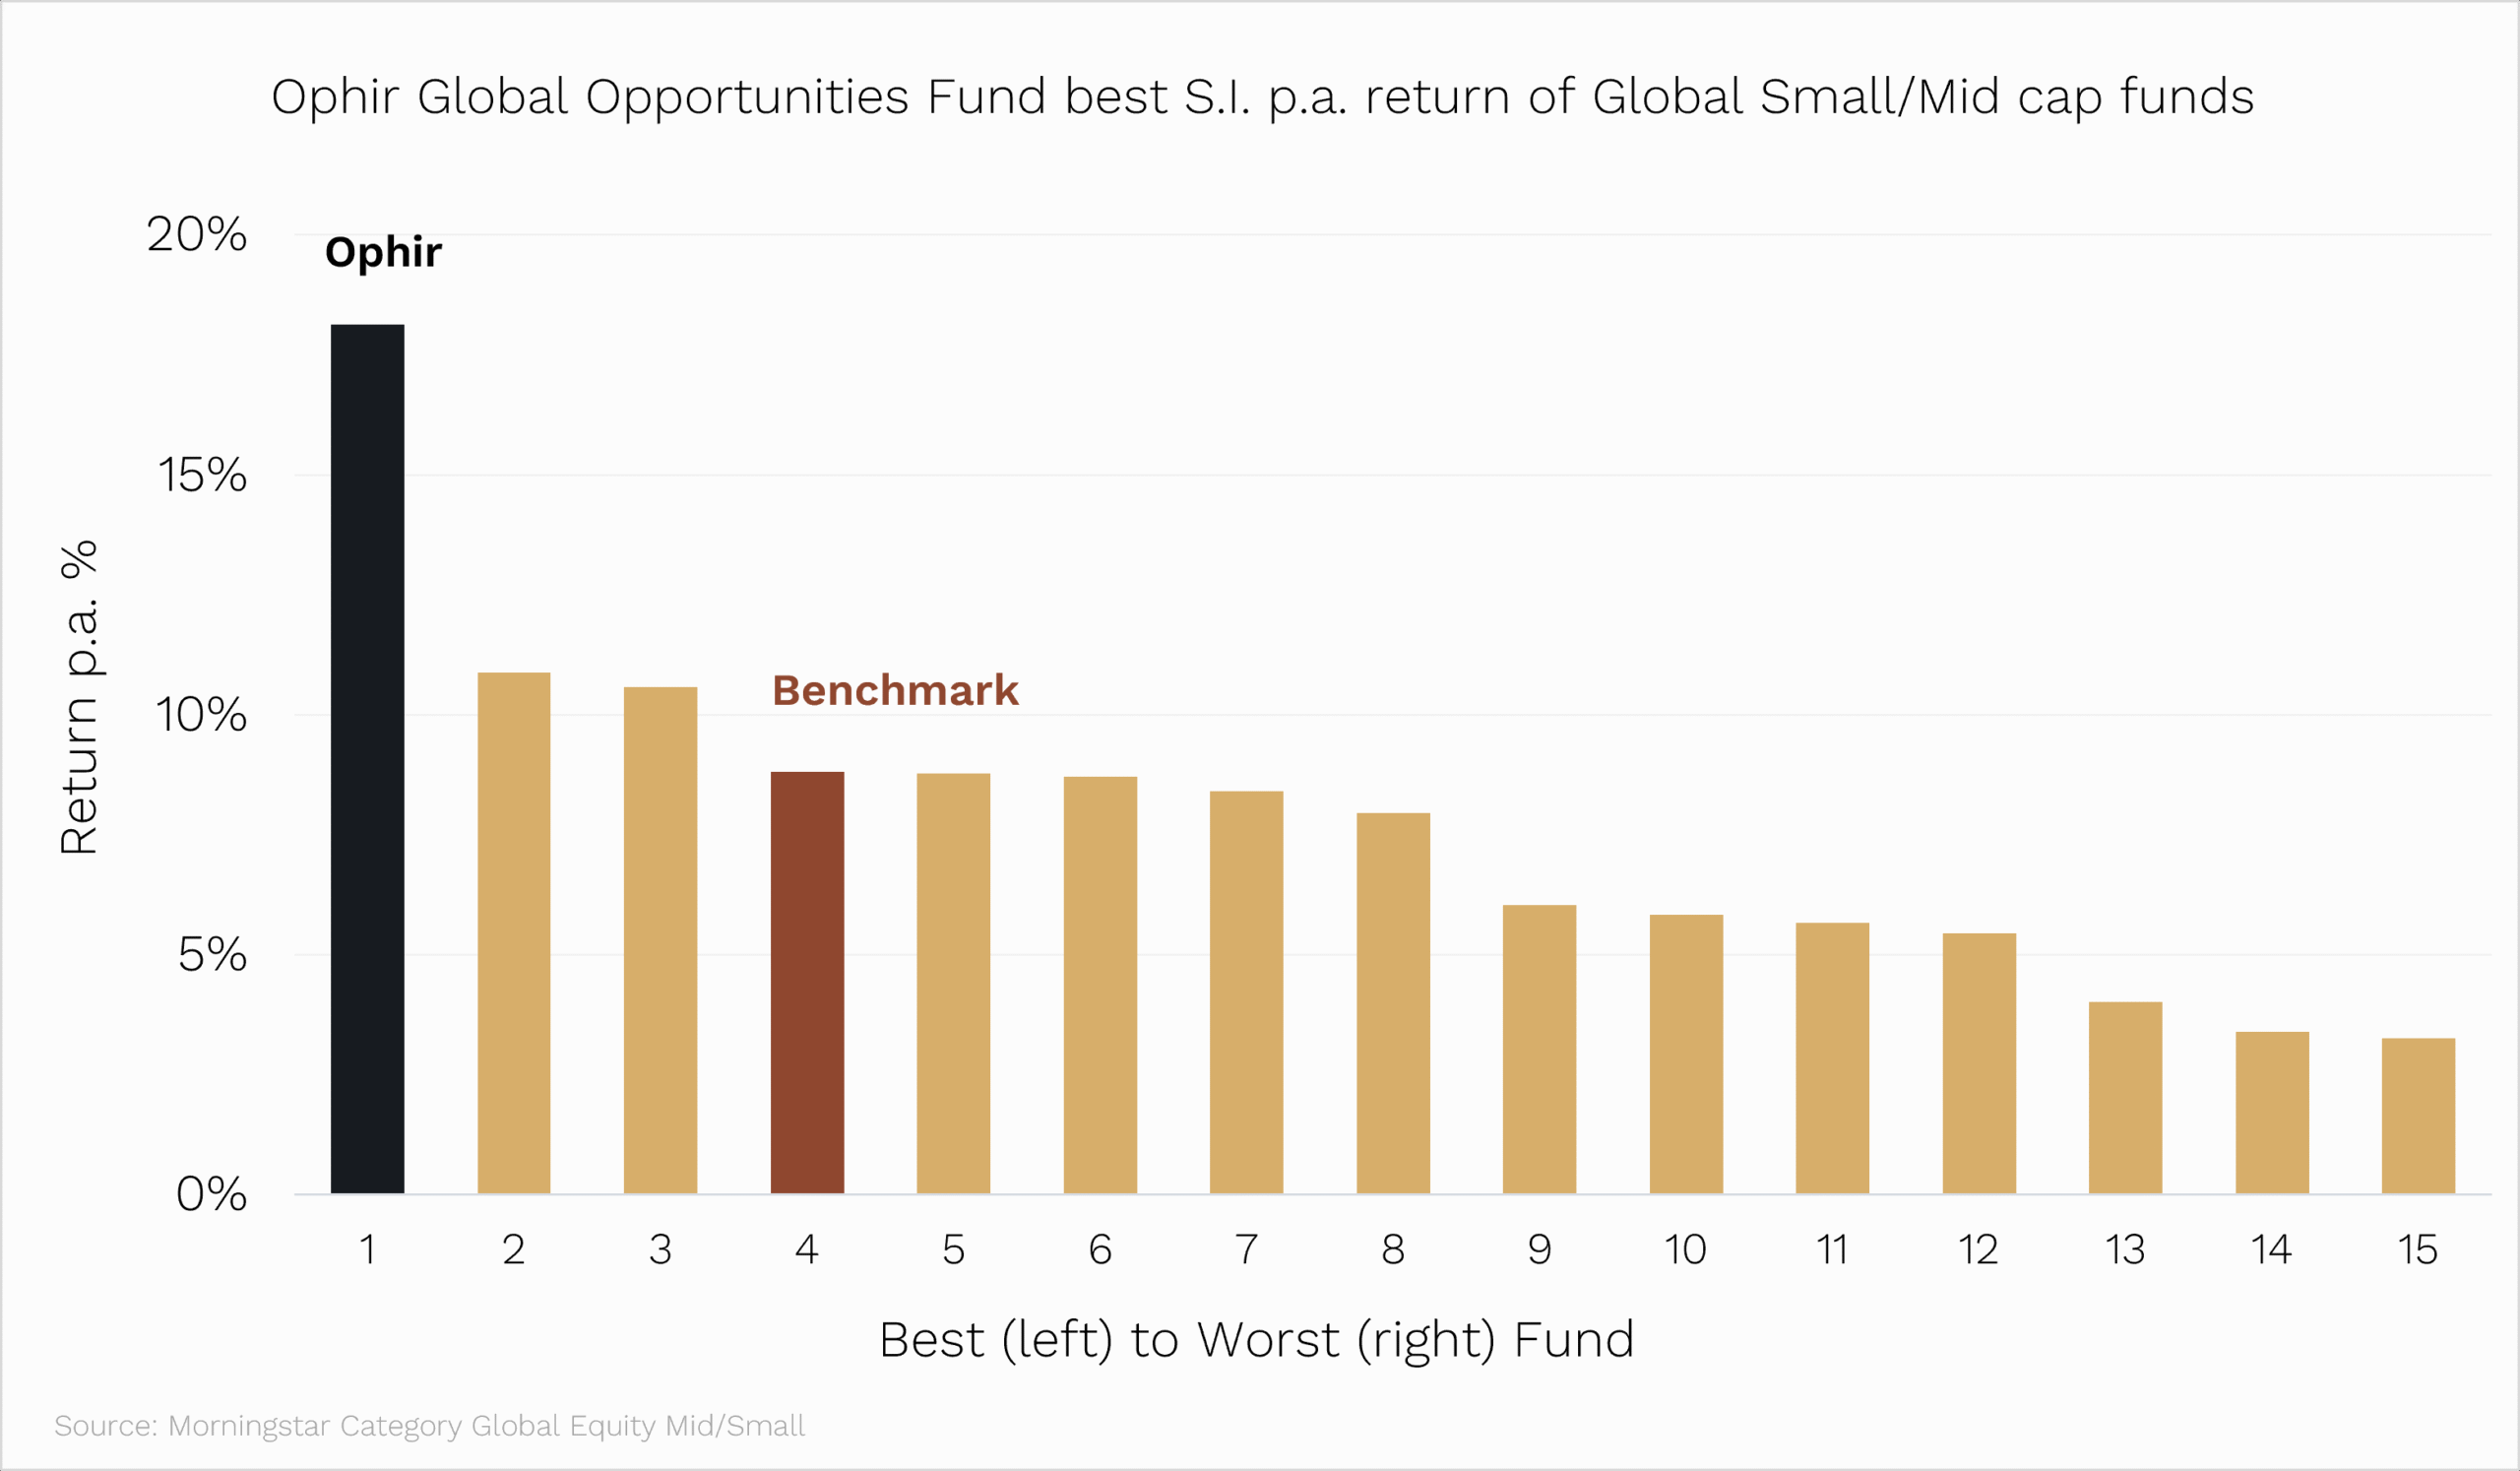
For those unfamiliar, the Global Opportunities Fund has the same investment process and is run in a similar fashion to our Ophir Opportunities Fund, just in global small caps not Aussie small caps.
It also shares many of the same investment analysts and portfolio managers who have worked on the Ophir Opportunities Fund.
But while the Australian Ophir Opportunities Fund remains closed to new money at capacity, as it has been since 2015, the Ophir Global Opportunities Fund remains open.
However, to give ourselves the best chance of outperforming over the long term, in the not-too-distant future the Global Opportunities Fund may ‘soft close’ to new investors and advice groups. The reality is a month like April does chew through capacity and brings forward the date we’ll have to close the fund to those new investors.
The fund remains open and any decision regarding ‘soft close’ will be communicated in advance.
How Ophir is generating outperformance with no big skew to ‘hot’ themes or sectors
There is no getting around the fact that when it comes to investing, the hottest ticket in town is Artificial Intelligence (AI).
We use it in our business, and it can do wonderful things. Almost all the CEOs we talk to have a plan to implement it across their businesses.
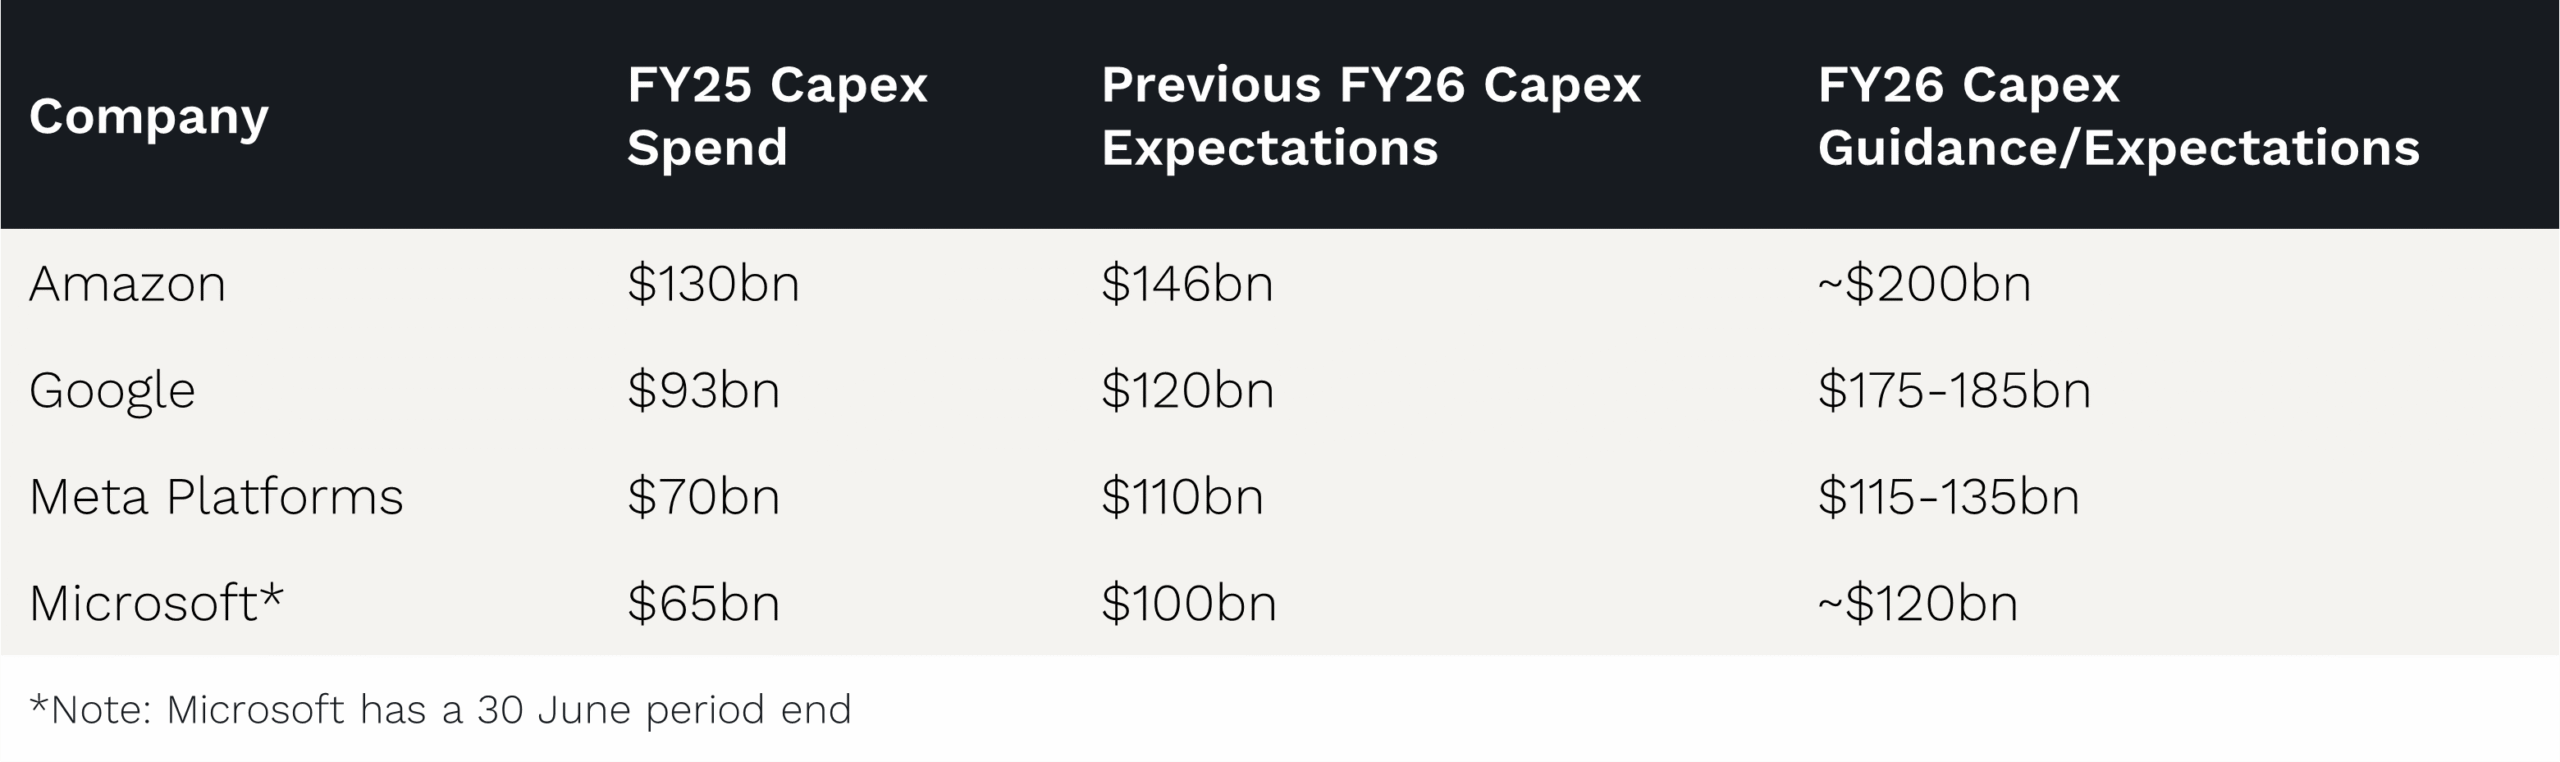
The capex cycle behind this new technology is literally unprecedented. The current data centre build out eclipses the inflation-adjusted spend of every other megaproject in U.S. history, from the railroads, interstate highways, the Apollo Program, and the Manhattan Project.
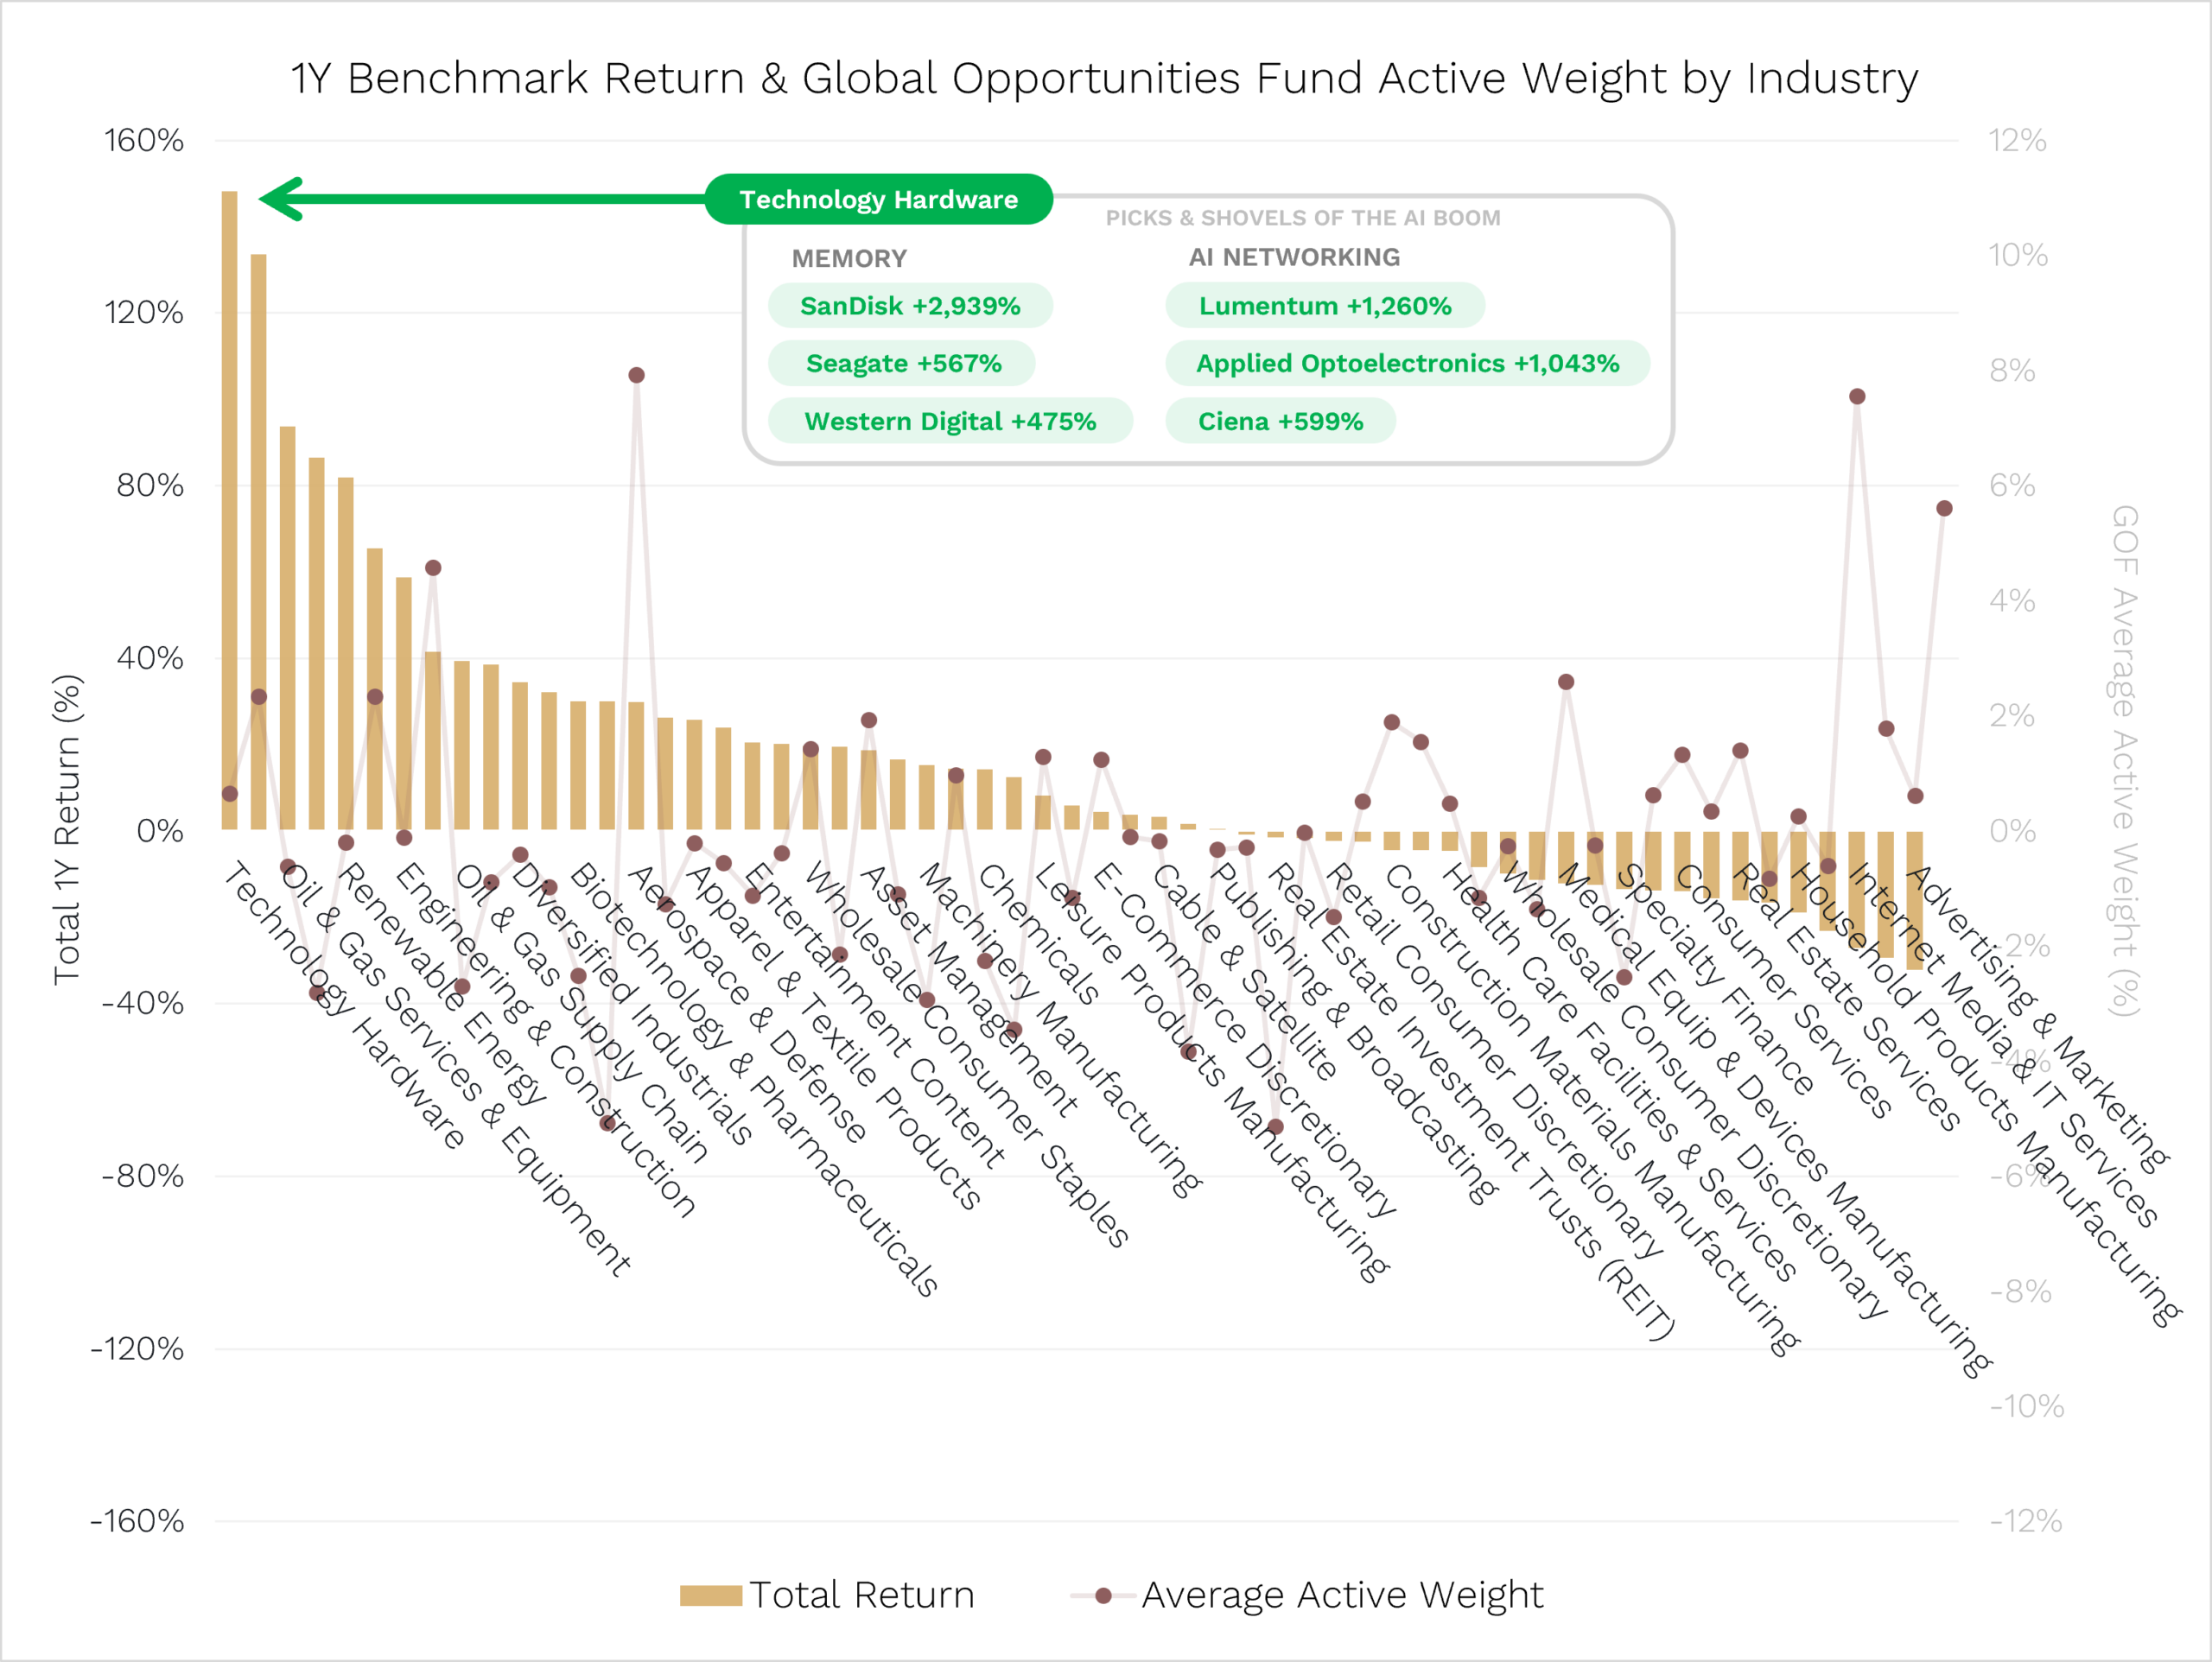
Below, we have aggregated the 5,000-odd global small and mid-cap stocks in the MSCI World SMID Cap Index (our Global Opportunities Fund’s benchmark) into 60 industry groups.
We then show the share price performance of each industry group over the year to the end of April from best (‘Technology Hardware up 148%’) to worst (‘Advertising and Marketing down -32.1%’).
Source:Bloomberg.
Why has the technology hardware industry sector killed it over the last year?
Because it’s the picks and shovels of the AI boom. Two major sub-sectors of Technology Hardware are:
- Memory stocks, like SanDisk, Seagate and Western Digital.
- AI networking stocks, including Lumentum, Applied Optoelectronics and Ciena.
Each of these stocks is up 5x or more over the last year.
SanDisk is up a crazy 2,939%. That means a $100 investment a year ago would be worth $3,039 today.
To put that in perspective, if you had a 30-stock portfolio with $100 in each and 29 didn’t go anywhere and were worth $100 still at the end of the year but the 30th stock was SanDisk, your portfolio return for the year would be 98%! That can hide a lot of sins in the rest of your portfolio![2]
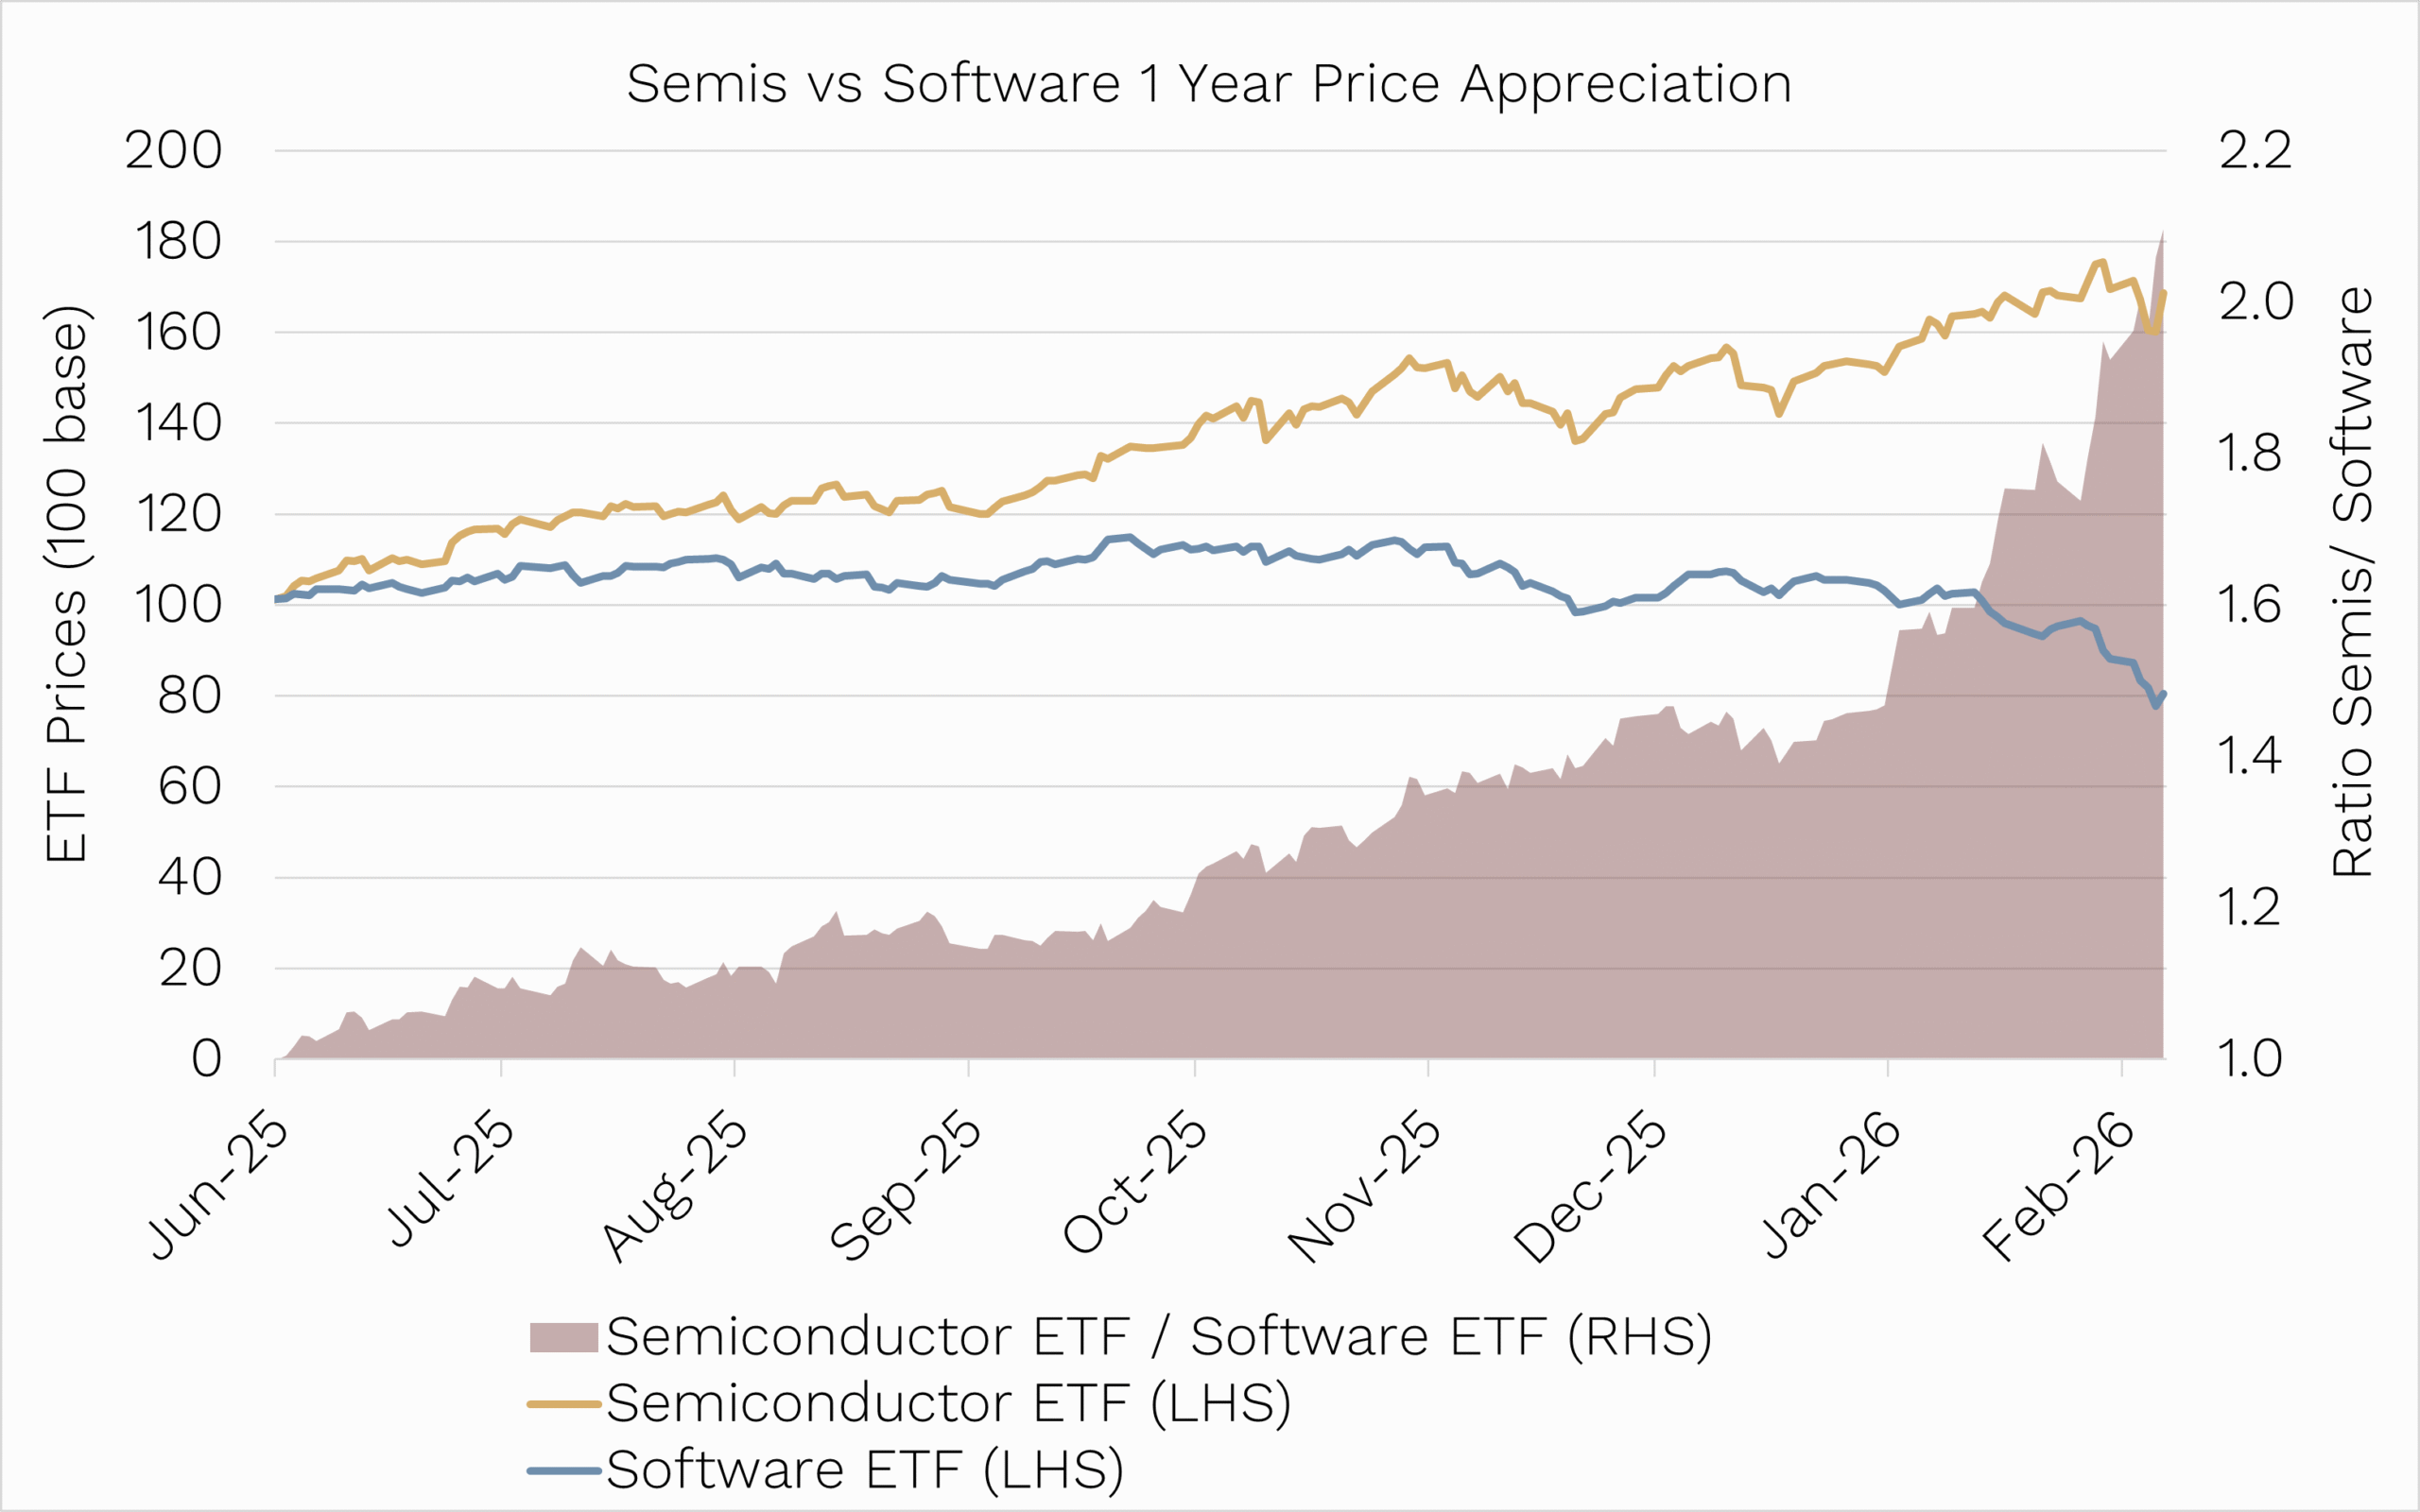
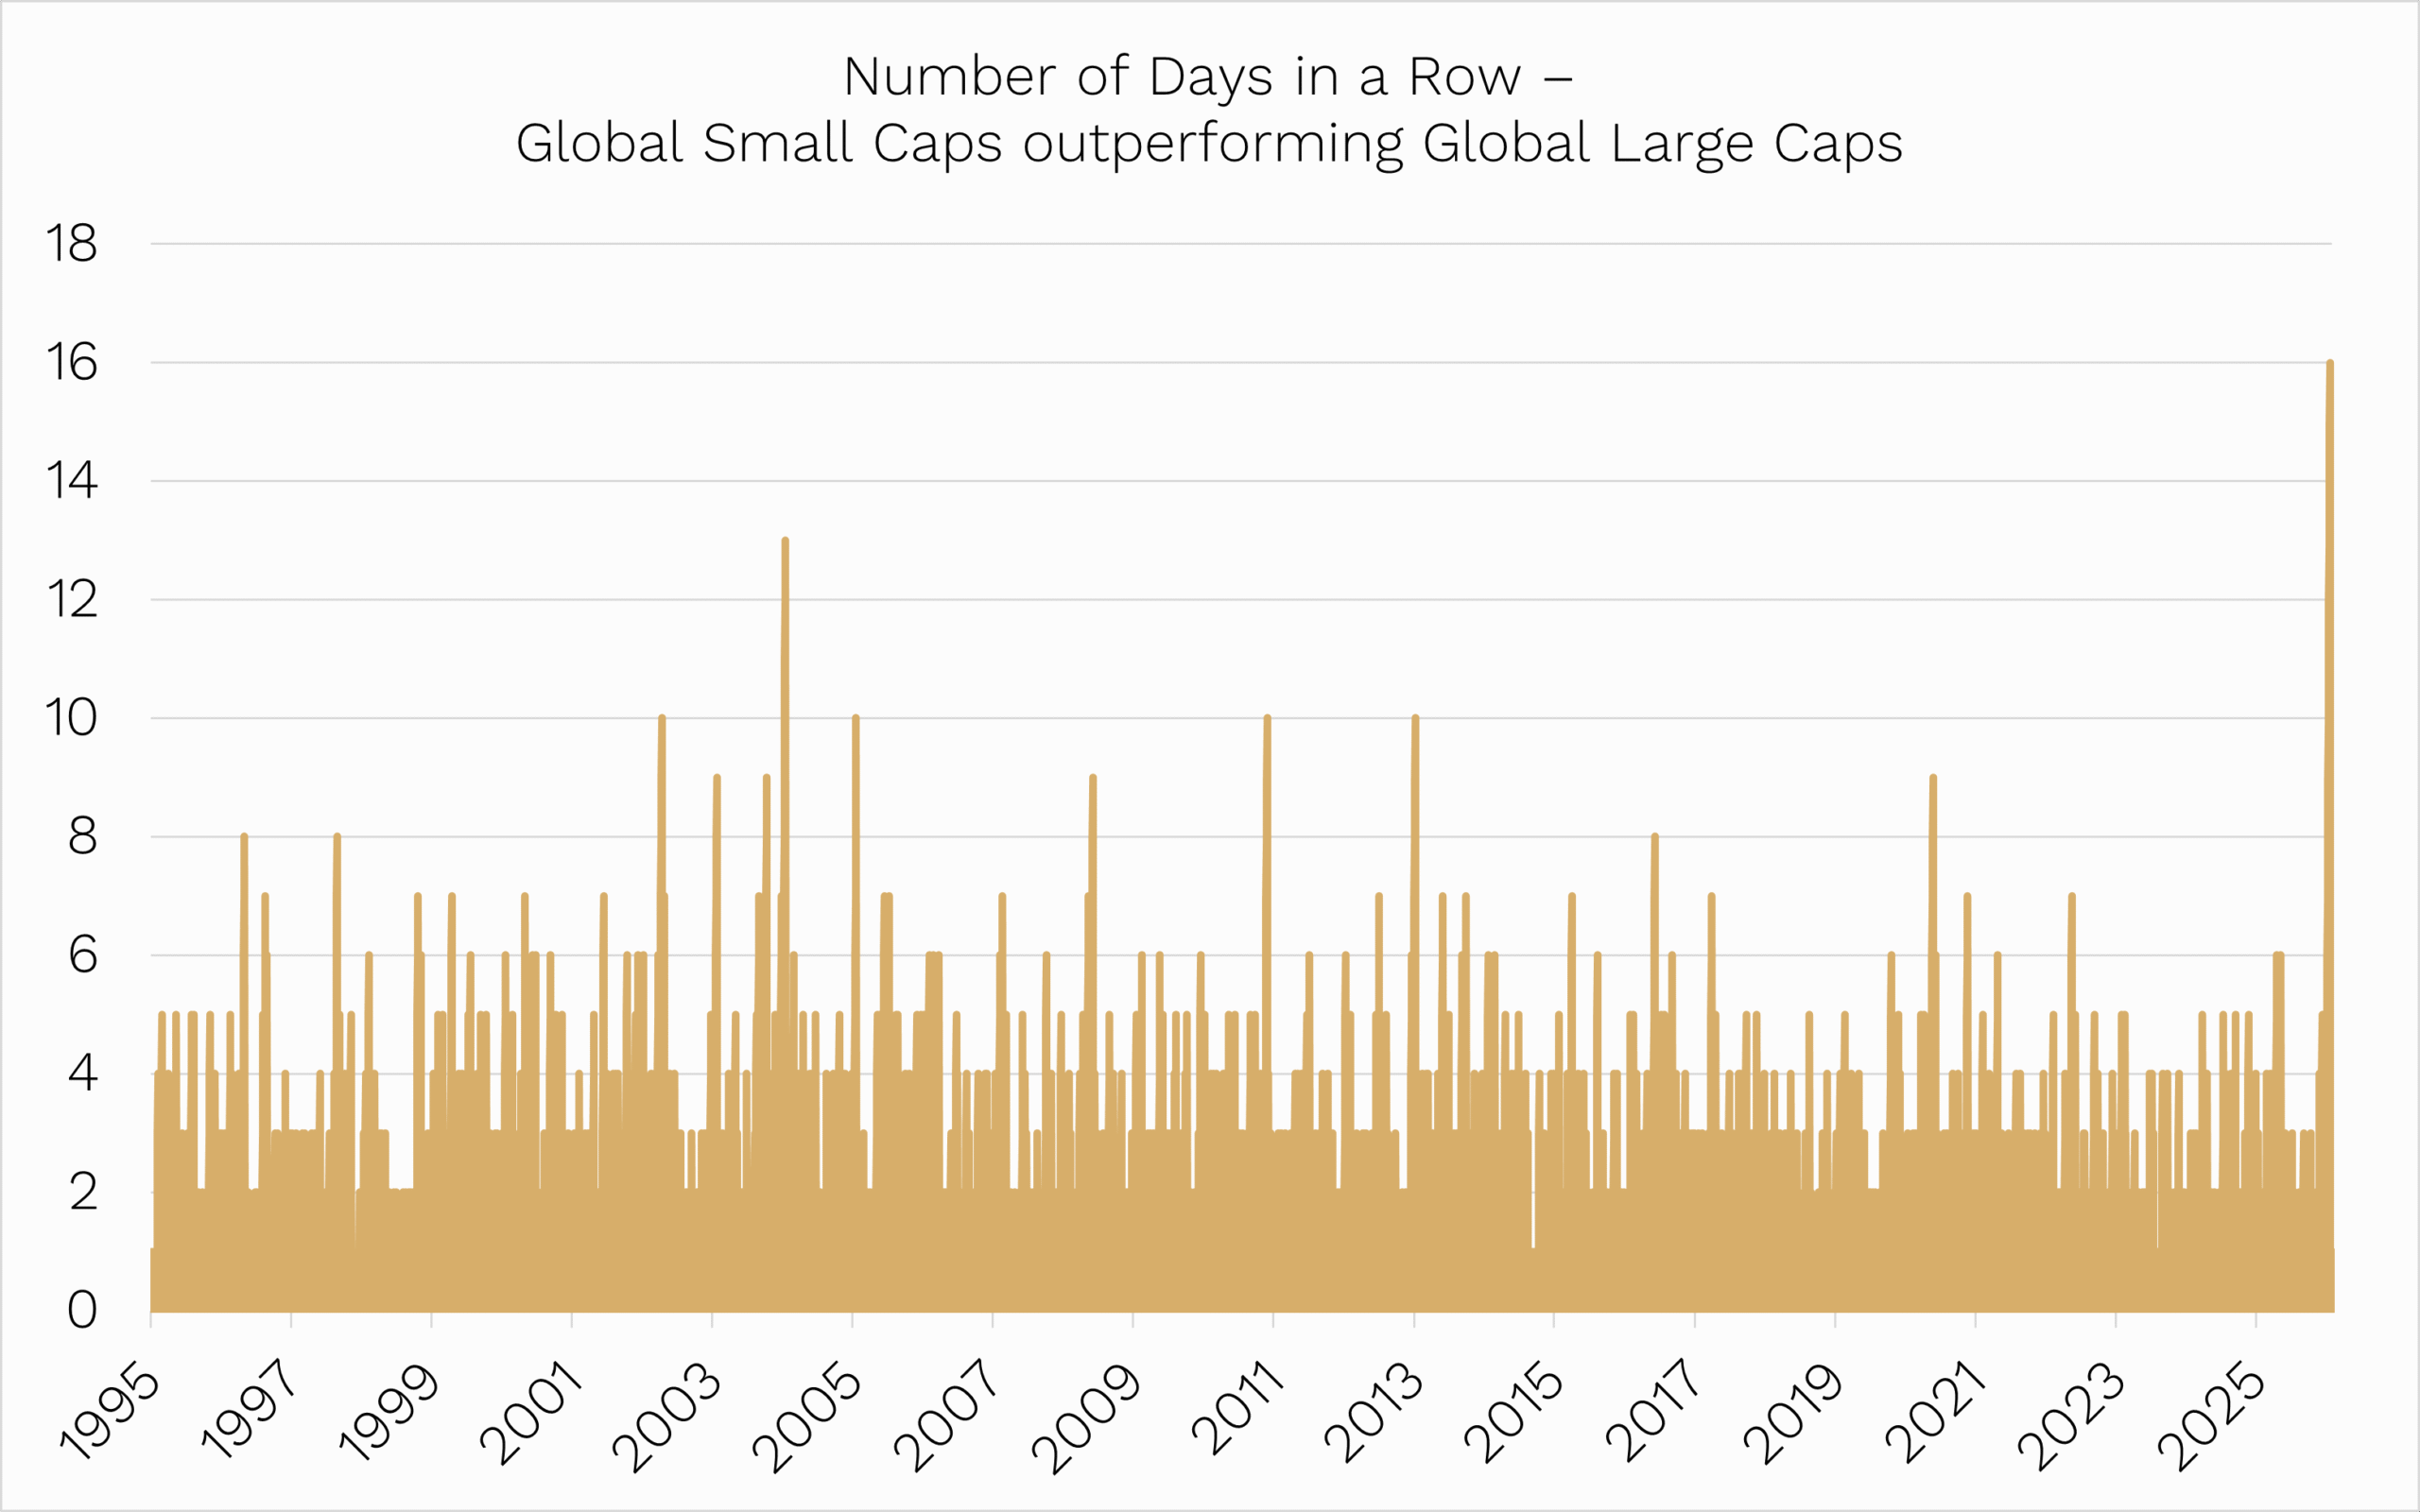
Semiconductor stocks are also on a tear.
As measured by the SOX Index, semiconductors gained for 18 days straight in April. That’s the longest streak ever.
The ratio of the SOX Index to the S&P 500 is now well past the highs seen during the early-2000s dot-com bubble.
We are content as stock pickers
The problem with the ‘just buy big AI beneficiaries’ stocks is that while they have a lot of momentum, we can’t completely write off the possibility of an overbuild. And at some point, the popping of an AI bubble.
At Ophir we are not trying to ride big thematics with big overweight positions to them. If you are good at doing that, then play in large caps or run a macro hedge fund running tens of billions of dollars where you are not constrained by the capacity and liquidity issues that feature in small caps.
We are picking stocks with idiosyncratic drivers of their earnings.
We do have some exposure to the AI thematic, but we are not massively over-indexed to it. You can see this in the red line of the chart above, which shows our over- or underweight position compared to the benchmark weight in each of the 60 industries.
None of our over- or underweight positions is that big.
Our Global Opportunities Fund has returned a strong 32.9% over the year to the end of April … without having any big overweight position in the industries (most of them AI-related) that have shot the lights out over the last year.
We like that.
We think it means we don’t have to rely on trying to time a certain thematic that has a lot more eyeballs on it.
We’re content picking stocks, not themes, because it means we will have lots of diverse drivers of earnings growth in our Funds. And it means we’re not putting performance at risk if the share prices of stocks exposed to a big thematic reverse at some point, as we’ve seen time and again throughout history.
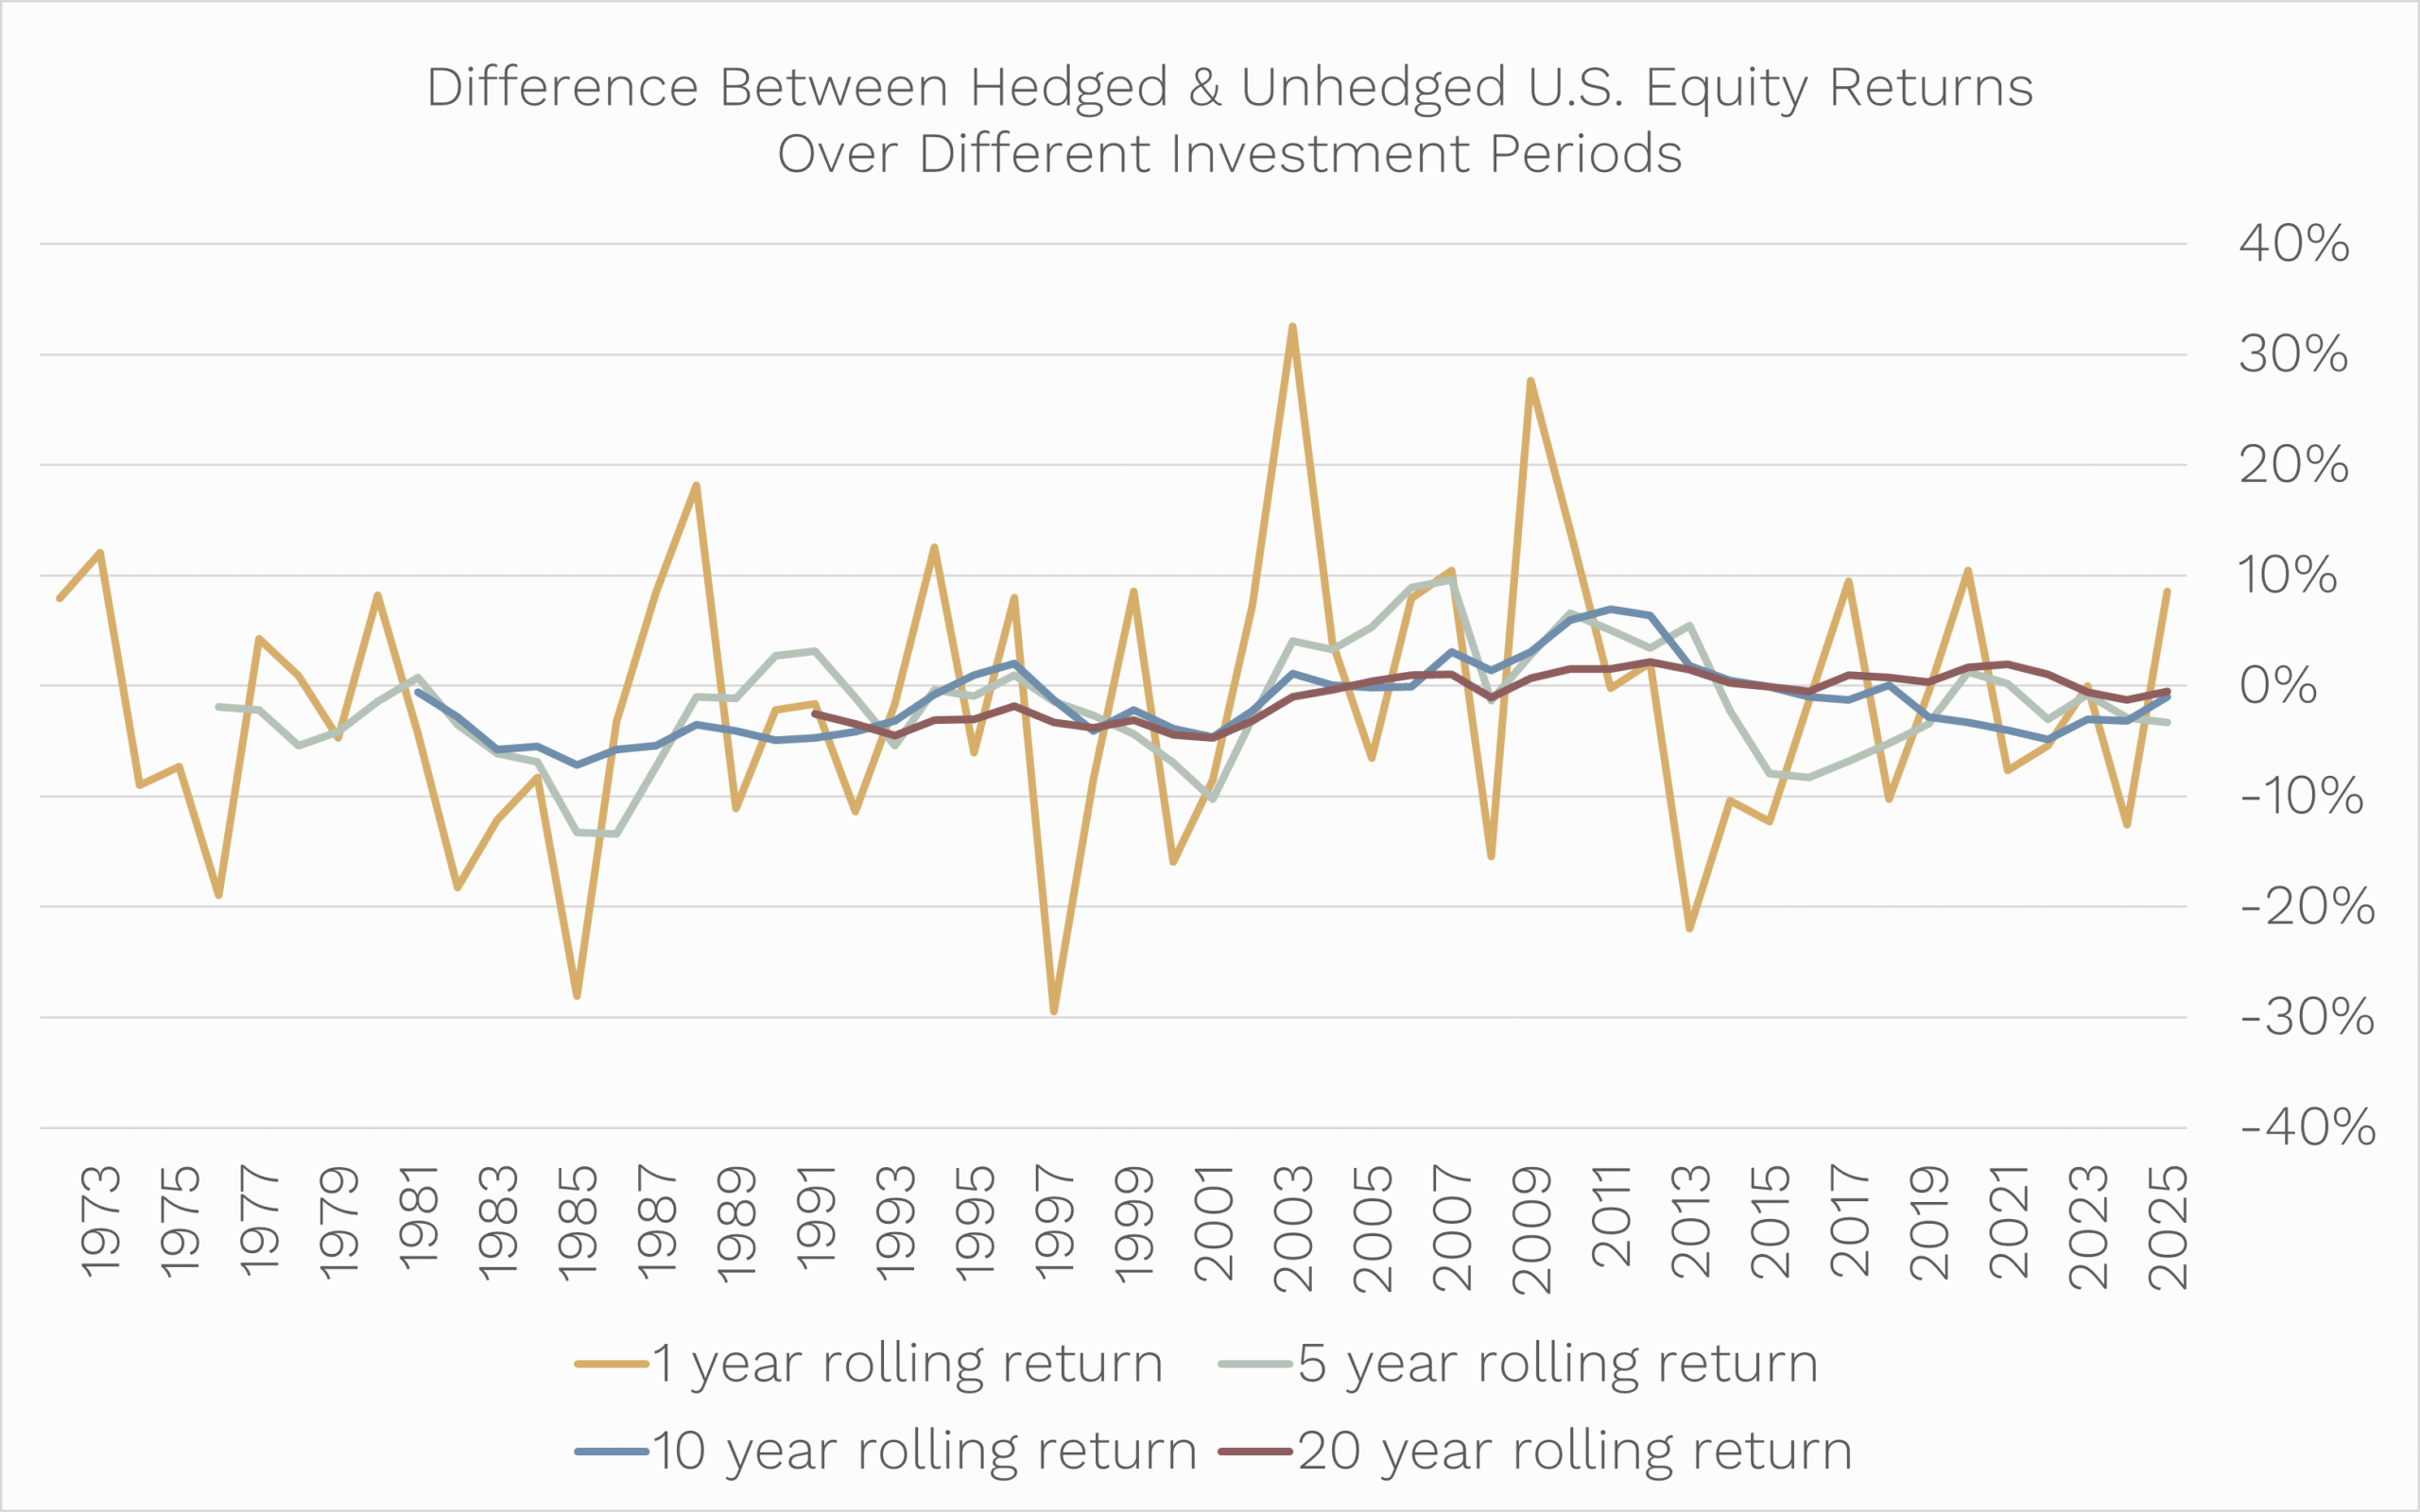
[1] For those investors worried about any further appreciation in the Australian dollar our Global Opportunities Fund also has a currency-hedged version available (here).
[2] Admittedly SanDisk would have gone from 3.33% of your portfolio to over 50% of it by the end of the year and unless you had a cast-iron stomach would have sold down the holding before it reached half of your portfolio.
As always, if you’d like to chat to us about any of the Funds, please feel free to call us on (02) 8188 0397 or email us at ophir@ophiram.com.
Thank you for entrusting your capital with us.
Kindest regards,


Andrew Mitchell & Steven Ng
Co-Founders & Senior Portfolio Managers
Ophir Asset Management
This document has been prepared by Ophir Asset Management Pty Ltd (ABN 88 156 146 717, AFSL 420082) (“Ophir”) and contains information about one or more managed investment schemes managed by Ophir (the “Funds”) as at the date of this document. The Trust Company (RE Services) Limited ABN 45 003 278 831, the responsible entity of, and issuer of units in, the Ophir High Conviction Fund (ASX: OPH), the Ophir Global Opportunities Fund and the Ophir Global High Conviction Fund. Ophir is the trustee and issuer of the Ophir Opportunities Fund.
This is general information only and is not intended to provide you with financial advice and does not consider your investment objectives, financial situation or particular needs. You should consider your own investment objectives, financial situation and particular needs before acting upon any information provided and consider seeking advice from a financial advisor if necessary. Before making an investment decision, you should read the relevant Product Disclosure Statement (“PDS”) and Target Market Determination (“TMD”) available at www.ophiram.com or by emailing Ophir at ophir@ophiram.com. The PDS does not constitute a direct or indirect offer of securities in the US to any US person as defined in Regulation S under the Securities Act of 1993 as amended (US Securities Act).
All Ophir Funds are deemed high risk within their respective Target Market Determination documentation. Ophir does not guarantee the performance of the Funds or return of capital. An investment may achieve a lower than expected return and investors risk losing some or all of their principal investment. Past performance is not a reliable indicator of future performance. Any opinions, forecasts, estimates or projections reflect our judgment at the date of this was prepared, and are subject to change without notice. Rates of return cannot be guaranteed and any forecasts, estimates or projections as to future returns should not be relied on, as they are based on assumptions which may or may not ultimately be correct.
Actual returns could differ significantly from any forecasts, estimates or projections provided.
The Trust Company (RE Services) Limited is a part of the Perpetual group of companies. No company in the Perpetual Group (Perpetual Limited ABN 86 000 431 827 and its subsidiaries) guarantees the performance of any fund or the return of an investor’s capital.