By Andrew Mitchell & Steven Ng
Co-founders and Senior Portfolio Managers

In our March 2021 Letter to Investors we take a look at how equity markets are currently digesting higher bond yields and how corporate earnings will now likely be relied upon to drive the next leg of market growth.
Dear Fellow Investors,
Welcome to the March 2021 Ophir Letter to Investors – thank you for investing alongside us for the long term.
Battling the Bondcano: Why equities didn’t get burnt by bonds in March
Our friend Hasan Tevfik from research house MST Marquee has dubbed the recent rapid increase in US bond yields, the ‘Bondcano’, such was the speed and severity of the move.
But in March the heat from the Bondcano didn’t flow over and trigger an equity market meltdown. Indeed, most regions and countries posted sizeable gains during the month (see chart below).
Global Markets | 1-Month
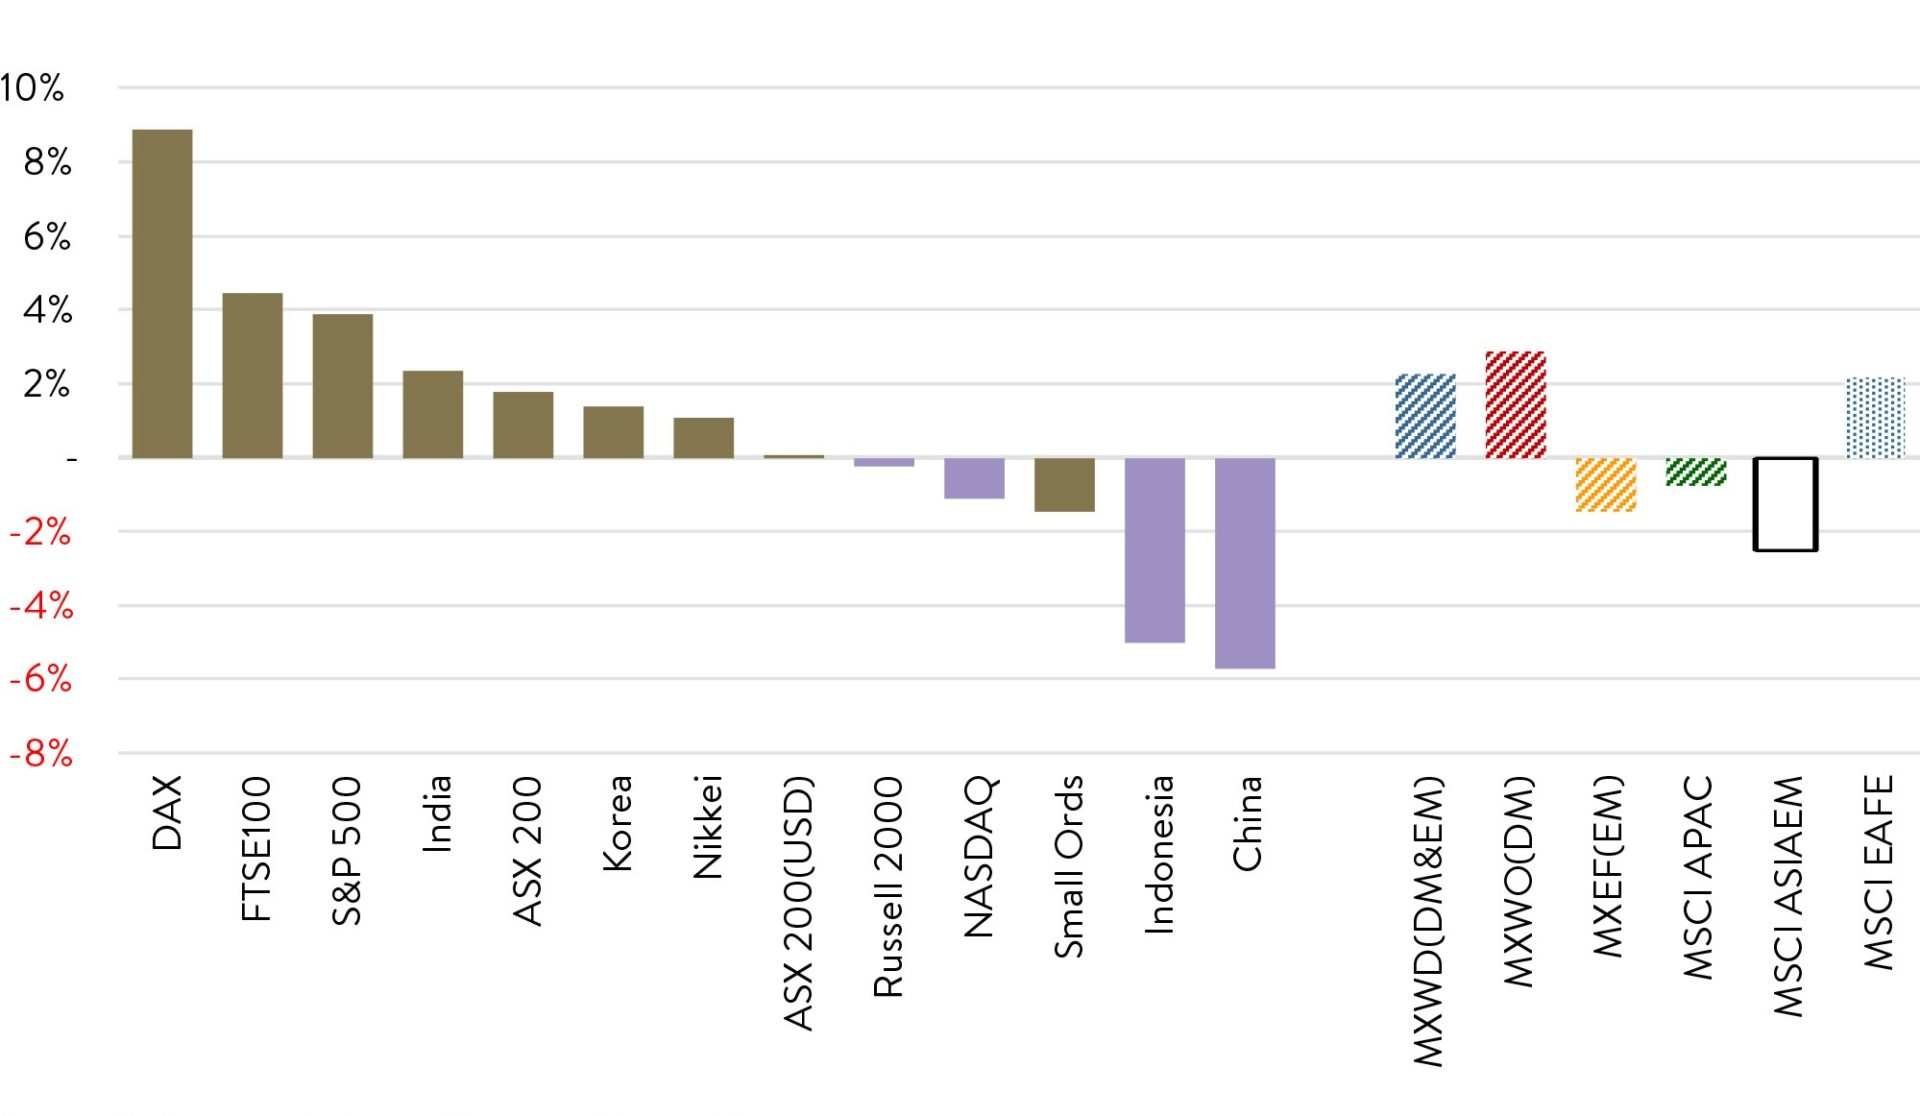
Source: J.P. Morgan calculations, Bloomberg Finance L.P.
As you can see, the US share market continued its charge, hitting fresh new highs in March.
The US sharemarket performance was particularly impressive given US 10-year treasury yields increased sharply again by 0.34% over March to 1.74%, taking the recent rise in yields over 1.2% from its low in August last year.
But equity investors were emboldened by the Federal Reserve, who continued to peddle their lower-for-longer interest rate mantra that has whipped markets into a frenzy since March last year.
Investors also liked President Biden’s enormous U$1.9 trillion stimulus plan, that was approved during the month, which will also be like a shot of adrenaline into the veins of the US consumer.
In fact, as a result, many economists have recently revised up output forecasts this year for the US economy to incredibly above its predicted trajectory pre-COVID! Talk about governments not wasting a crisis.
For now, despite the Bondcano, equity investors are loving the combination of reopening economies courtesy of vaccine distribution, pent up consumer demand, lower -for-longer central bank policy rates and loose ‘war time’ sized fiscal policy.
This has seen record-breaking inflows into equity funds globally over the March quarter, reversing all the outflows that occurred over the last 1 to 2 years.
Record inflows into equity funds since the beginning of the year
Based on weekly data
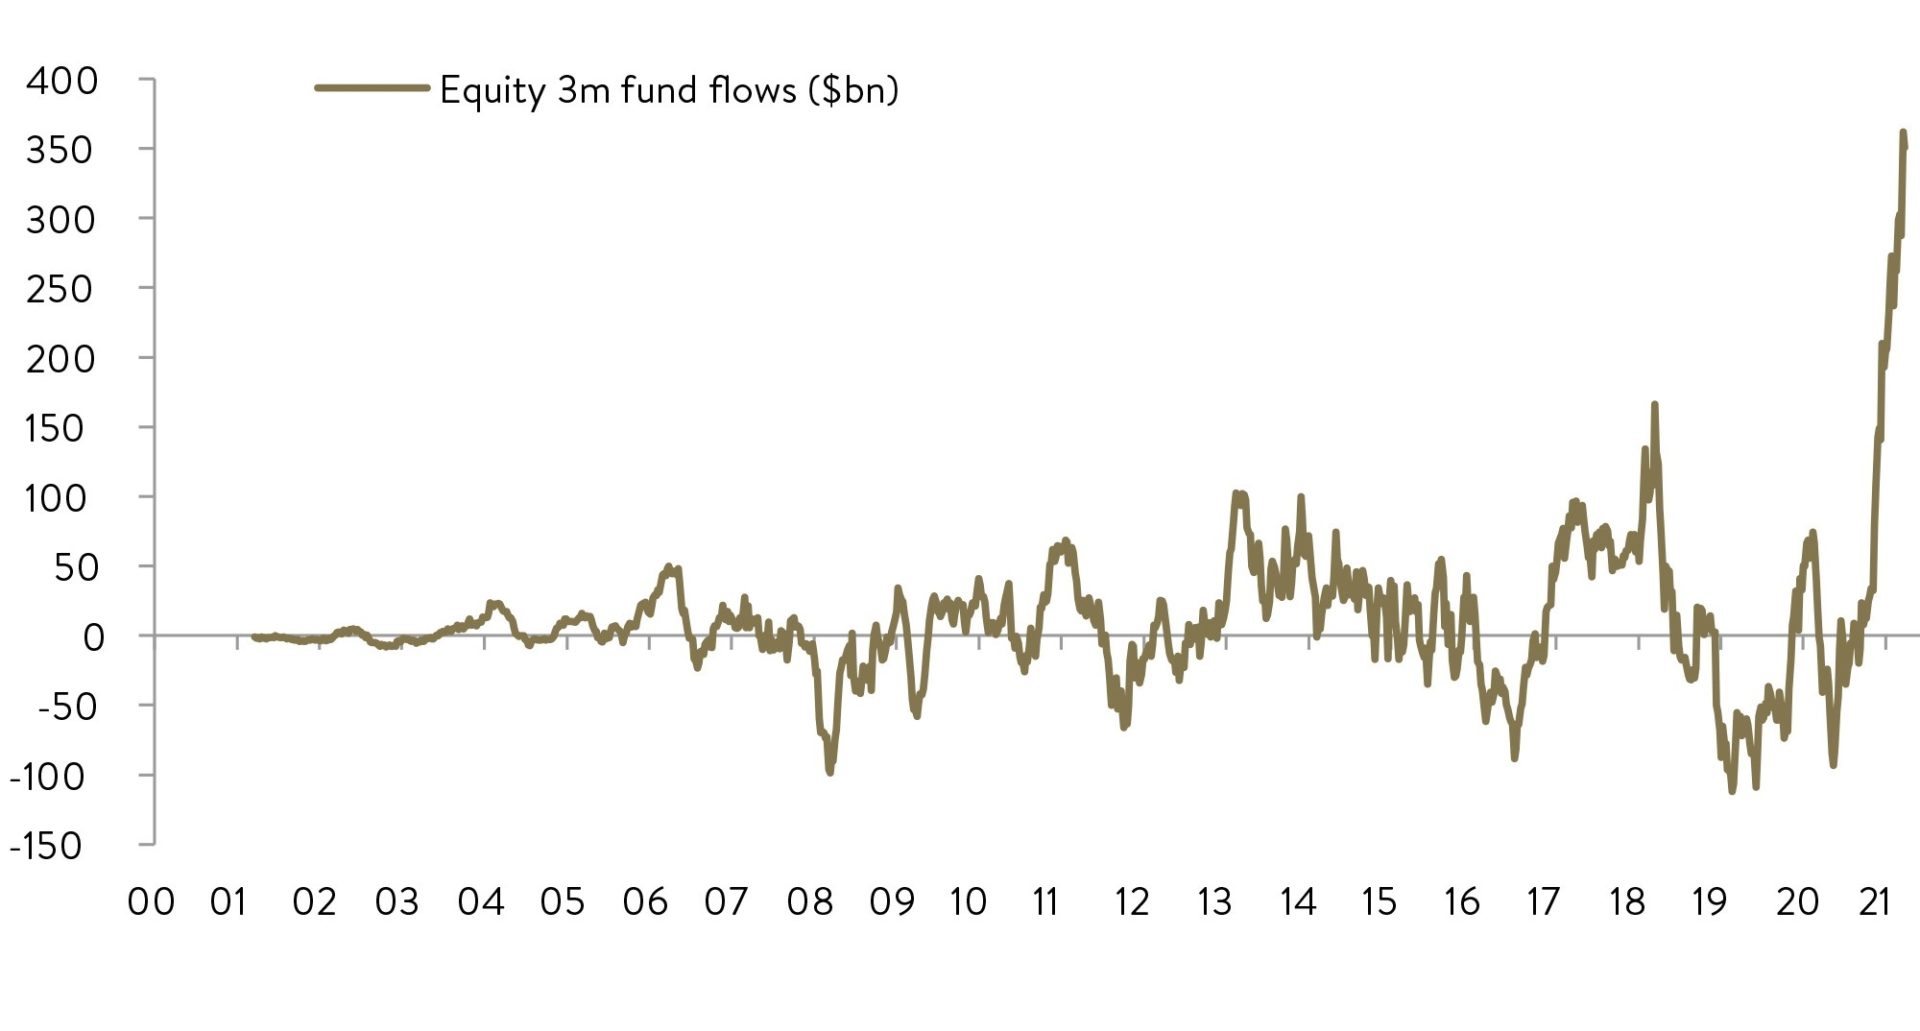
Source: Bloomberg, Haver, EPFR, Datastream, Goldman Sachs Global Investment Research
The Ophir Opportunities Fund returned -3.6% net of fees in March, underperforming its benchmark which returned +0.8% and has delivered investors +24.6% p.a. post fees since inception (August 2012).
Download Ophir Opportunities Fund Factsheet
The Ophir High Conviction Fund investment portfolio returned +0.4% net of fees in March, underperforming its benchmark which returned +1.7% and has delivered investors +18.5% p.a. post fees since inception (August 2015). ASX:OPH provided a total return of -2.0% for the month.
Download Ophir High Conviction Fund Factsheet
The Ophir Global Opportunities Fund returned +5.0% net of fees in March, outperforming its benchmark which returned +3.9% and has delivered investors +43.5% p.a. post fees since inception (October 2018).
Download Ophir Global Opportunities Fund Factsheet
Aussie equities battle ahead
But as you can also see in the performance table above, the Australian sharemarket soldiered on higher in March, but underperformed most of its developed market peers, particularly in the small caps space.
The local market suffered from its higher exposure to falling commodity prices, with iron ore (-5.4%), nickel (-13.5%), gold (-1.5%), Brent oil (-3.9%) and natural gas (-5.3%) all pulling back.
The commodity correction offset the fact that the Australian government bond yield actually took a breather during March – which should have been a boost for equities – with the yield falling -0.13% to 1.79% as the RBA accelerated its QE program to smooth volatile trading in bond markets and to put some more downward pressure on the AUD (see charts below).
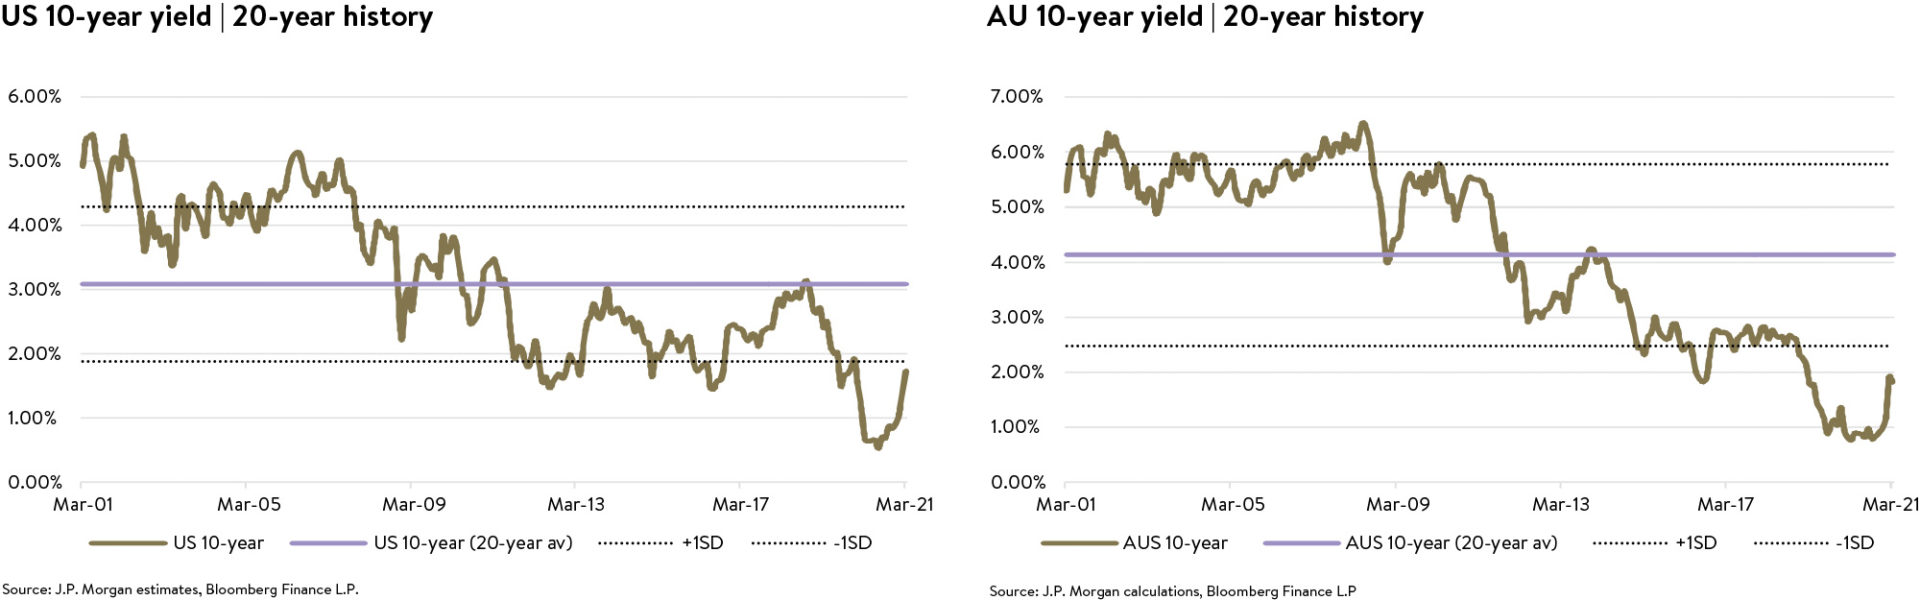
March’s drift lower in Australian bond yields almost totally wiped out the difference between US and Australian 10-year rates by month end.
From hope to growth: So where are we in the market cycle?
But despite equity markets generally shrugging off the Bondcano in March, bond yields still loom as a factor as we look ahead.
We still see long-term bond yields likely having further to climb as growth and inflation improves throughout developed economies in 2021. We see yields potentially testing pre-COVID cyclical highs of 2.5-3% over the next couple of years for Australian and US 10-year yields.
With bond yields and global growth at an inflection point (many economies now coming out of recession), sensible investors have no doubt been asking themselves recently whether we are at the start of a new market cycle? Or are we at the end of an old one that has just been delayed by COVID?
We think the below Despair-Hope-Growth-Optimism cycle stylised by Goldman Sachs is a helpful way to think about this question. They break down historical sharemarket returns into four categories:
1. Despair is the initial sharemarket collapse, driven by both falls in earnings per share for corporates, as well as contractions in how much investors are willing to pay for those earnings, as price-to-earnings (PE) ratios shrink on the back of greater investor risk aversion.
2. This fall ultimately gives way to Hope. Here share prices rebound very strongly, driven almost exclusively by expansion in PE ratios as investors see the worst is over for profits, and look ahead with hope to their coming rebound.
3. Next is the Growth phase where the actual rebound in profits is delivered, driving sharemarket returns, but where valuation contraction can create a partially offsetting headwind, as the ebullience of the Hope phase dissipates.
4. Finally, Growth gives way to late-cycle Optimism. This is where overenthusiasm reigns, with valuations again expanding, building on profit growth to drive outsized sharemarket returns, but often sowing the seeds of the next downturn at the same time.
Prudently positive on equities
In the table below, Goldmans have provided the historical market returns for the Asia-Pacific region for the four categories, including their average durations.
Annualized return / PE chg / EPS growth in an equity cycle
Average duration (since 2006)
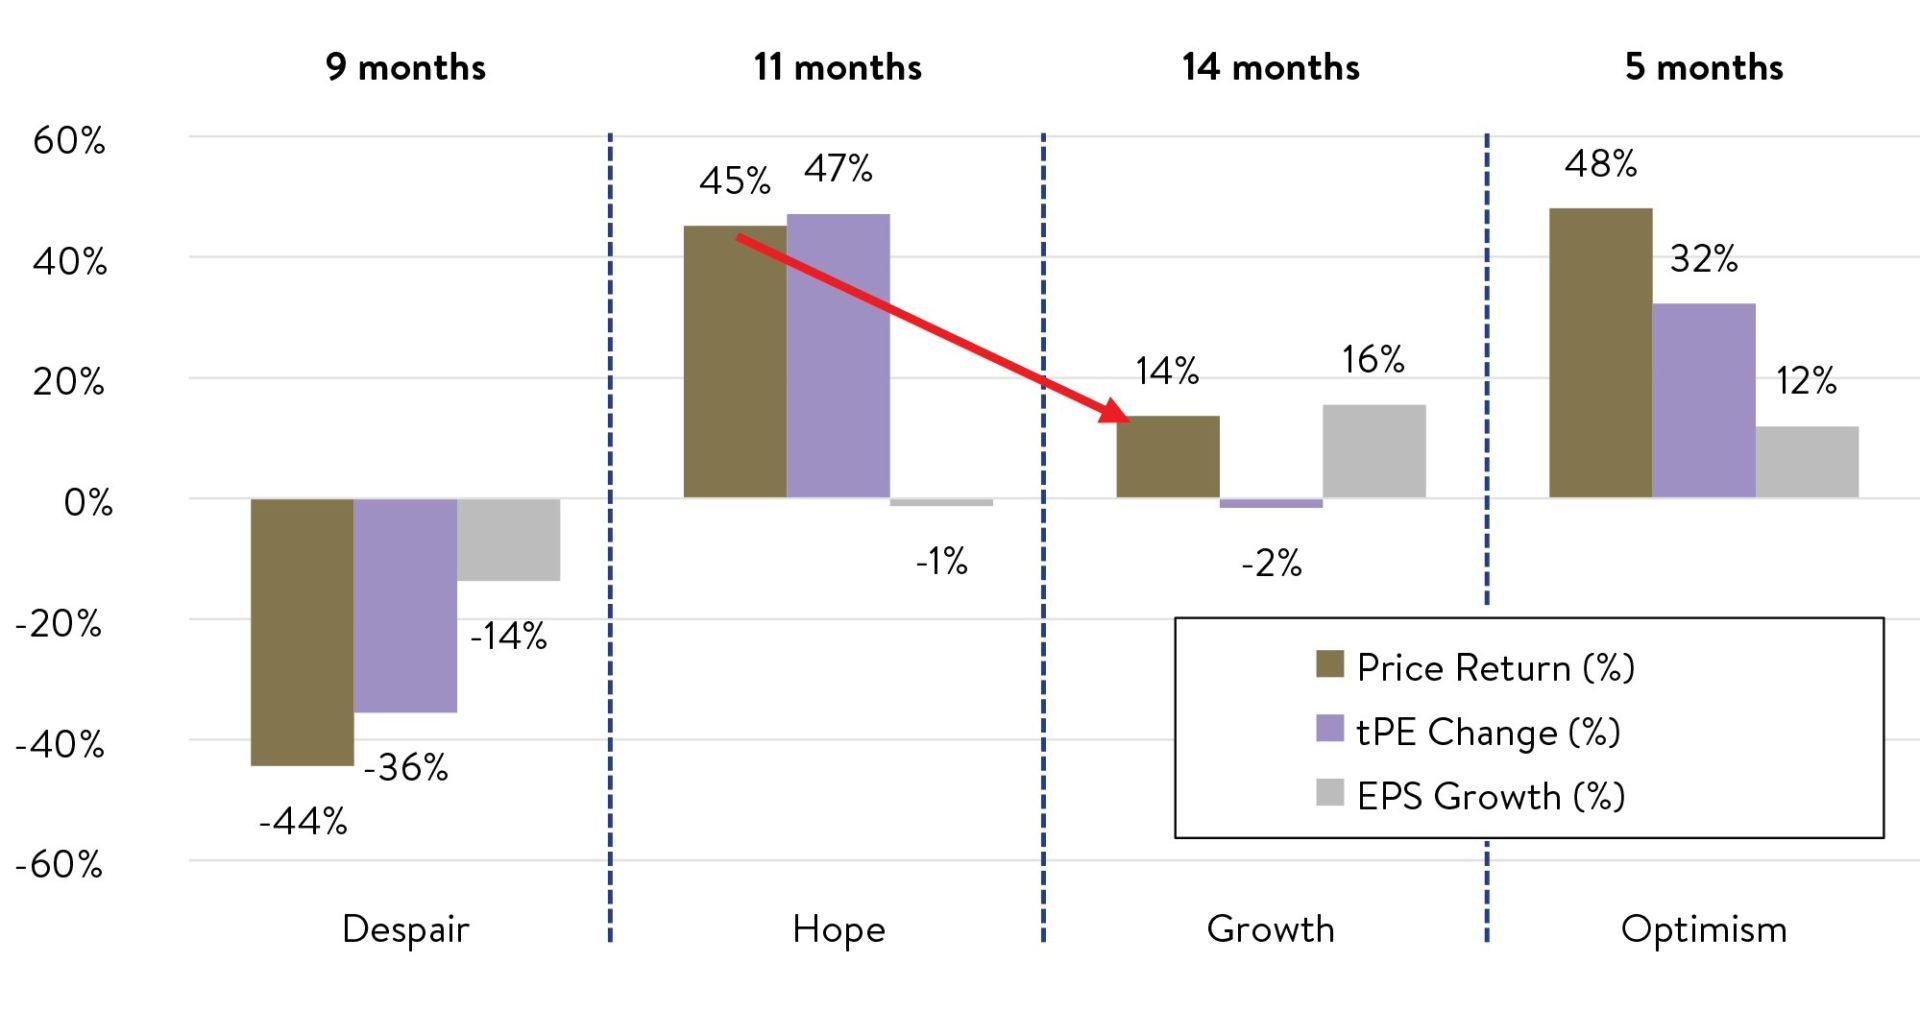
Source: MSCI, FactSet, Goldman Sachs Global Investment Research
As you know, COVID caused a truncated Despair phase that only lasted for around a month in March last year. The subsequent twelve months following March 2020 have been very similar to the Hope phase. And we are now likely entering the Growth stage where sharemarket returns are likely to be lower and almost entirely driven by the rebound in corporate earnings.
But a key differences this time around compared to the above chart is that earnings fell more than usual in the Despair stage, a consequence of the unique and devasting nature of COVID. Earnings per share (EPS) are therefore likely to rebound more in the Growth stage.
We might also expect that valuations (PE ratios) might contract a little more this time around during Growth, given their currently historically stretched level. When and if markets enter an Optimism phase, we may be unlikely to receive the same boost from valuations/PE expansion.
So where does this see us right now? Outside of the usual risk of unforeseen ‘black swans’, corporate earnings are still likely to drive sharemarkets higher. But we wouldn’t be expecting expanding market valuations to be adding more punchbowl to the party – that might have all been drunk already this cycle!
Overall, we believe that we may be starting the Growth phase, but with some particularly late cycle valuations and characteristics, as illustrated by massive participation by individual investors, record equity fund inflows, an influx of IPOs, including through Special Purpose Acquisition Companies (SPACs) – the vehicle de jour – and crypto speculation.
This scenario sees us being positive on the equity market outlook globally, but quite modest in our expectations, with heightened risks of sentiment- driven pull backs.
The good life post-COVID
As investors ponder where we are in the market cycle, they are probably also aware that it is now a little over year since we reached COVID-induced lows for sharemarkets.
So it is worth reflecting on its impact and how far the world, including the investing world, has come.
As seen below, COVID-19 was the third leading cause of death in the US in 2020, after heart disease and cancer. That is a very sobering statistic. It is also one though we can hold out hope won’t be repeated after this year due to the current rapid rollout of vaccines.
Number of deaths for leading causes of death, US, 2015-2020 ͣ
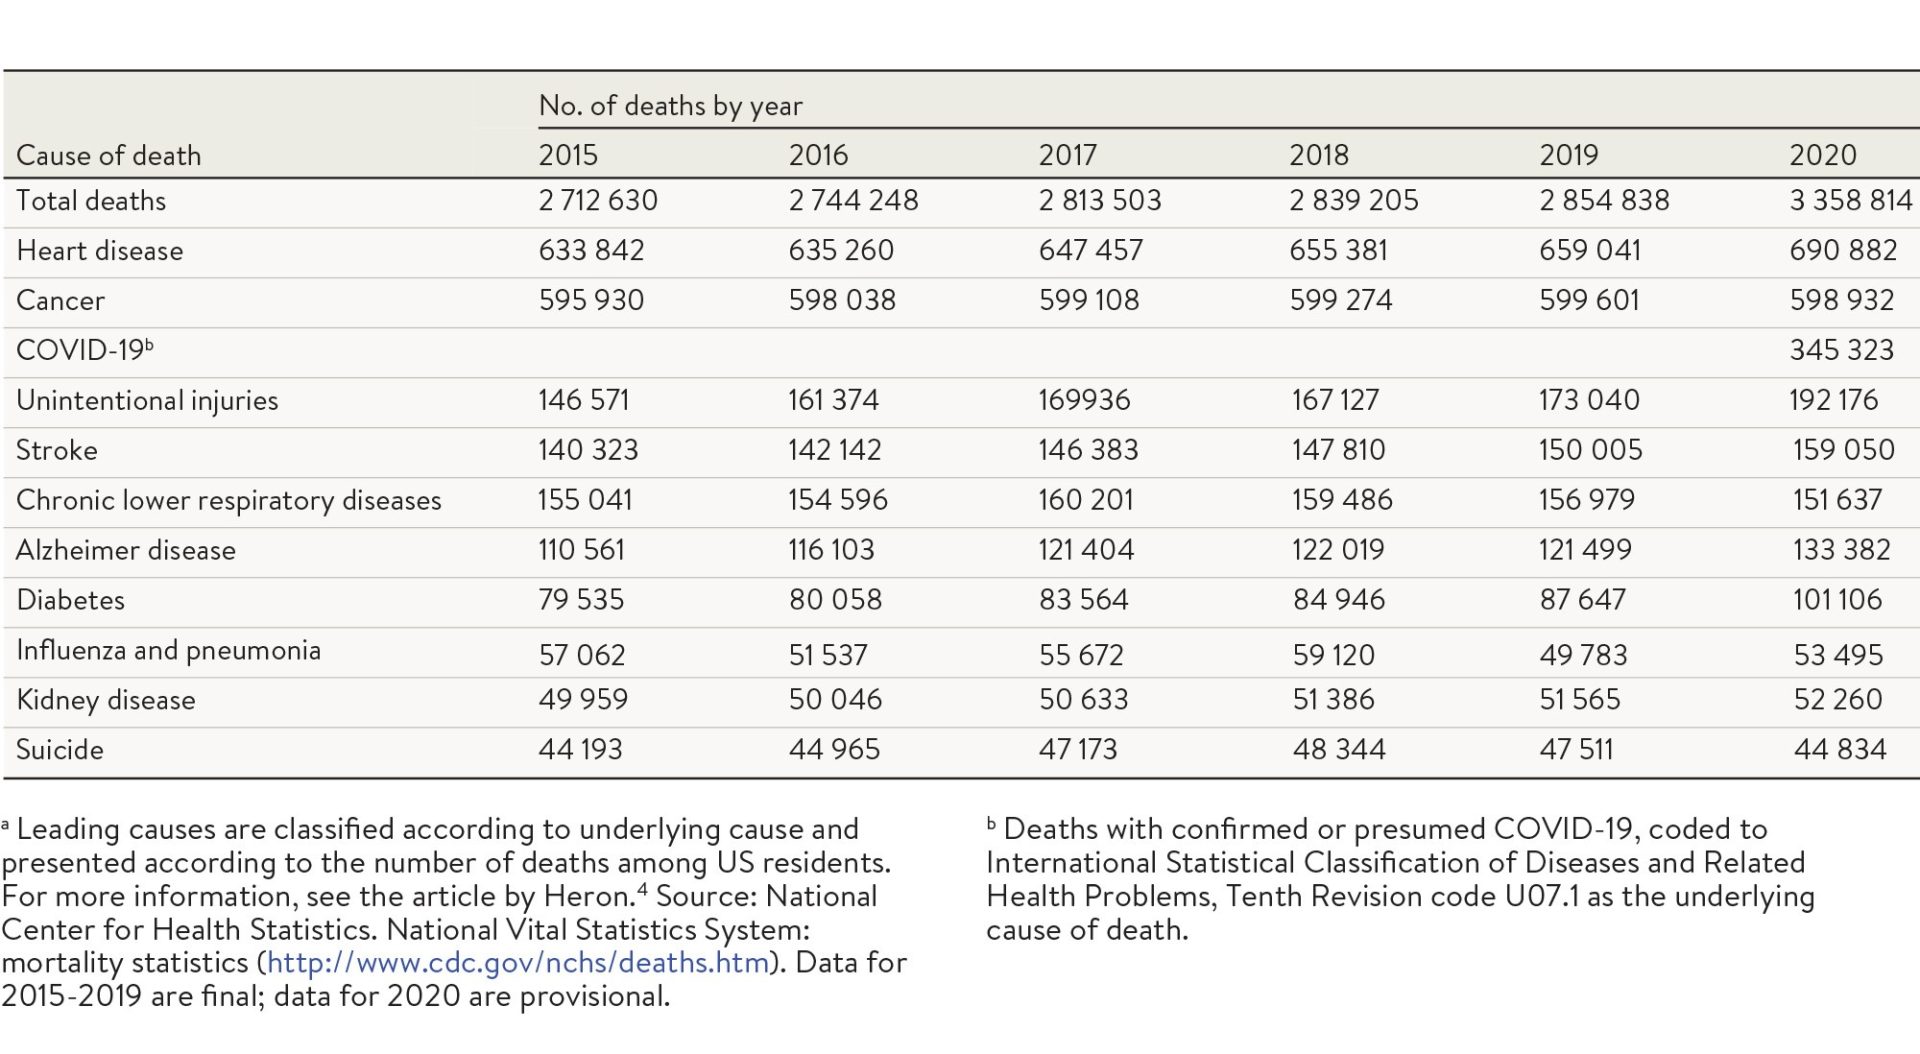
Source: JAMA, “The Leading Causes of Death in the US for 2020”
Such has been the level of fiscal support by governments, but also pent-up demand by many consumers who have been locked away for much of 2020, that the economic rebound is likely to be an almighty one. Just think of all the cafes and restaurants consumers didn’t go to, the malls they didn’t visit, the movies they didn’t see and the holidays they didn’t take.
We can see this clearly in the US where consumer activity on a number of measures in many states has not just returned to pre-COVID levels, but is significantly above them (see chart below).
Texas is a great example where consumer discretionary foot traffic and restaurant bookings are about 29% and 11% respectively above those seen in 2019.
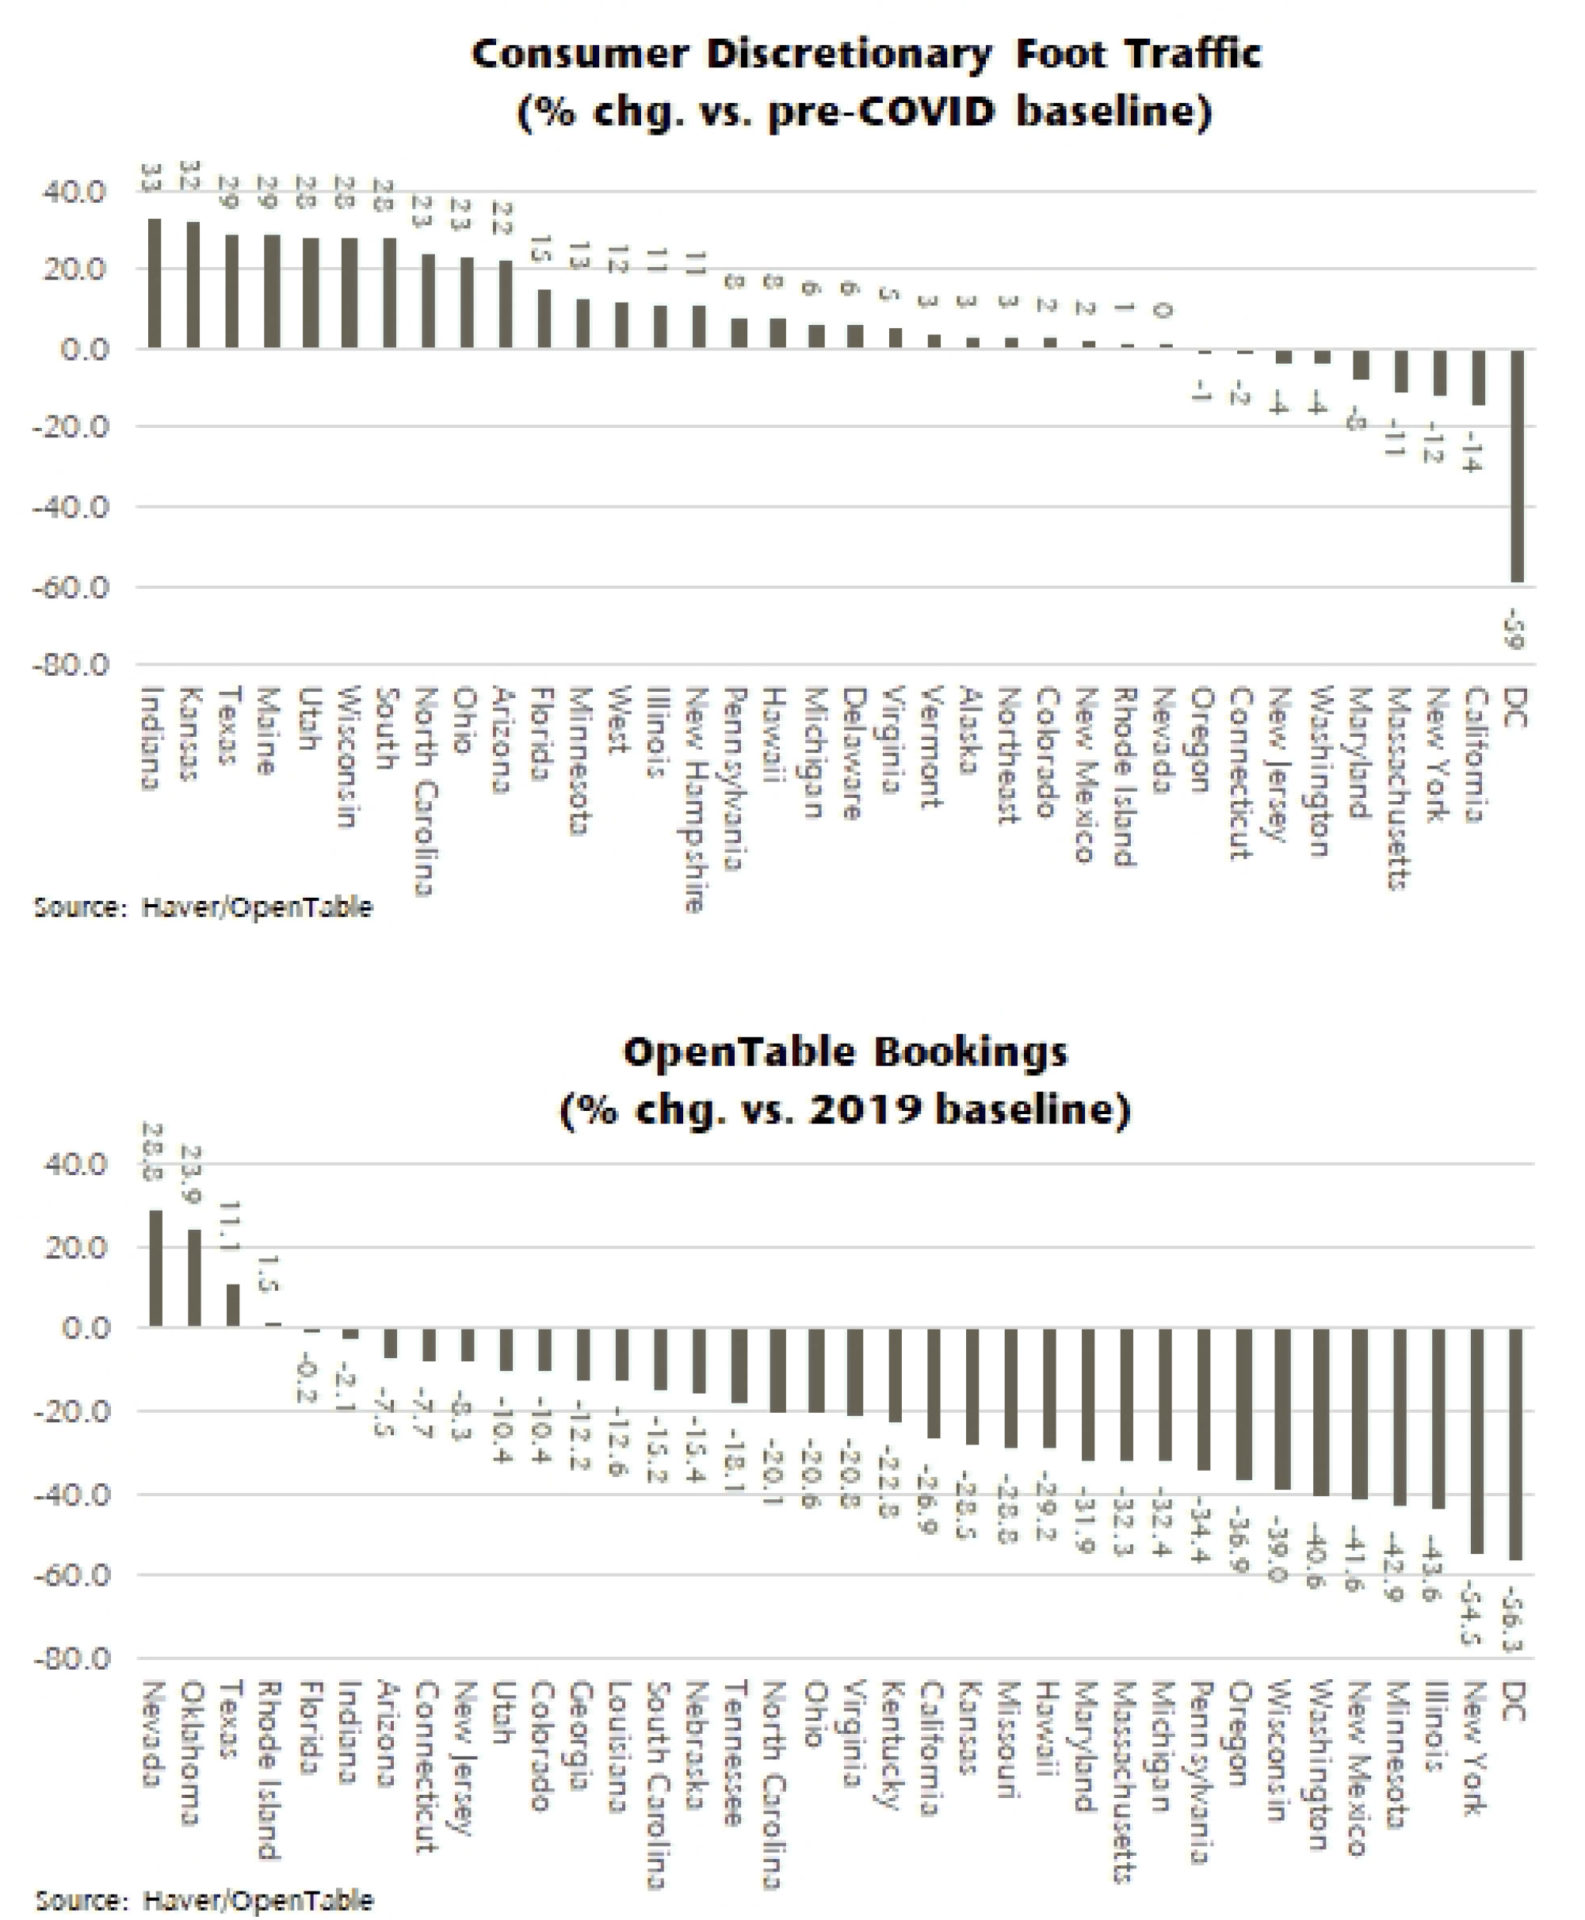
Source: Jefferies, Haver, Open Table
What inflation risk?
This rebound means professional investors have actually started to move on from seeing COVID-19 as the biggest risk to markets.
Bank of America’s Global Fund Manager Survey in March, for the first time in a year, didn’t have the coronavirus as the “biggest tail risk” they saw. Instead, it was replaced by what the economic rebound post COVID-19 may result in – inflation.
Evolution of Global FMS “biggest tall risk”
History of Global FMS “biggest tall risk” answers
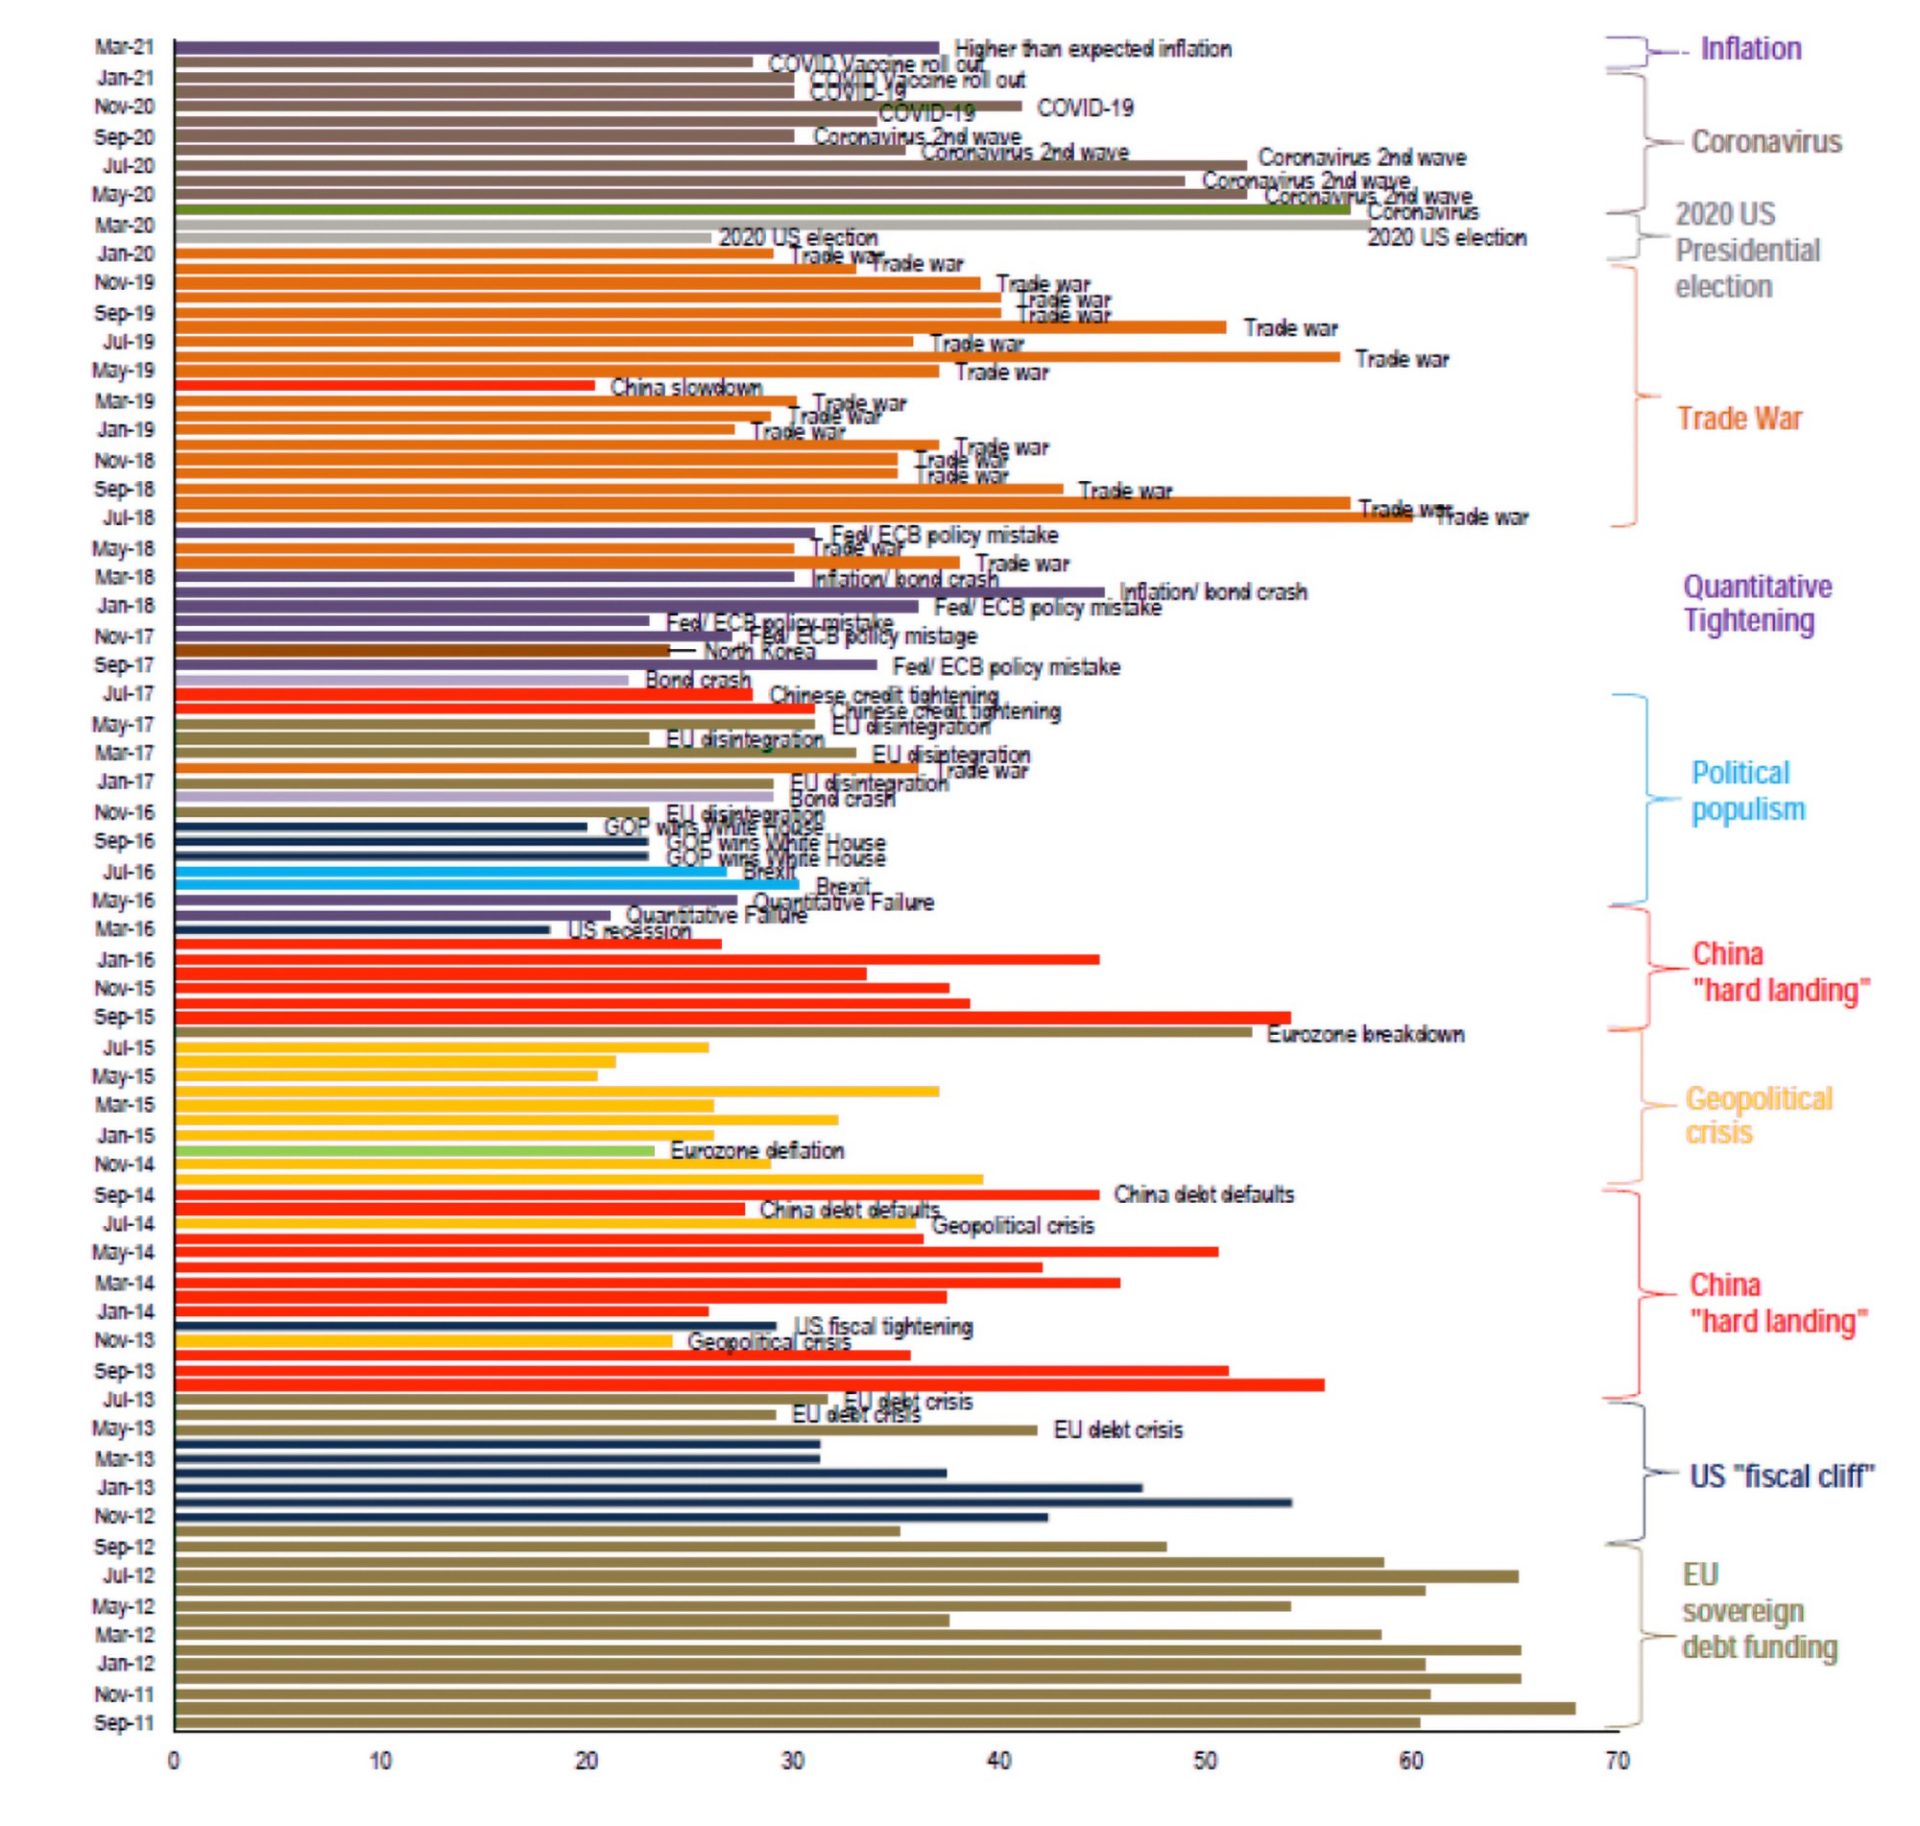
Source: BofA Global Fund Manager Survey
Yet, outside a temporary boost to inflation as we cycle off its COVID lows from a year ago, we believe though it is hard to see sustained inflation of a level that should worry investors for some time. Labour markets still generally have quite a bit of slack to be worked off before ‘wage push’ inflation – an upward cycle where workers demand ever higher wages due to a tight labour market – becomes a threat. We might have to see labour markets tighter than we have seen in our many of our lifetimes for sustained wages pressure to build.
Indeed, the world is still gripped in the disinflationary funk brought about by globalisation and technology that has made goods inflation virtually non-existent. This force isn’t going away anytime soon.
Inflation risk does, however, bear watching closely because of the unprecedented size of fiscal and monetary support currently in place in many major economies.
A world of opportunity
So given the outlook for the market cycle and the rebound in economic growth, what does that mean for our investment strategy?
We are relatively optimistic about opportunities in the investment opportunity set we look at — global and Australian small and mid caps.
Part of this is due to the relatively more attractive valuations in these markets we focus on, compared to US large caps and US tech.
We also have benefit from investing in a less ‘efficient’ part of equity markets where less analyst coverage means it is easier to find misunderstood, or mispriced companies.
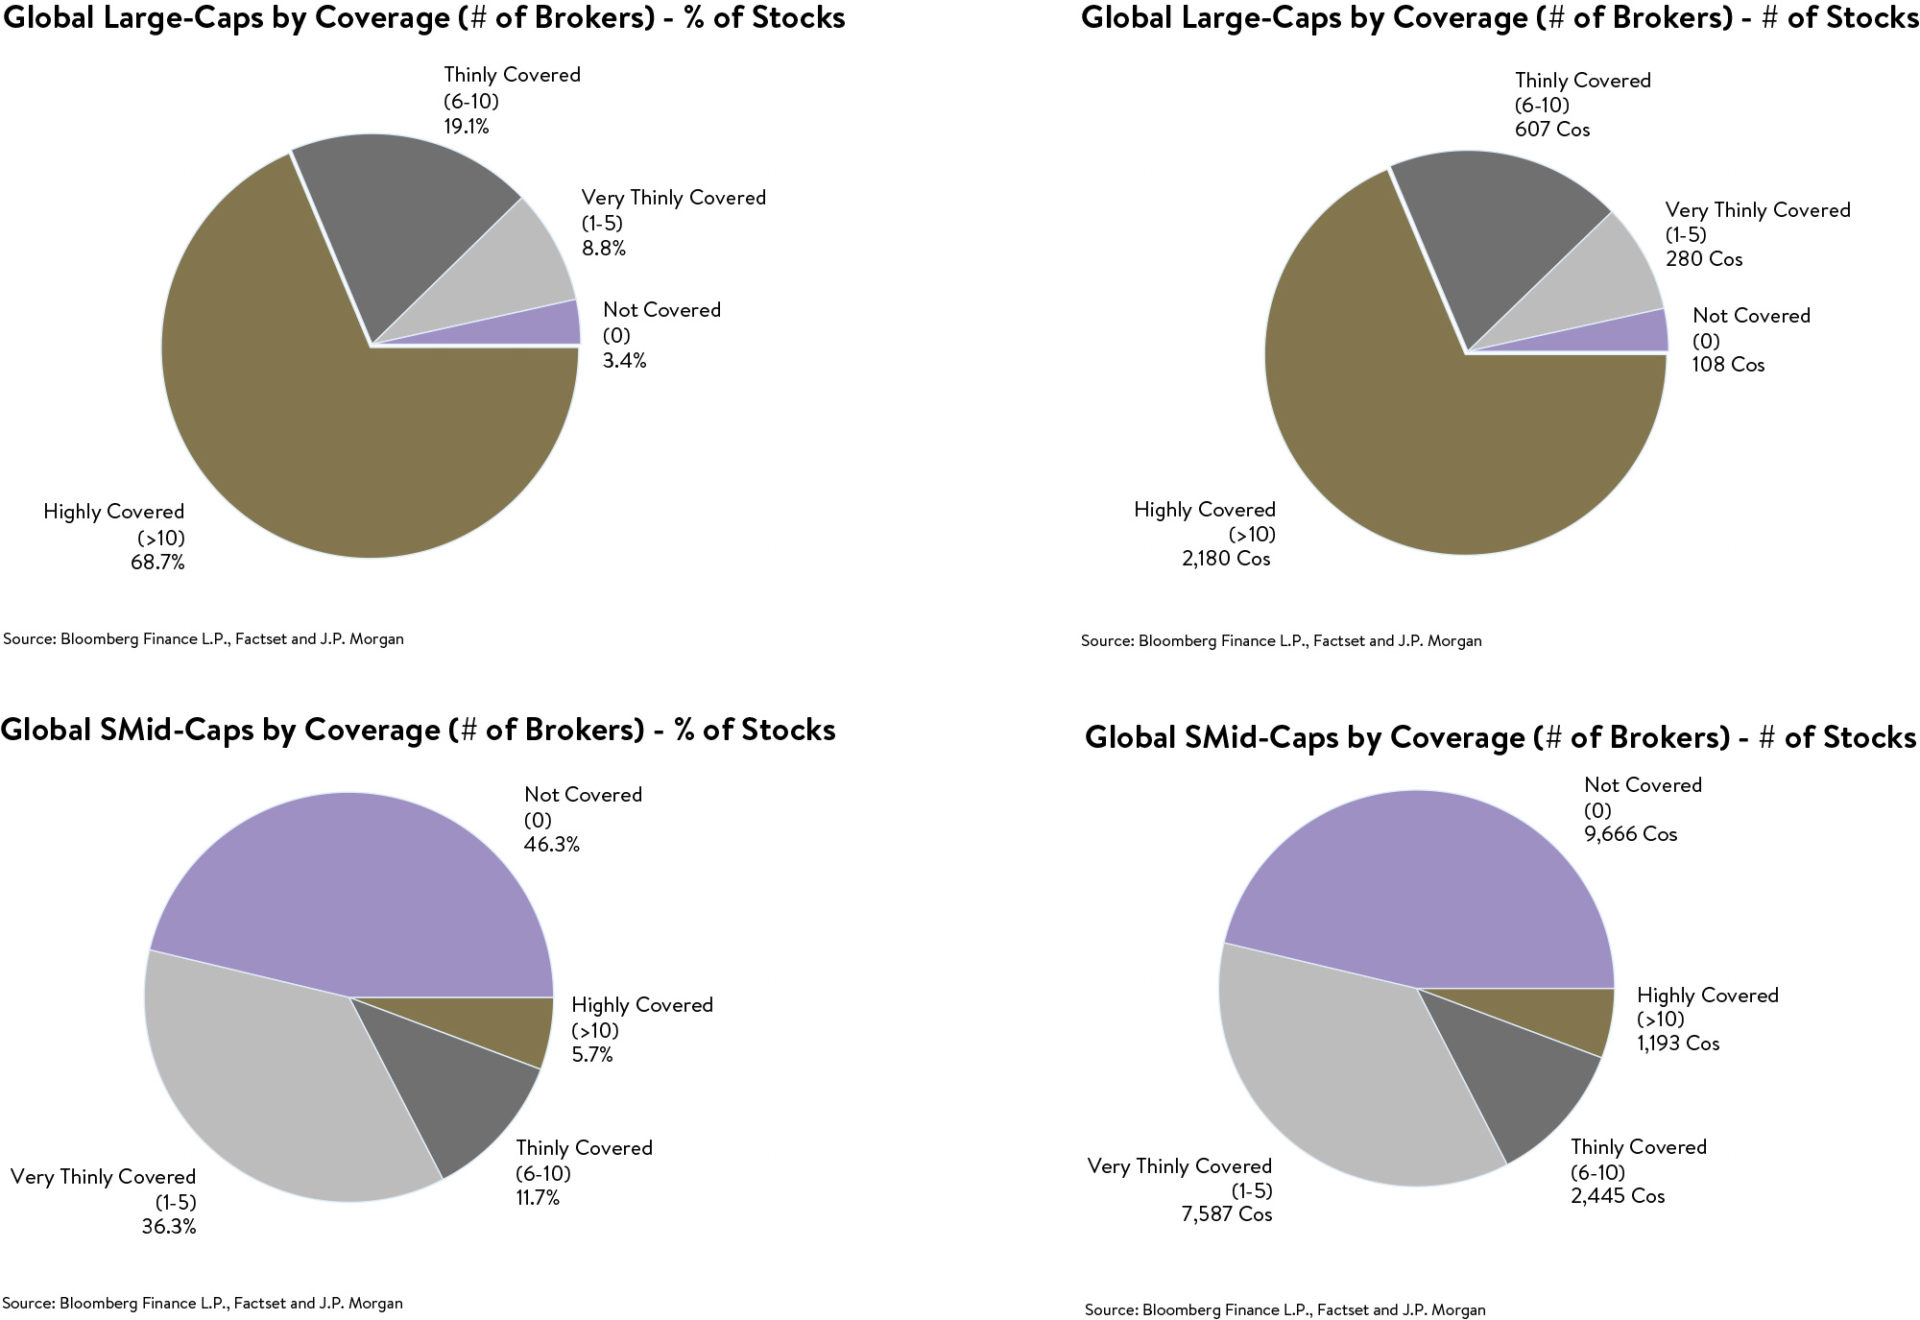
As you can see above, the percentage of ‘Not Covered’ or ‘Very Thinly’ covered companies by broker analysts is 82.6% (17,253 companies) of the global small and mid-cap universe, whilst it is only 12.2% (388 companies) of the large cap universe.
This reminds us of the Buffett quote: “I don’t look to jump over 7-foot bars: I look around for 1-foot bars than I can step over”. We think this rings true in the global small and mid-caps universe where less analysts looking for an edge on a company means it’s comparatively easier for us to find one.
Pegging our hopes on lower PEGs
We are cautious, though, about the highest valued ‘growth’ and ‘tech’ names, particularly where their earnings are only likely to come in line with expectations or register small ‘beats’. They are still trading near the top of their valuation bands, and these are the types of companies that are unlikely to find favour in a rising bond yield environment.
In Australia this means we might see continued headwinds for the local tech sector compared to other sectors near term, but better prospects as we look out a year or two. Australian tech may also underperform its US peers near term given its lower levels of profitability and relative immaturity against a backdrop of rising bond yields.
If you’re going to invest in high-growth businesses at present and expect the market to reward you, we think you need two conditions to be met:
- Firstly, the earnings ‘beats’ need to be big; and
- And secondly, valuations still need to have some meaningful headroom to the top of their trading bands. These are your reasonably valued growth business. These tend to be your growth businesses with lower so called ‘PEG’ ratios – or those with lower price-to-earnings ratios divided by its earnings growth.
As an example, domestically in the IT space a couple of companies we continue to favour are Tyro Payments (ASX:TYR) and NextDC (ASX:NXT).
Tyro made headlines earlier this year with outages at some of its merchant terminals for a couple of weeks in January; but to date it doesn’t seem to have been materially impacted by any abnormal turnover of merchants as a result. Tyro’s payments processing business is focussed on the hospitality, retail and health sectors and is benefitting from the recovery trade as customer spend in these sectors gets its mojo back. Tyro continues to take significant market share, winning new merchants with top line revenue growth of around 30% per annum, and is the clear fifth biggest player, after the big banks, in merchant payment terminals in the country.
NextDC, the major data centre operator in Australia, has seen share price weakness during the most recent tech sell off that started in mid-February. We see significant upside from here, though, as new data centres come online and they continue to win new enterprise contracts. COVID has accelerated companies moving their IT to the cloud and needing the infrastructure and services of companies like NextDC. We also see the company as having some essentially free overseas growth options in Singapore and Japan that we believe aren’t priced in by the market yet.
We maintain a preference for these types of tech businesses where COVID has been an ‘accelerator into the future’, rather than simply ‘borrowing growth from the future’.
As always, thank you for entrusting your capital with us.
Kindest regards,
Andrew Mitchell & Steven Ng
Co-Founders & Senior Portfolio Managers
Ophir Asset Management
This document is issued by Ophir Asset Management Pty Ltd (ABN 88 156 146 717, AFSL 420 082) (Ophir) in relation to the Ophir Opportunities Fund, the Ophir High Conviction Fund and the Ophir Global Opportunities Fund (the Funds). Ophir is the trustee and investment manager for the Ophir Opportunities Fund. The Trust Company (RE Services) Limited ABN 45 003 278 831 AFSL 235150 (Perpetual) is the responsible entity of, and Ophir is the investment manager for, the Ophir Global Opportunities Fund and the Ophir High Conviction Fund. Ophir is authorised to provide financial services to wholesale clients only (as defined under s761G or s761GA of the Corporations Act 2001 (Cth)). This information is intended only for wholesale clients and must not be forwarded or otherwise made available to anyone who is not a wholesale client. Only investors who are wholesale clients may invest in the Ophir Opportunities Fund. The information provided in this document is general information only and does not constitute investment or other advice. The information is not intended to provide financial product advice to any person. No aspect of this information takes into account the objectives, financial situation or needs of any person. Before making an investment decision, you should read the offer document and (if appropriate) seek professional advice to determine whether the investment is suitable for you. The content of this document does not constitute an offer or solicitation to subscribe for units in the Funds. Ophir makes no representations or warranties, express or implied, as to the accuracy or completeness of the information it provides, or that it should be relied upon and to the maximum extent permitted by law, neither Ophir nor its directors, employees or agents accept any liability for any inaccurate, incomplete or omitted information of any kind or any losses caused by using this information. This information is current as at the date specified and is subject to change. An investment may achieve a lower than expected return and investors risk losing some or all of their principal investment. Ophir does not guarantee repayment of capital or any particular rate of return from the Funds. Past performance is no indication of future performance. Any investment decision in connection with the Funds should only be made based on the information contained in the relevant Information Memorandum or Product Disclosure Statement.