By Andrew Mitchell & Steven Ng
Co-founders and Senior Portfolio Managers

In our June Letter to Investors we reflect on what has been a year to remember for equity markets and assess whether they are over-valued. We also outline four factors we believe are key to the Ophir Funds outperforming during “bad” markets
Dear Fellow Investors,
Welcome to the June 2020 Ophir Letter to Investors – thank you for investing alongside us for the long term.
If you fell asleep on New Year’s Eve 2019, woke up on 30 June 2020, and then read the news headlines, you might be surprised at how little the value of your investment portfolio had changed.
Though we are in the midst of the deepest global recession since World War II, many key equity markets are not much changed from the start of the year. Some are even higher. This has all occurred despite one of the fastest bear markets in February and March, followed by one of the fastest bull markets in April and May.
In June, despite continued second waves of Covid-19 in the US and Australia, and accelerating cases in emerging economies, particularly Brazil and India, most markets ended the financial year on a positive note, including the ASX300 (+2.4%) and the MSCI World (+2.7%).
FY19/20 Ophir Fund Performance
We are pleased that our strategies have protected material wealth during these extraordinary times, with each of our three funds logging positive performance and outperforming their respective market benchmarks during June 2020. More broadly, we have been delighted with the performance of the Ophir Funds during the 2019/20 financial year with each fund significantly outperforming its relevant benchmark.
The Ophir Opportunities Fund returned +1.5% net of fees in June, outperforming its benchmark by 3.5%. For the 2019/20 financial year the Fund delivered investors +12.4% net of fees outperforming its benchmark by 18.1%.
Download Ophir Opportunities Fund Factsheet
The Ophir High Conviction Fund investment portfolio returned +2.5% net of fees in June, outperforming its benchmark by +1.4%. The Ophir High Conviction Fund’s ASX listing provided a total return of +7.7% for the month. For the 2019/20 financial year the Fund’s investment portfolio delivered investors +10.6% net of fees outperforming its benchmark by 13.1%
Download Ophir High Conviction Fund Factsheet
The Ophir Global Opportunities Fund returned +2.0% net of fees in June, outperforming its benchmark by 3.9%. For the financial year 2019/20 financial year the Fund delivered investors +24.2% net of fees outperforming its benchmark by 26.7 %.
Download Ophir Global Opportunities Fund Factsheet
A year to remember
The graph below shows the total returns of key equity market indices over the last 1, 6 and 12 months to 30 June 2020 (sorted by 6 monthly returns).
Total Returns – to 30 June 2020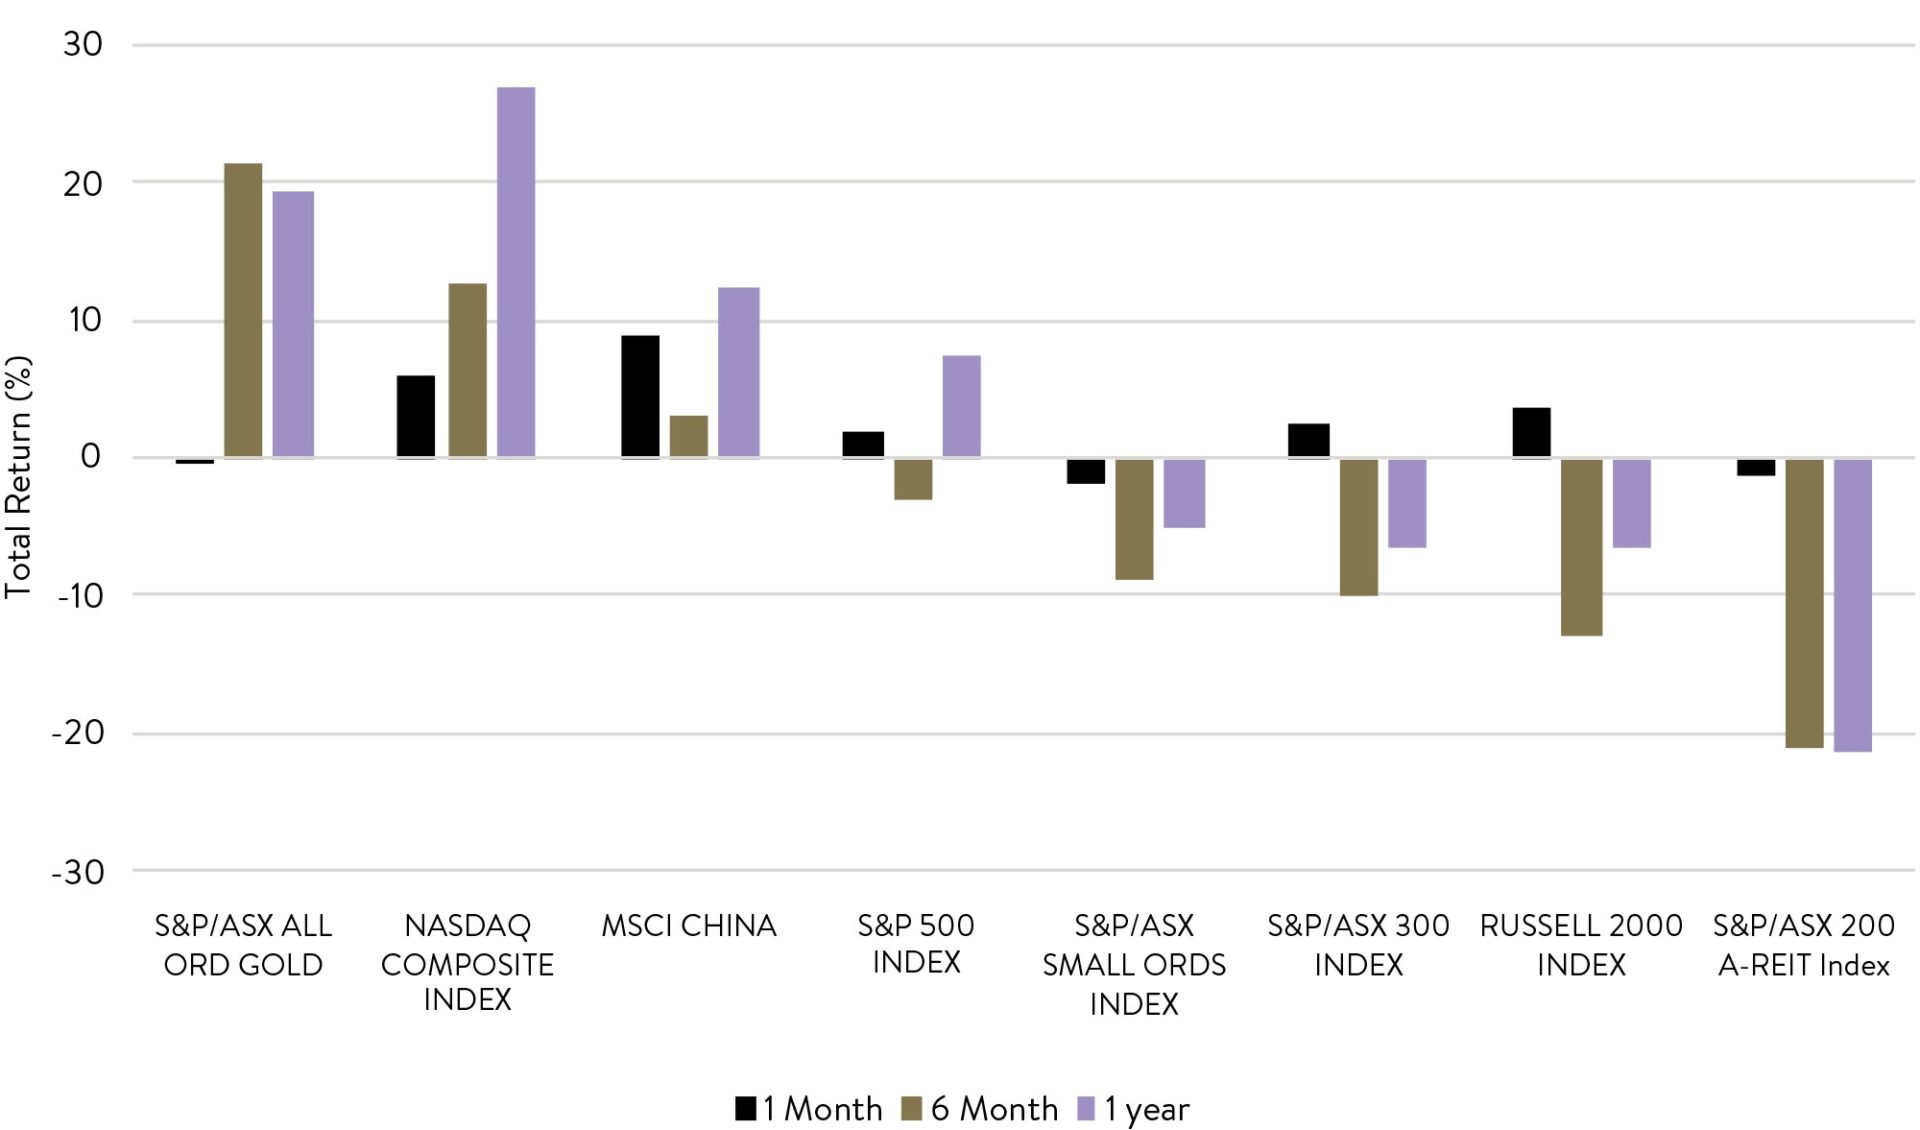
Source: Ophir Asset Management, Bloomberg
Despite a slow start to the year, gold reasserted its typical risk-off characteristics, while the NASDAQ and the FAANGs continue to reach new highs. China has seen its share market actually increase this year, while the US eked out a small loss.
Australia, on the other hand, continues to lag with financials and the big banks seeing headwinds with significant dividend cuts. Local Real Estate Investment Trusts (A-REITs) are bearing the brunt of the pain as tenants of all description, but mostly retail, have pushed back on paying rents.
But is it over?
On average, though, it seems that share markets think the worst is behind us. But are they right?
The markets are looking past the current economic data – where the biggest damage will likely be seen in the June quarter – towards improving leading indicators of activity as some normality resumes in the major economic centres.
While the risk of further Covid-19 outbreaks cannot be discounted, the bar to jump for reinstituting major broad-based lockdowns remains high; smaller, targeted (and more economically friendly) actions are more likely.
But things did look very grim for a while. The June quarter will likely be remembered as ground zero for the economic carnage of Covid-19. JP Morgan recently gave the long view of just how bad the hit to economic output is expected to be. Eclipsing the GFC, we have to go back 75 years to see a larger drop, making this the biggest fall most of us have seen in our lifetimes.
Global real GDP, the eight recessions since 1900
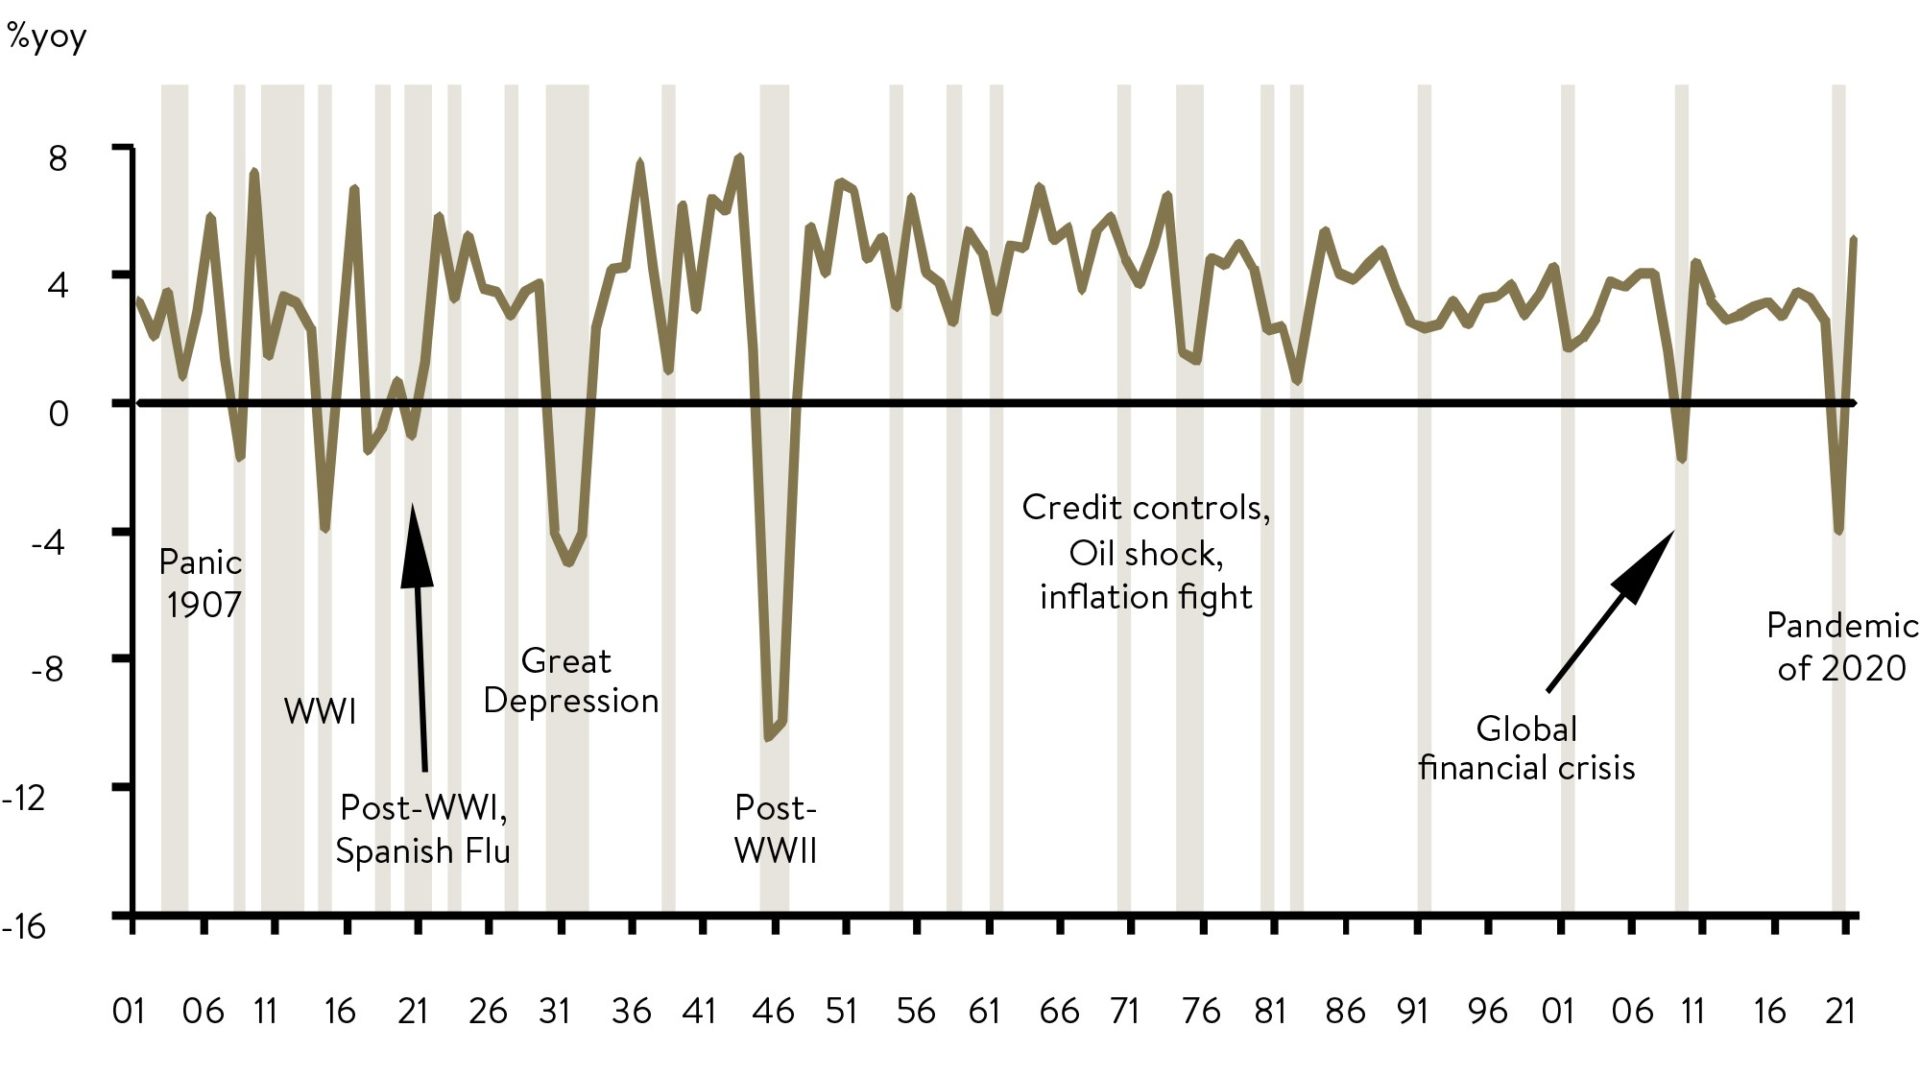
Source: JP Morgan and Angus Maddison data
However, high-frequency data suggests the decline will likely be relatively short lived. Economic activity appears to be rebounding faster than most initially predicted, and many growth forecasts have been revised up over the last month or so.
This time, the Feds get the money to where it’s needed
One critical difference between this crisis and the GFC, is the amount of liquidity from central banks, including the Fed, that is making it out of the banking system and into the hands of businesses and consumers.
This is shown below in the graph of M2, a measure of the money supply which includes cash, savings accounts, term deposits, money market securities and some mutual funds. In the GFC, much of the liquidity from central banks just ended up in excess reserves held by the commercial banks back at the central bank.
US M2, MoM change since pre-GFC
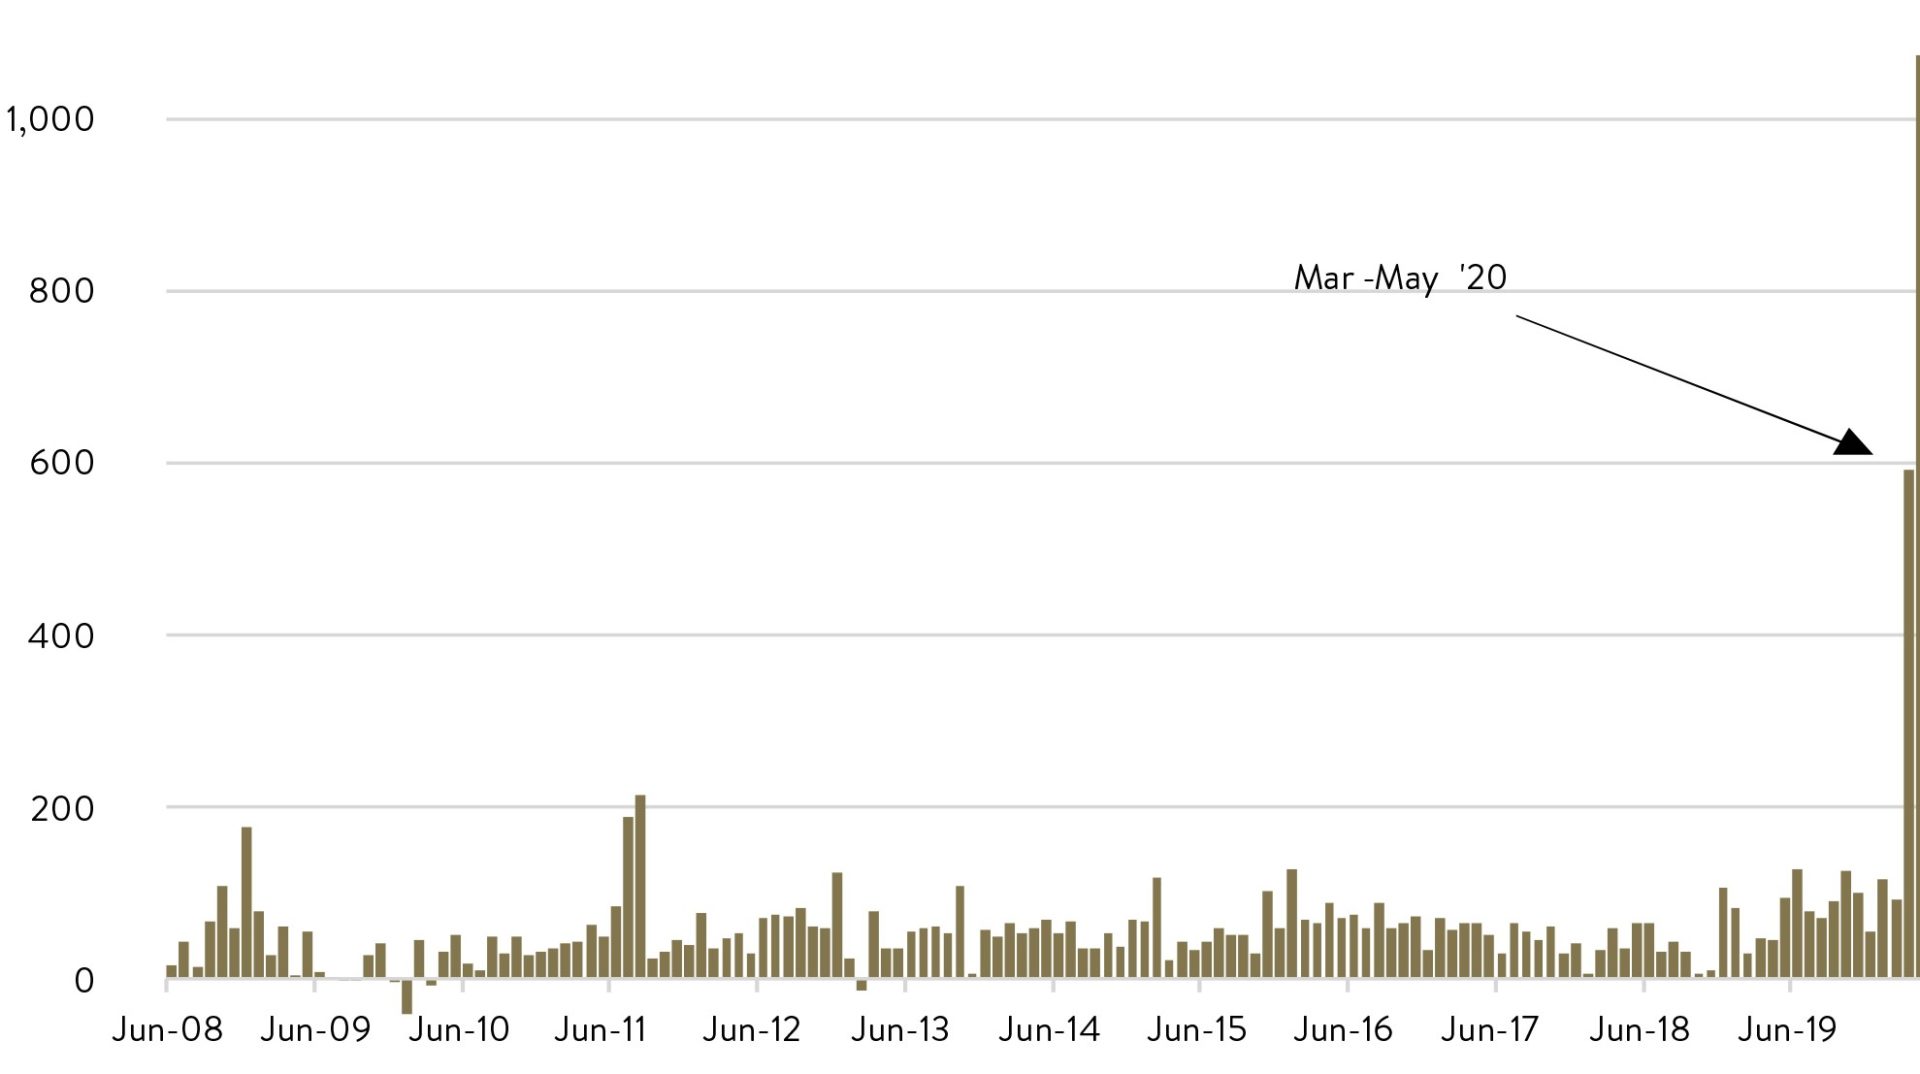
Source: JP Morgan, Bloomberg
Walking a fine line between inflation, stimulus withdrawal and re-election
The big question mark for markets will be whether all this cash in the system leads to that long-lost wealth robber – inflation. Markets are currently saying no, but if they are wrong, then it will have major implications for bond yields, discount rates for shares and the valuation of share markets and specific sectors.
The other significant risk in the second half of the year, besides the obvious Covid-19 second waves, is the potential for a ‘fiscal cliff’. Will governments switch off life support in a few months – as many are expected to – or do they continue supporting the consumer. Much will depend on the trajectory of coronavirus outbreaks in each country, though as far as the US and Australia are concerned, we expect to see more punchbowl filling on the horizon.
Australians know that the government has some dry powder, saved from the initial, and somewhat embarrassing, overestimation of JobKeeper subsidies. We see that potentially being brought to bear, should it be needed, in a more targeted fashion latter this year.
As for the US, it will not be lost on President Trump that since the 1920s, 87% of the time the share market has been up in the three months before the election, the incumbent party has won. This has also been true 100% of the time since the 1984 election.
With the November election rapidly approaching, we expect Trump to spend big to help boost consumers and the share market to maximise his chances of a second term.
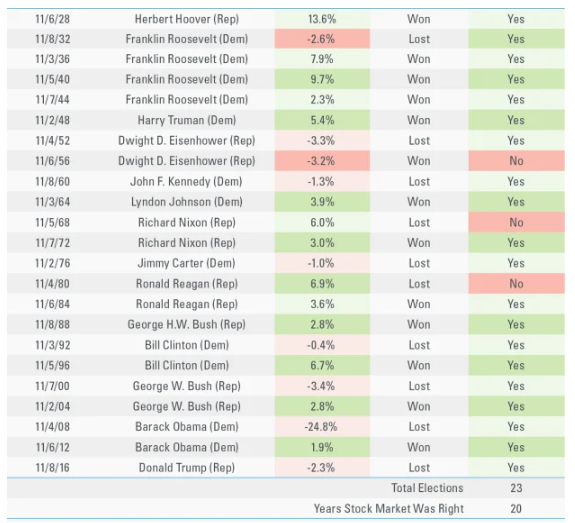
Source: LPL Financial, US share market 3 months before election.
Are markets over-valued?
Much has been made about the speed of the recovery in share markets and whether it has gone too far given the damage the pandemic is wreaking on corporate earnings and the uncertainties that still lie ahead.
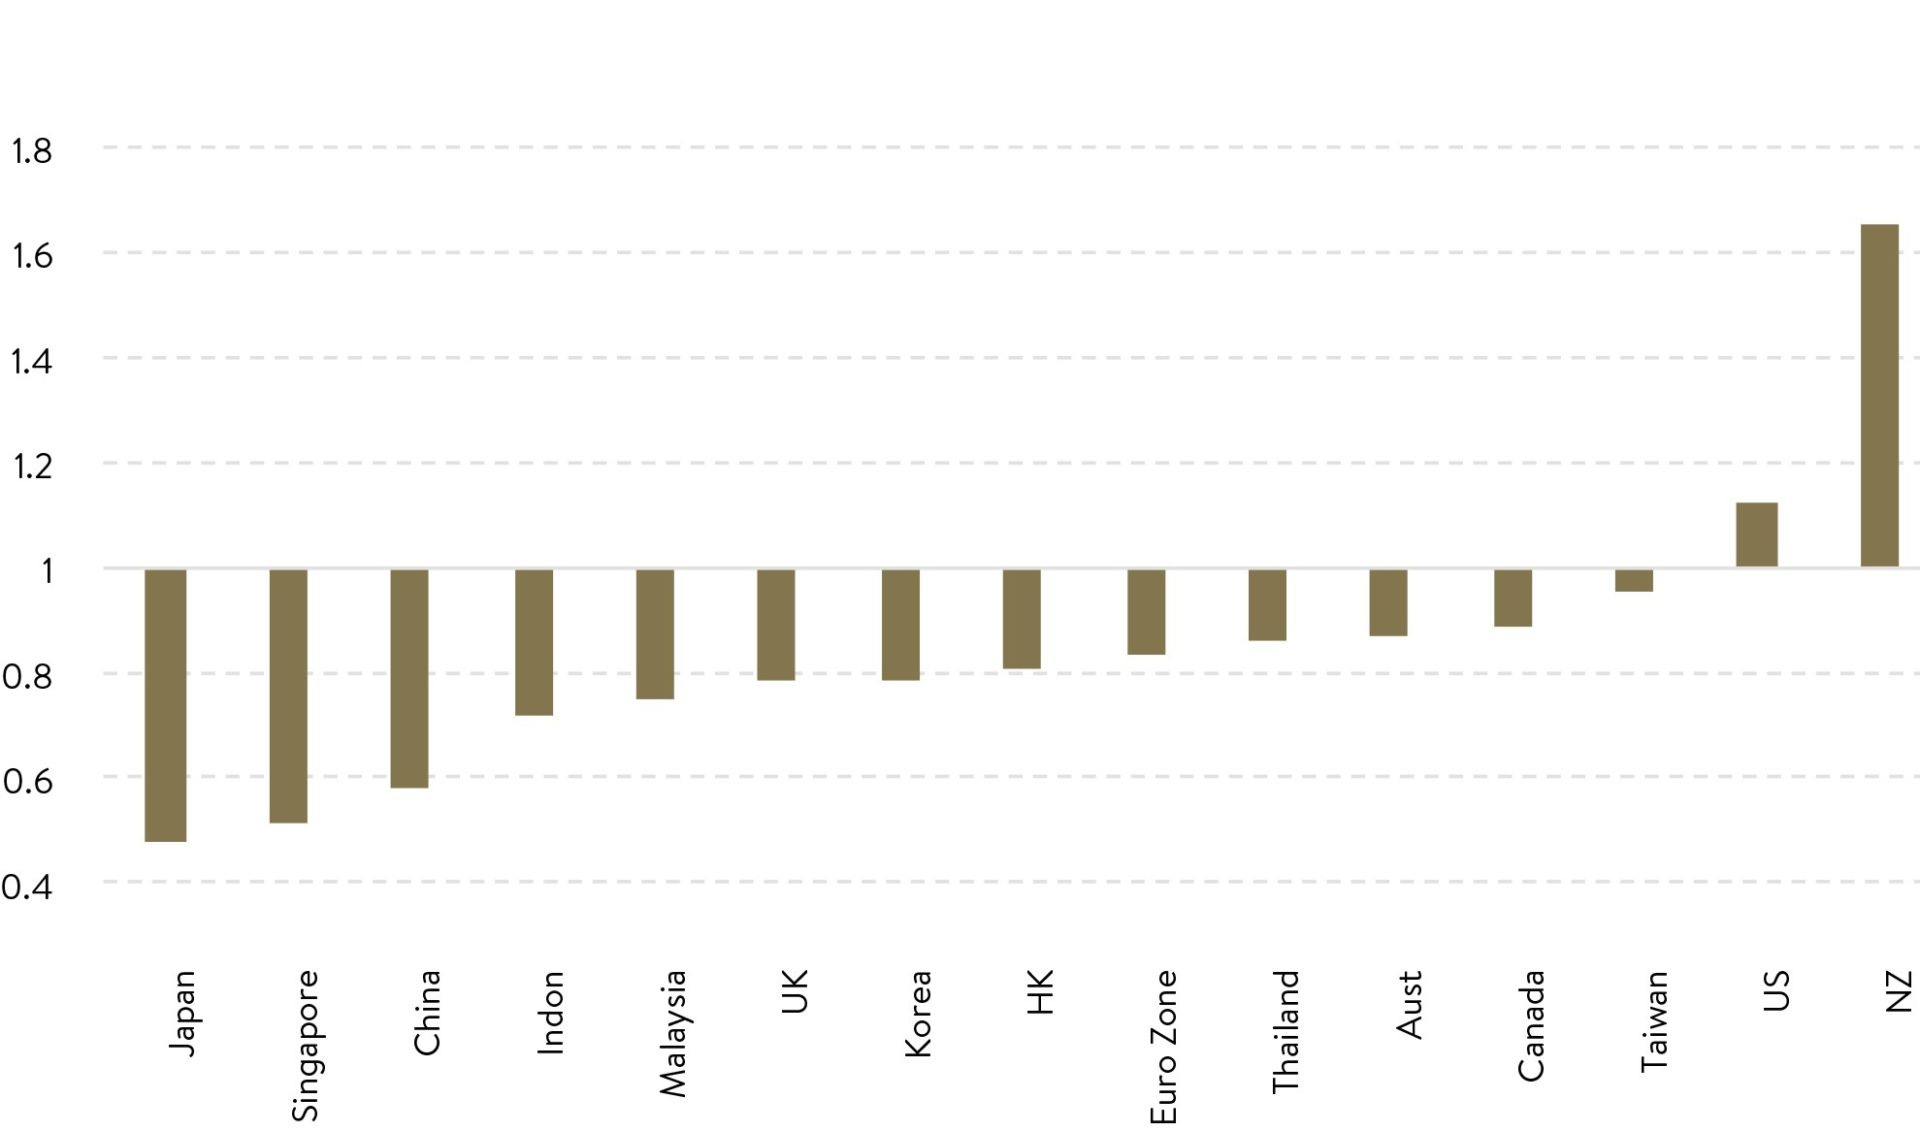
While we are firmly in the ‘not market timers’ camp, we are more sanguine about where market valuations currently sit. One of the best ‘predictive’ valuation metrics of long-term market returns is the cyclically adjusted price-to-earnings ratio (or CAPE for short), which looks at how much investors are paying for the long-term trend of earnings. On this metric, prices don’t look too demanding, with most countries’ share markets around or below long term trends (New Zealand being a key outlier).
CAPE vs 40y avg
Source: MST Marquee
We think this is a better way to look at valuations than current, or one-year forward price-to-earnings valuations given the historic, and likely one-off short sharp impact of Covid-19 for many companies. Of course, this is not true for all. For those companies whose world has changed more permanently, a view on what ‘normalised’ means will need to be determined.
Outperforming both in good times and bad
Before finishing, we want to provide a closer look at how the measures we have long incorporated in our investment process have contributed to good downside protection and outperformance through the first six months of 2020.
The purpose is not to toot our own trumpet. We have been around long enough and made enough mistakes to know markets always have more to teach you. Instead, it’s to show how our investment process tends to provide more outperformance in down markets than up markets, why that might be so, and why that may perhaps continue in the future.
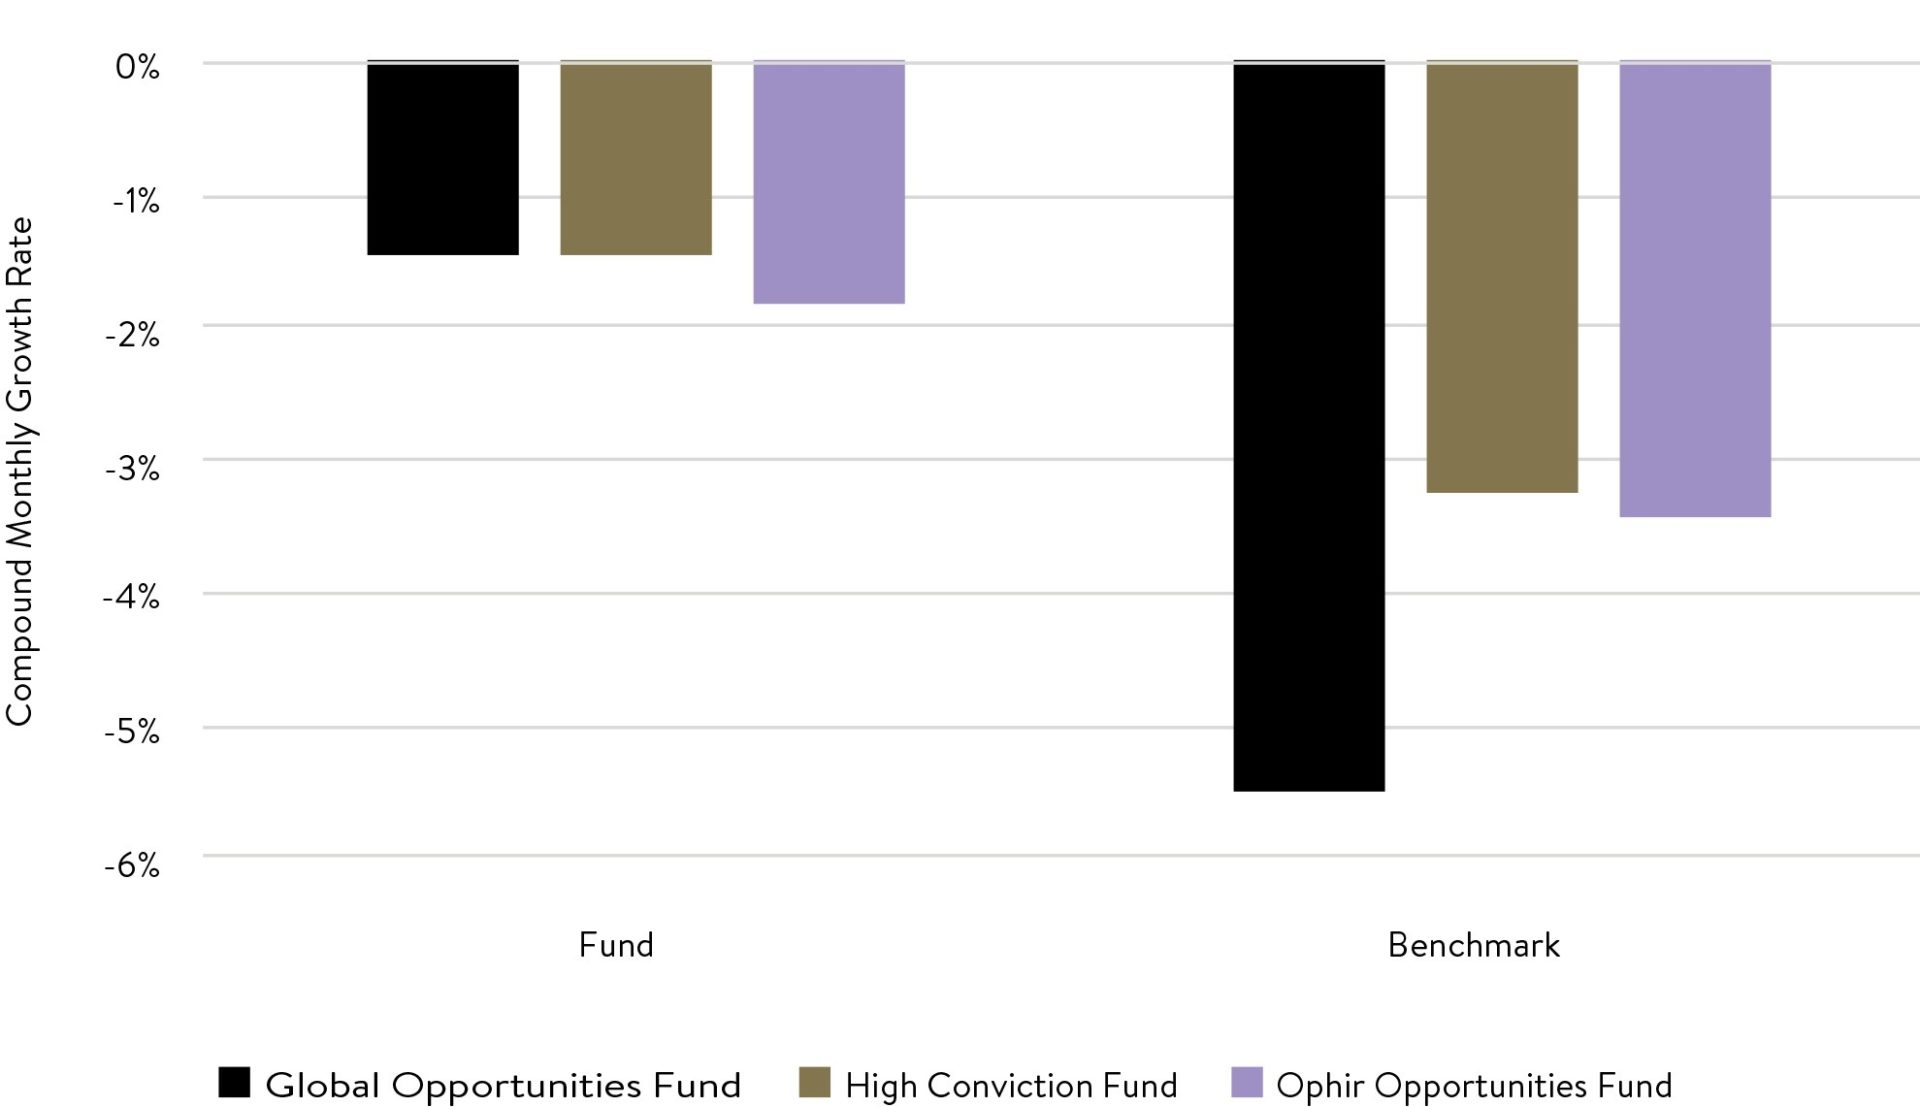
The graph below shows that since their inception, each of our three funds has lost significantly less than the benchmark on average when the market has been down for the month. For example, in down months, the fall was on average around -5.5% for the market. But the Global Opportunities Fund fell just -1.5% in those same months. In other words, our fund fell only around 27% of the overall market fall.
Similarly, our two longer running funds, the Ophir High Conviction Fund and Ophir Opportunities Fund each fell on average around only 45-50% of the market benchmark fall in down months. As a broad yardstick, anything lower than 80% is typically very good.
Downmarket Performance
Source: Ophir Asset Management, Bloomberg
When the market is on an upswing, our funds have also outperformed the market, but by a slightly lower margin. For example, in up months the market benchmark on average gained around +3.7%, while the Ophir Global Opportunities Fund rose a stronger 6.0%, or around 160% compared to the market. The High Conviction Fund and Ophir Opportunities Fund rose 116% and 135% of the market, respectively.
Upmarket Performance
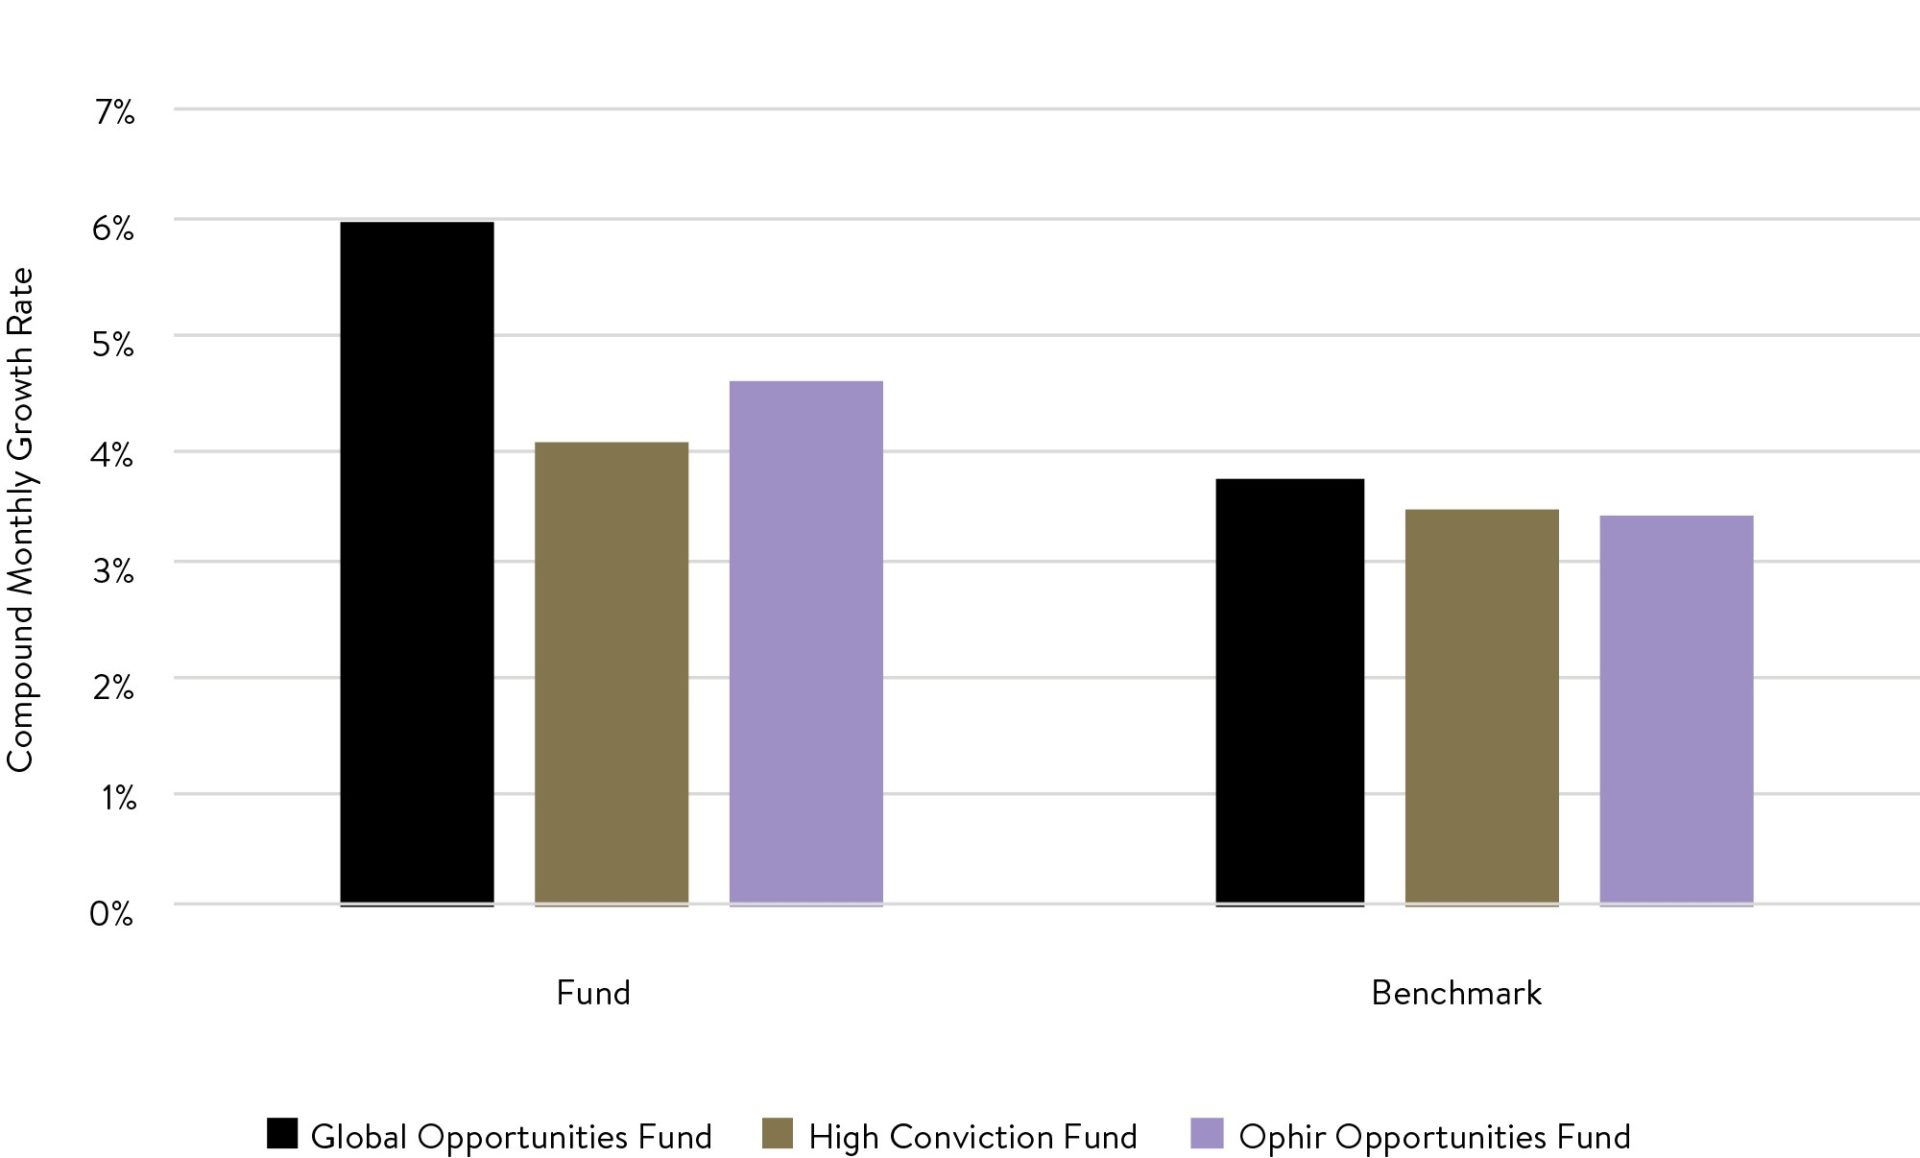
Source: Ophir Asset Management. Note compound monthly growth rates are before fees.
Four keys to outperformance in bad times
On average, our funds have outperformed through both ‘good’ and ‘bad’ market environments, but we tend to outperform more in the latter. Why might that be so?
We think it is likely due to several factors, but these four stand out:
Firstly, for companies we are considering investing in, we conduct our due diligence and valuations both in normal market environments and also in ‘meltdown’ or GFC style environments. We consider the performance of the company across several different metrics in a meltdown scenario including earnings certainty, balance sheet strength, liquidity and opaqueness. We firmly believe in the maxim that if you “fail to plan, you plan to fail” so we prepare for the inevitable tougher times before they hit.
Secondly, structurally we tend to invest in companies with lower gearing levels or with net cash on their balance sheet. These companies, all else being equal, have lower interest costs and therefore are less likely to see profits squeezed in a downturn. They also are more likely to maintain the financial flexibility to acquire distressed competitors in a recessionary environment.
Thirdly, we are always looking for companies that we believe have long term structural tailwinds at their back either through the sector they operate in or because of the superiority of their product or service. These companies tend to be growing rapidly, often taking market share, and often providing more resilient growth during slower parts of the business cycle.
Finally, we strictly manage the weights of each of our holdings so that our highest weight positions tend to reflect our best ideas that we believe are likely to beat company guidance and market expectations. These companies tend to get sold off less (or sometimes not at all) when markets are being hit. Moreover, our deliberately constrained capacity means we are able to nimbly adjust portfolio weights to changing market circumstances to help us avoid icebergs when we spot them ahead.
By following these principles, we have, on average, been able to deliver greater outperformance during down markets. We are unashamedly proud of this feature of our investment strategy, particularly as there is evidence that “losses loom larger than gains” for investors. It also leaves more of the portfolio behind to compound for the inevitable up markets.
This first six months of 2020 has been a particularly hectic time for us and the whole investment team. But our work has paid off, and we are pleased we have been able to provide fairly consistently outperformance across our funds during this period.
Portfolio preservation during COVID-19
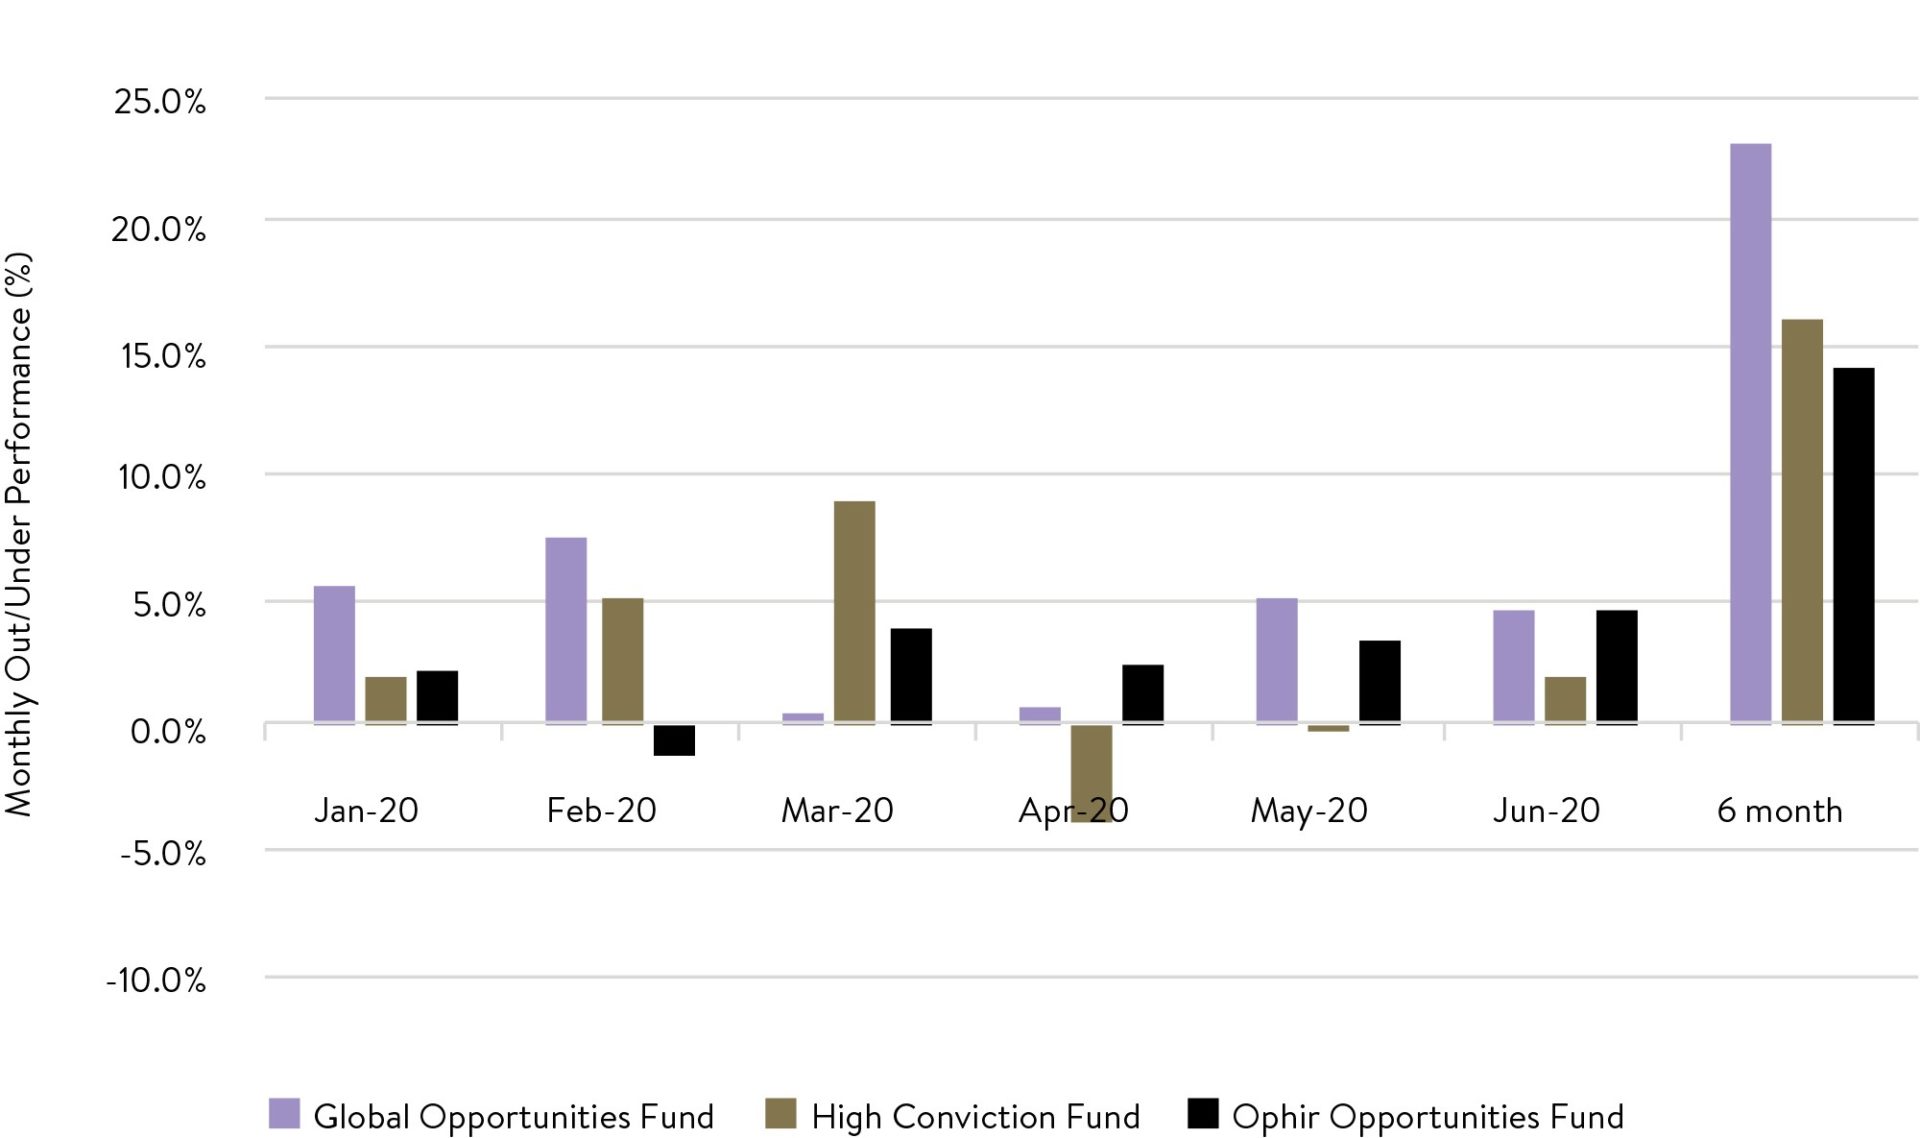
Source: Ophir Asset Management, Bloomberg
We are very fortunate that we have new investors entering all the time who are just starting their experience with Ophir. We are dedicated to ensuring that no matter how long you have been with us – a month, a year or since the beginning – we are working hard to provide the best long-term returns possible.
As always, thank you for entrusting your capital with us.
Kindest regards,
Andrew Mitchell & Steven Ng
Co-Founders & Senior Portfolio Managers
Ophir Asset Management
This document is issued by Ophir Asset Management Pty Ltd (ABN 88 156 146 717, AFSL 420 082) (Ophir) in relation to the Ophir Opportunities Fund, the Ophir High Conviction Fund and the Ophir Global Opportunities Fund (the Funds). Ophir is the trustee and investment manager for the Ophir Opportunities Fund. The Trust Company (RE Services) Limited ABN 45 003 278 831 AFSL 235150 (Perpetual) is the responsible entity of, and Ophir is the investment manager for, the Ophir Global Opportunities Fund and the Ophir High Conviction Fund. Ophir is authorised to provide financial services to wholesale clients only (as defined under s761G or s761GA of the Corporations Act 2001 (Cth)). This information is intended only for wholesale clients and must not be forwarded or otherwise made available to anyone who is not a wholesale client. Only investors who are wholesale clients may invest in the Ophir Opportunities Fund. The information provided in this document is general information only and does not constitute investment or other advice. The information is not intended to provide financial product advice to any person. No aspect of this information takes into account the objectives, financial situation or needs of any person. Before making an investment decision, you should read the offer document and (if appropriate) seek professional advice to determine whether the investment is suitable for you. The content of this document does not constitute an offer or solicitation to subscribe for units in the Funds. Ophir makes no representations or warranties, express or implied, as to the accuracy or completeness of the information it provides, or that it should be relied upon and to the maximum extent permitted by law, neither Ophir nor its directors, employees or agents accept any liability for any inaccurate, incomplete or omitted information of any kind or any losses caused by using this information. This information is current as at the date specified and is subject to change. An investment may achieve a lower than expected return and investors risk losing some or all of their principal investment. Ophir does not guarantee repayment of capital or any particular rate of return from the Funds. Past performance is no indication of future performance. Any investment decision in connection with the Funds should only be made based on the information contained in the relevant Information Memorandum or Product Disclosure Statement.