By Andrew Mitchell & Steven Ng
Co-founders and Senior Portfolio Managers

In this month’s Letter to Investors we provide some guidance of when we think markets may bottom and we discuss why maintaining maximum flexibility in our portfolios is so important in the current environment.
Welcome to the June Ophir Letter to Investors – thank you for investing alongside us for the long term.
Staying flexible, staying nimble
(Almost) nowhere to run, nowhere to hide.
The half-time whistle has been called on financial markets for 2022 and quite frankly it’s what us Aussies might call a ‘Barry Crocker’[1].
Almost nothing went up except energy prices, inflation and interest rates. Equities fell, with the S&P500 down -20%, making it the worst half since 1970. There was nowhere to hide, even for ‘diversified’ investors, with bonds also falling (Bloomberg US Agg index was down -10.4%) off the back of higher interest rates.
Even this undersells the aggressive falls in some parts of the markets. The biggest falls were reserved for a murderer’s row of the share market’s ‘growthiest’ pockets.
- US non-profitable tech companies crashed -52.6%
- Expensive software (>8x EV/Sales) was down -50.2%
- Liquid IPOs fell -47.6%
- The ASX300 Tech sector lost -36.3%,
- The Russell 2000 Growth index was down -29.5%
- And the NASDAQ Composite was off -29.2%.
What sectors, styles, and strategies are working in 2022?
as of 30 June 2022
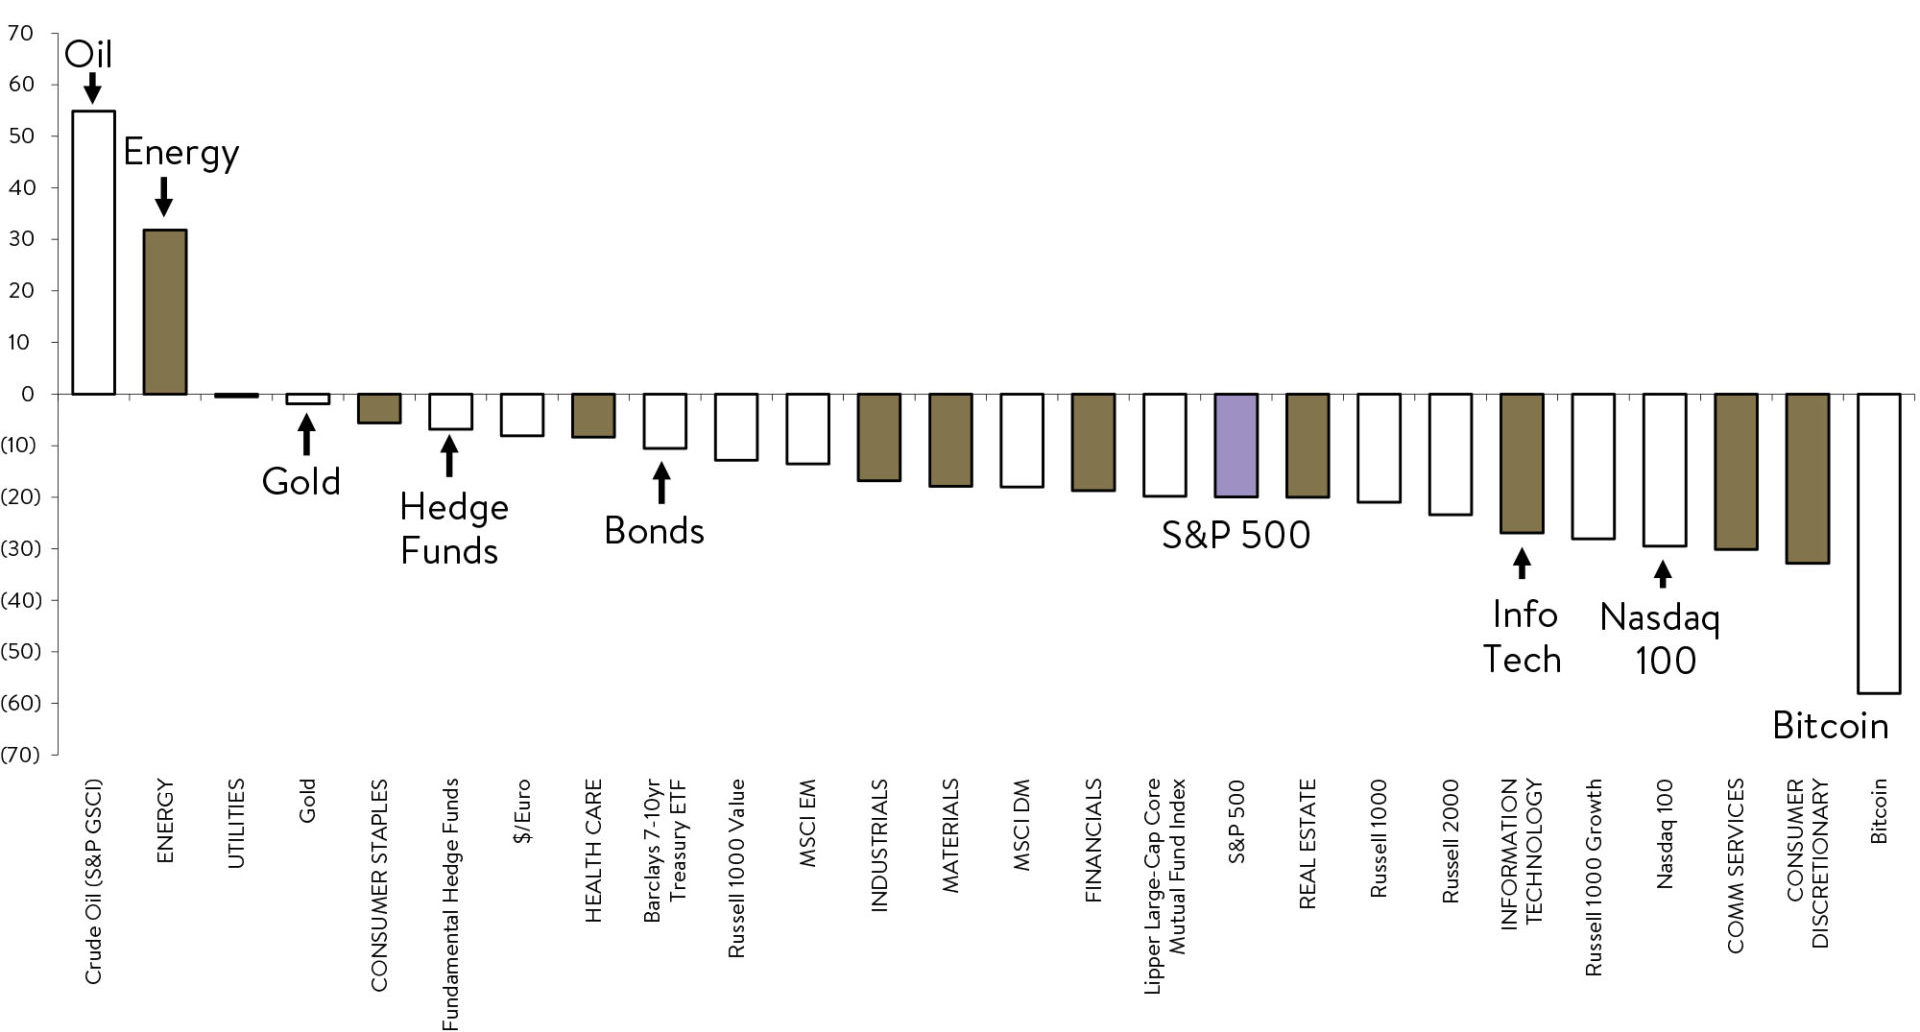
Source: FactSet, MSCI, Lipper, HFR, Goldman Sachs Global Investment Research
Eight of the top 10 worst performing S&P500 companies in 2022 have been IT or Consumer Discretionary companies – all down more than -50% – including Netflix, PayPal and Facebook.
If you wanted to find something up in 2022, chances are it had energy or oil in its name. Nine of the top 10 performing S&P500 companies in 2022 have been companies in the Energy sector – all up more than +30% – including Exxon Mobile and a bunch of other energy companies you have probably never heard of.
You can’t tell us it’s not a macro-driven market when the sector you are in, or the ‘style’ of company you are, has more to do with your return fortunes than the quality and long-term trajectory of your actual business.
June 2022 Ophir Fund Performance
Before we jump into the letter in more detail, we have included below a summary of the performance of the Ophir Funds during June. Please click on the factsheets if you would like a more detailed summary of the performance of the relevant fund.
The Ophir Opportunities Fund returned -6.9% net of fees in June, outperforming its benchmark which returned -13.1%, and has delivered investors +21.0% p.a. post fees since inception (August 2012).
Download Ophir Opportunities Fund Factsheet
The Ophir High Conviction Fund investment portfolio returned -7.6% net of fees in June, outperforming its benchmark which returned -11.7%, and has delivered investors +12.3% p.a. post fees since inception (August 2015). ASX:OPH provided a total return of -17.0% for the month.
Download Ophir High Conviction Fund Factsheet
The Ophir Global Opportunities returned -3.9% net of fees in June, outperforming its benchmark which returned -6.1%, and has delivered investors +12.9% p.a. post fees since inception. (October 2018).
Download Ophir Global Opportunities Fund Factsheet
June: From inflation fretting to recession risk
For most of the last six months, markets were driven by concerns about rising inflation and interest rates. That saw equity valuations compress (P/Es fall), particularly for growth segments.
This changed, though, in June.
Markets became more worried that the US and Europe were entering a recession, and that economic growth and corporate earnings (the ‘E’ part of the P/E) would fall.
The only major share market to rise in June was China, with the Shanghai Comp up +7.5% after China’s largest city saw its two-month Covid-induced lockdown end. To show how tough equity markets were in June, Japan was the next best notable relative outperformer, with the Nikkei down -3.1%.
For growth versus value investing styles, it was much of a muchness. The MSCI World SMID Growth Index fell -5.6% compared to Value, which was down -7.1% (in AUD, total returns). There was a slightly bigger, though still small, advantage to growth in June in the small and mid-cap part of global equities that we care about. The MSCI World SMID Growth Index fell -5.6% compared to value, which was down -7.1% (in AUD, total returns).
The Aussie share market in June was a bit of an outlier, though, particularly in the small-cap space – where our local market’s commodity exposure over the last few months turned from a blessing to a curse as many commodity prices fell. The large-cap ASX50 fell -8.1%, but the Small Ords was down a whopping -13.1%. Even the smaller ASX Emerging Companies Index, which tracks microcap stocks, was down -18.6%. The worst punishment was reserved for gold stocks (ASX Gold Index down -23.3%) and small-cap resources (ASX Small Cap Resources index down -22.1%).
Have we bottomed yet?
Given this savage sell-off, the most common market related question we are asked is “Have we bottomed yet?”.
The reality is no one knows for sure. Though our hunch is – not yet.
Why?
Because we have not yet seen the earnings downgrades caused by central banks, most notably the Fed, seeking to suppress demand through rapid rate hikes. It would be highly unusual if earnings growth were not materially revised down because of the Fed likely compressing most rate hikes for this cycle into 2022.
Bear market price and EPS: Price recovers about 6-9 months before EPS starts to rise
Time 0 = Bear market low, Time in months (US bear markets since 1903)
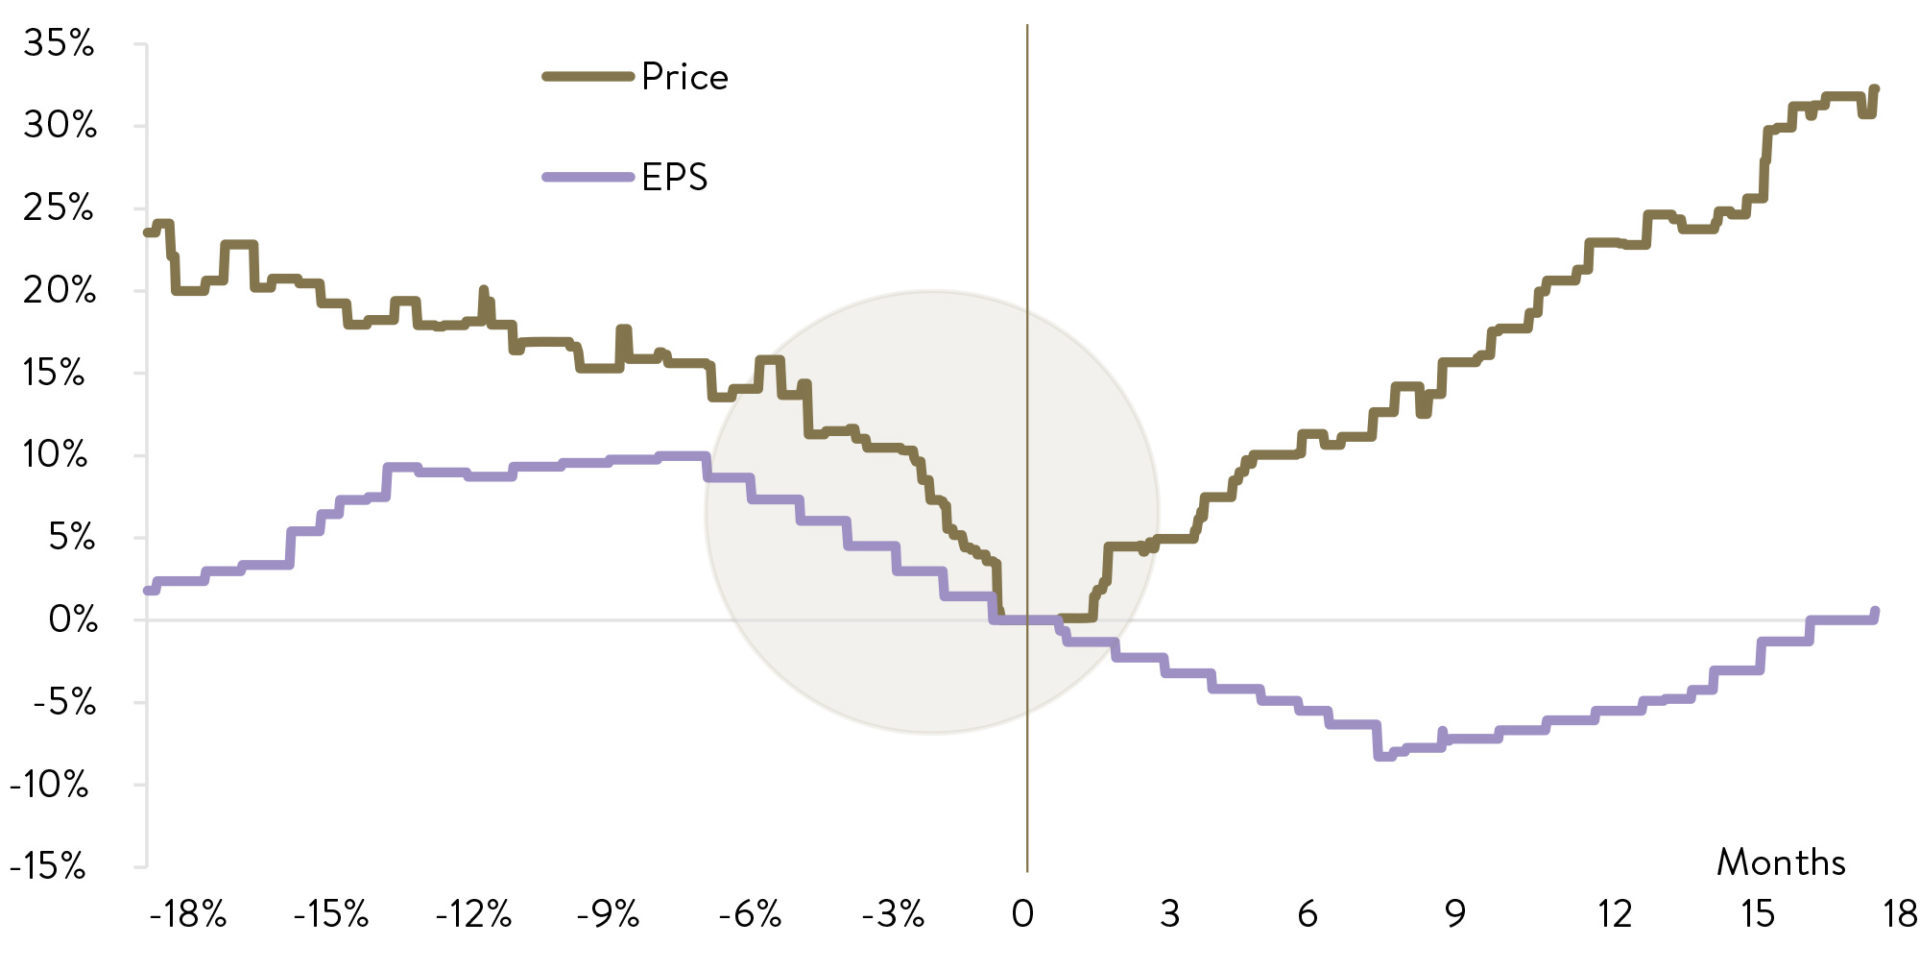
Source: Robert Shiller, Goldman Sachs Global Investment Research
In some insightful work shown in the graph above, Goldman Sachs shows the average path of the US share market (price: gold line) and its earnings per share (EPS) during all the bear markets going back to 1903. First off, we should point out there have been 19 bear markets over the last 120-odd years. That’s about one bear market every circa six years – so investors should expect them frequently.
The general trend of bear markets for the US is that the market falls before EPS falls. The market is forward looking and attempts to price in the coming earnings fall. This is essentially what we have seen so far in 2022.
We are now up to the circled area where we typically see falls in profits. But what happens next? This is where the great mystery lies. There are two main scenarios we see:
- We have a hard landing with a deep recession, and very steep EPS falls which means the market, at least in the US, likely has further to fall.
- We have a soft landing with minor revisions down in earnings growth, which some parts of the market may already be starting to price. That would mean a market recovery quite soon.
The reality is no one knows which it will be. Not the Fed, not your favourite economist and certainly not the press.
Take Goldman Sachs themselves. Early in July, its non-recessionary year-end forecast for the S&P500 index is 4300 (+14%); while its recessionary scenario forecast would see the index fall to 3150 (-17%). Such a wide range as to be almost useless to anyone!
So where are we right now? The below chart shows the current S&P500 price level and EPS. As you can see, earnings forecasts by the market over the next year are only just starting to be revised lower. More are likely to come but the size of the downward revision is highly uncertain.
S&P500 – Price fall, now for earnings cuts?
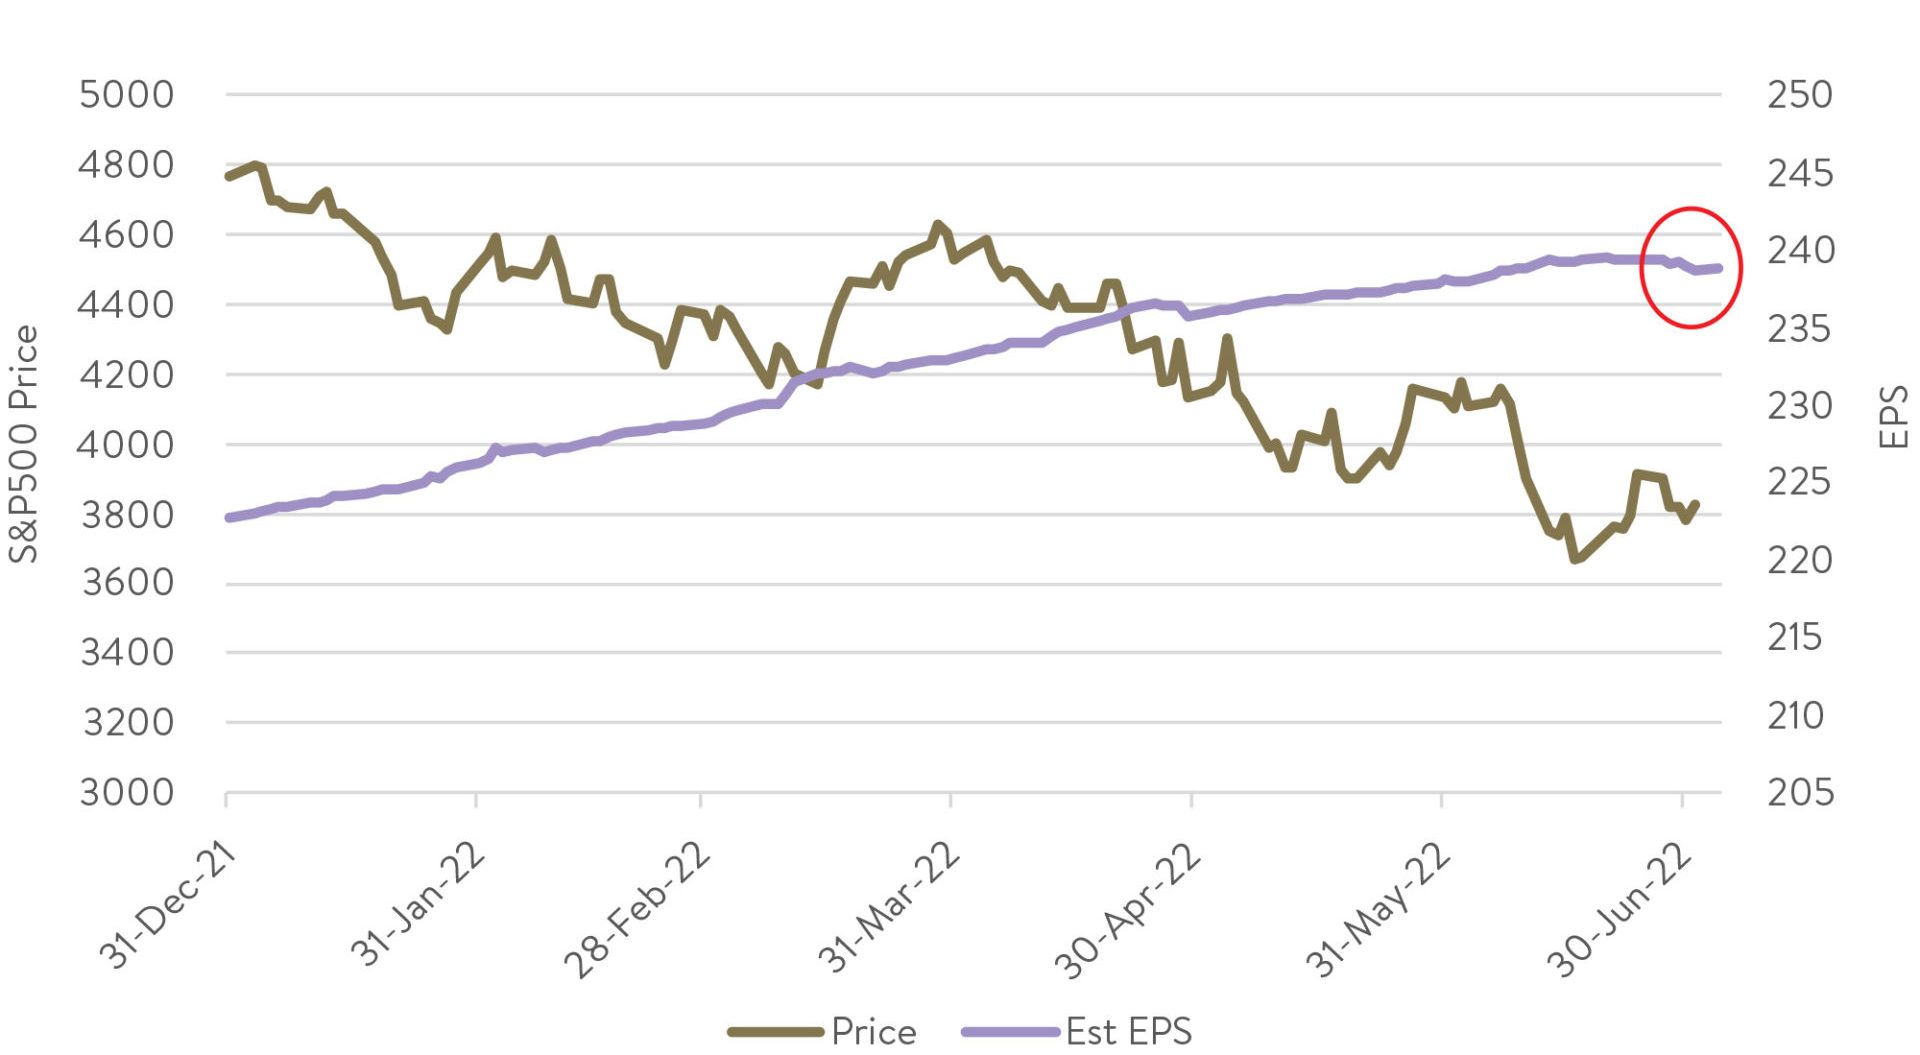
Source: FactSet.
That is why at Ophir we are not so bold as to say we KNOW whether it is going to be a hard or a soft landing in the US. It might give you comfort to hear certainty from us or another money manager on this topic, but we (or they) would be lying. What is clear is the probability of a meaningful earnings growth slowdown has increased. To us, that says we need to adopt a more defensive and flexible investment position in our portfolios.
We are therefore holding some of our largest weights in our funds in companies that are less reliant on a strong global macroeconomic backdrop. Not because we are CERTAIN a recession is looming, but because when the probability of one increases, we believe it is prudent to have portfolio performance be less reliant on the assumption of strong economic tailwinds.
Returning to outperformance
After 6-9 months where it felt like our Ophir High Conviction Fund and Global Opportunities Fund were underperforming their respective benchmarks each week, we are pleased to report that each of our funds outperformed in June.
They were all still down, though, in absolute terms as equity markets of almost all varieties fell materially during June. We understand this has been a tough time for investors, particularly those invested alongside us in the Ophir funds.
Importantly, we understand what is causing these falls, and we feel we have adjusted our portfolios appropriately over the last few months to help us protect investors’ capital.
We know the core of what drives share prices and our performance over the long term is unequivocally earnings growth. We believe we have not seen a deterioration in the ability of our team to find those superior growers over the last year which maintains our confidence in meeting our long-term return targets.
Ophir Funds – Performance to 30 June 2022
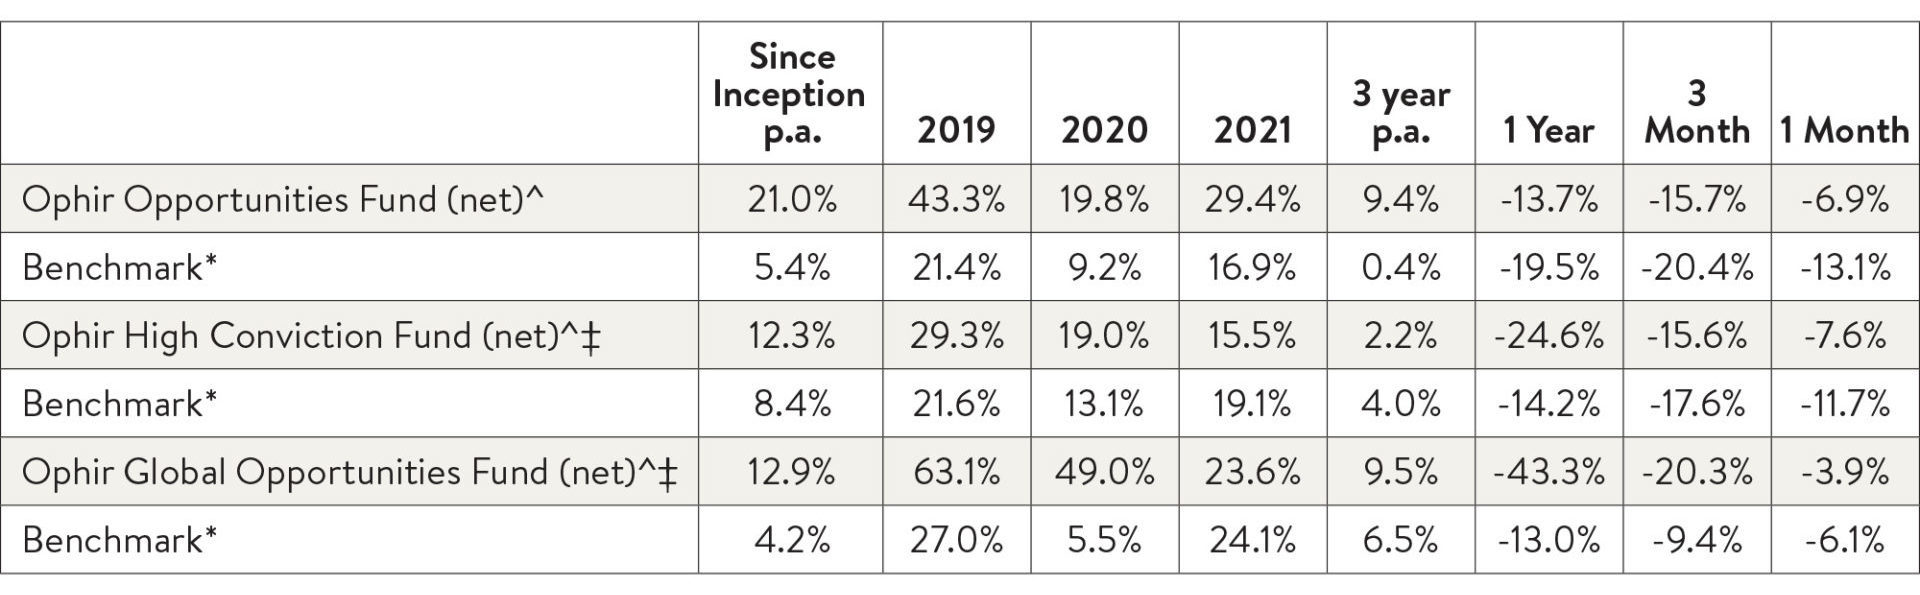
Source: Ophir. Data as of 30 June 2022. ^ Net performance after fees and including reinvestment of distributions calculated using the net asset value of the fund. Inception dates: Ophir Global Opportunities Fund – October 2018, Ophir High Conviction Fund – August 2015, Ophir Opportunities Fund – August 2012. *Benchmarks: Ophir Global Opportunities Fund – MSCI World SMID Index TR (Net) (AUD), Ophir Opportunities Fund – S&P/ASX Small Ordinaries Accumulation Index, Ophir High Conviction Fund – 50% S&P/ASX Small Ordinaries Accumulation Index (XSOAI) 50% S&P/ASX Midcap 50 Accumulation Index (XMDAI). Past performance is not a reliable indicator of future performance. ‡The Trust Company (RE Services) Limited (ABN 45 003 278 831, AFSL 235 150) is the responsible entity of, and issuer of units in, the fund. Ophir Asset Management Pty Ltd (ABN 88 156 146 717) (Ophir) is the manager of the fund.
While it is a very short period, there are two key reasons for the return to outperformance in our funds in June that are worth highlighting:
- The market’s shift in June from inflation to growth concerns saw materials and financials underperform, as they usually do in a slower growth environment. As with most growth investors, these sectors are underweight in our portfolios.
- From late March, we also acted to position the Ophir funds for slower economic growth. We materially reduced our exposure to consumer discretionary companies, (think a JB HiFi compared to Woolworths), and we increased exposure to businesses with more resilient and less economically sensitive earnings streams. We also increased the liquidity and market cap of our core holdings.
The major (if not almost sole) headwind to performance of the Ophir funds, both in absolute and relative to benchmark terms for the last 6-9 months, has been compression in valuations (P/Es) -particularly for smaller more growth orientated businesses – the bulk of which appears done if inflation is ultimately contained and we find ourselves in a more normalised 3-4% interest rate environment in the US and Australia.
In short, we believe the trajectory for company earnings is likely to be a more powerful driver of share price returns than macro influences of inflation and interest rates going forward. While this still creates concerns for the direction of share markets overall, given the uncertainties of whether the major economies will have a hard or soft landing, it does give us more confidence about relative performance because our due diligence on earnings trajectories is where we believe our core strength and advantage lies.
From inflation to growth fears: large caps ‘catch down’ to small caps
One of the fund-specific questions we have been frequently asked is why we have been an outlier (and not in a good way) from a performance perspective recently in our Global Opportunities Fund when compared to other equity managers or investments that investors may have in their diversified portfolios.
One of the key reasons, if not the key reason, is simply that the market segment we invest in, global small-cap growth-orientated businesses, has materially underperformed Australian and US large caps, which often comprise the core parts of some investors’ equity portfolios.
Global Opportunities Fund has fallen in line with market segment Ophir invests in over the short term
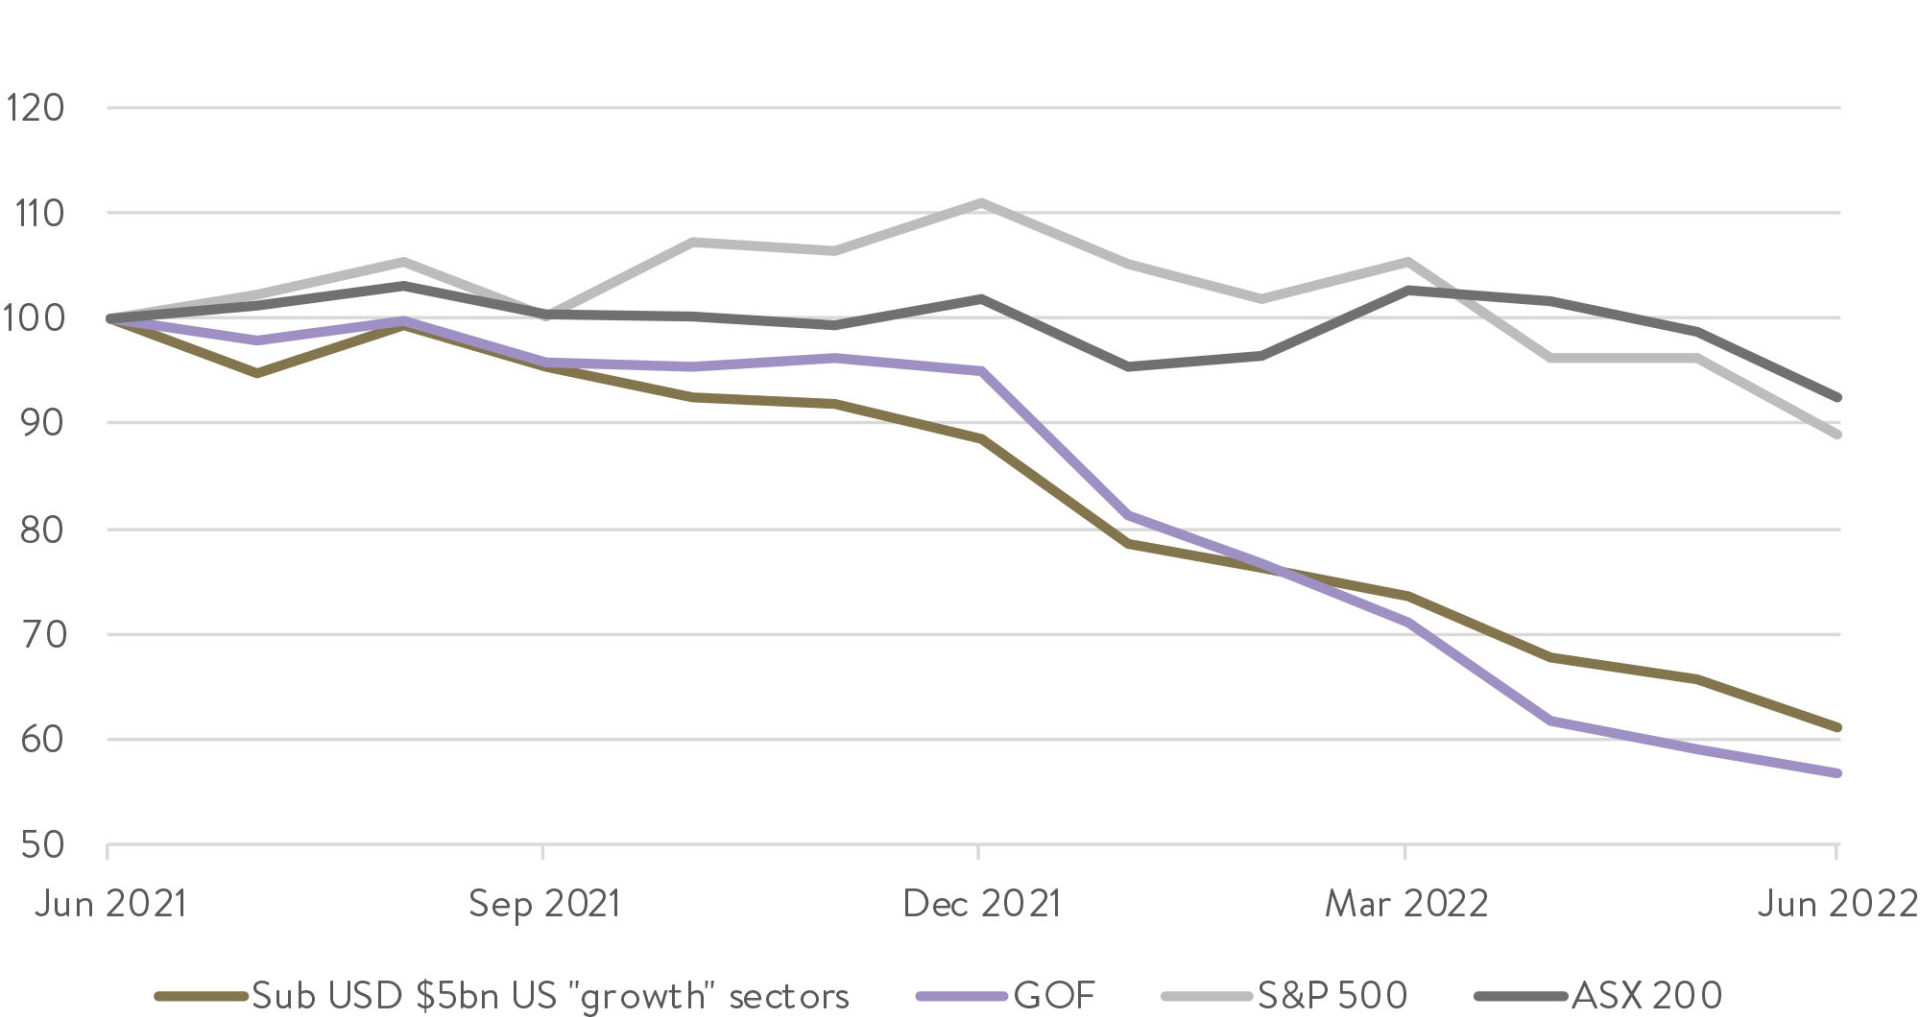
Source: FactSet. Data as of 30 June 2022. “Growth” sectors include information technology, consumer discretionary, consumer staples, health care and industrials.
We have highlighted this above by showing the performance of Australian and US large caps (dark grey and light grey lines respectively) compared to a proxy of our market segment of US businesses below US$5bil in market cap in the more growth-orientated sectors (gold line).
Our Global Opportunities Fund (purple line) has broadly tracked our market segment lower over the last year. Of course, we are not pleased with this as we always seek to outperform our market segment. It does highlight though given the divergence in performance of our market segment compared to the well-known Aussie and US large caps that we would have expected to underperform managers operating in those other markets.
Sometimes our chosen market segment will be a headwind to performance (as it has been over most of the last year) and sometimes it will be a tailwind as it was from late 2018 (inception of the Global Opportunities Fund) to mid-2021. This latter point can be seen below where our market segment, and our fund, outperformed Australian and US large caps.
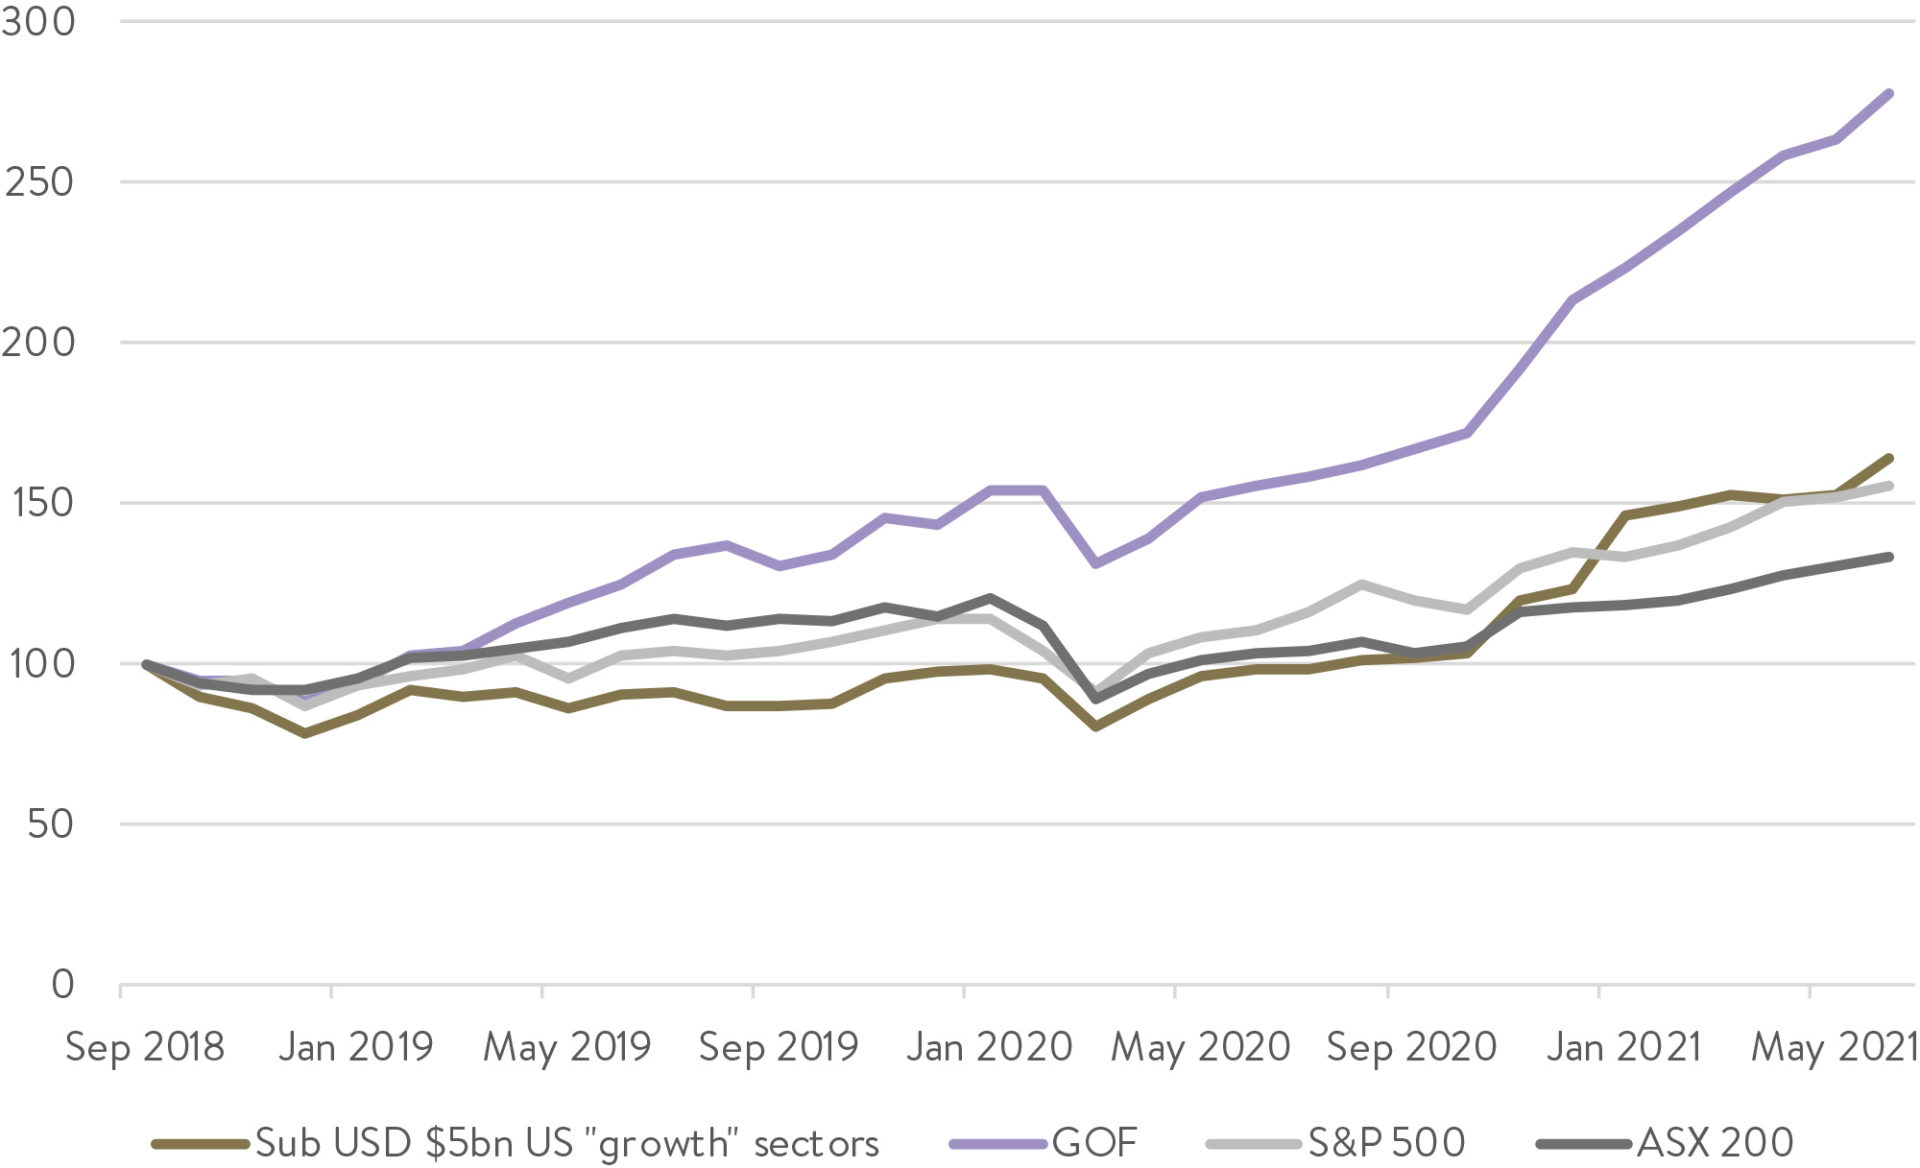
Interestingly, more recently, other parts of equity markets have also been falling, or ‘catching down’ in a sense, to our market segment which was the first to fall in late 2021 when the Fed pivoted its interest rate outlook. Other segments are now falling because investors are more worried about economic growth. Indeed, US large caps recently entered a bear market. (See this month’s Investment Strategy note) on the relationship between bear markets and recessions).
Staying flexible, staying nimble
Given the complex outlook described above, we have meaningfully increased the liquidity of our portfolios by increasing cash levels (to around 15%) and moved up the market cap spectrum – though remaining true to label in the small and mid-cap space.
This allows us to keep our funds flexible and allows us to be nimble when we see the slowing in any earnings growth cuts. As the Goldman chart above shows, the market does not wait for EPS to bottom before rebounding, it typically does this well before (around 6-9 months before on average). This is when it becomes clear earnings growth reductions are slowing and the market can ‘see’ where the earnings bottom will be in the future.
We continue to monitor the incoming hard earnings and macroeconomic data (actual NOT forecast data) for when we can start adding more growth back into our funds and relax our more-defensive positioning. When that time comes it likely will be a gradual process over time with no definitive starter’s gun. That time to begin is not yet, but we expect that it likely will be at some point over the next 6-12 months.
Such is the forward-looking nature of investment markets that if you were an alien dropped onto earth at present you might be scratching your head to see equity markets down so much while unemployment is at multi-decade lows in the US and wages growth is so strong. The funny thing about equity markets is you can quite easily imagine a scenario in a year’s time where the macro picture is worse, with unemployment higher as are interest rates, wages growth is lower, but equity markets have already started rallying as they look forward to an acceleration in both economic and earnings growth in 2024.
C’est la vie with investing.
As always, thank you for entrusting your capital with us.
Kindest regards,
Andrew Mitchell & Steven Ng
Co-Founders & Senior Portfolio Managers
Ophir Asset Management
This document is issued by Ophir Asset Management Pty Ltd (ABN 88 156 146 717, AFSL 420 082) (Ophir) in relation to the Ophir Opportunities Fund, the Ophir High Conviction Fund and the Ophir Global Opportunities Fund (the Funds). Ophir is the trustee and investment manager for the Ophir Opportunities Fund. The Trust Company (RE Services) Limited ABN 45 003 278 831 AFSL 235150 (Perpetual) is the responsible entity of, and Ophir is the investment manager for, the Ophir Global Opportunities Fund and the Ophir High Conviction Fund. Ophir is authorised to provide financial services to wholesale clients only (as defined under s761G or s761GA of the Corporations Act 2001 (Cth)). This information is intended only for wholesale clients and must not be forwarded or otherwise made available to anyone who is not a wholesale client. Only investors who are wholesale clients may invest in the Ophir Opportunities Fund. The information provided in this document is general information only and does not constitute investment or other advice. The information is not intended to provide financial product advice to any person. No aspect of this information takes into account the objectives, financial situation or needs of any person. Before making an investment decision, you should read the offer document and (if appropriate) seek professional advice to determine whether the investment is suitable for you. The content of this document does not constitute an offer or solicitation to subscribe for units in the Funds. Ophir makes no representations or warranties, express or implied, as to the accuracy or completeness of the information it provides, or that it should be relied upon and to the maximum extent permitted by law, neither Ophir nor its directors, employees or agents accept any liability for any inaccurate, incomplete or omitted information of any kind or any losses caused by using this information. This information is current as at the date specified and is subject to change. An investment may achieve a lower than expected return and investors risk losing some or all of their principal investment. Ophir does not guarantee repayment of capital or any particular rate of return from the Funds. Past performance is no indication of future performance. Any investment decision in connection with the Funds should only be made based on the information contained in the relevant Information Memorandum or Product Disclosure Statement.
[1] Or in other words a “shocker” in rhyming slang for those outside the Land Downunder.