No one investing style wins in all market environments, many go in and out of favour through time. In this month’s Investment Strategy Note we cover how our investment style is defined and which parts of the business cycle we can expect it to do well in and which parts it is likely to find the most challenging.
Investing style: When should your fund perform?
Key Takeaways
- Understanding a fund manager’s investing style is vital for investors as it can indicate which parts of the business cycle the manager may outperform or underperform.
- The Ophir funds’ small cap growth investing style has historically tended to outperform when markets sell off during economic downturns.
- By contrast, the Ophir funds have tended to underperform when the economy is expanding and central banks have pivoted to increasing interest rates – the key historical period here was late 2016/early 2017.
- We are currently in the expansion phase of the business cycle with rapid central bank rate increases. This has favoured ‘Value’ styles of investing and this is the primary cause of recent underperformance of the Ophir funds.
- As central bank interest rate hikes slow global growth, we believe investors will become more willing to pay up for companies with scarce growth. This will likely be good news for our funds and their ability to outperform.
Just as we could all probably describe someone’s fashion style with names such as preppy, sporty, corporate, grunge, etc, investing ‘styles’ can also be categorised.
One of the reasons Morningstar and other analysts separate fund managers into different style boxes – such as “small cap value” and “large cap growth” — is to understand how they are likely to perform at different stages of the business or investing cycle.
Like fashion, investment styles go in and out of vogue. Virtually no manager outperforms at every stage of the cycle.
Equity Style Box
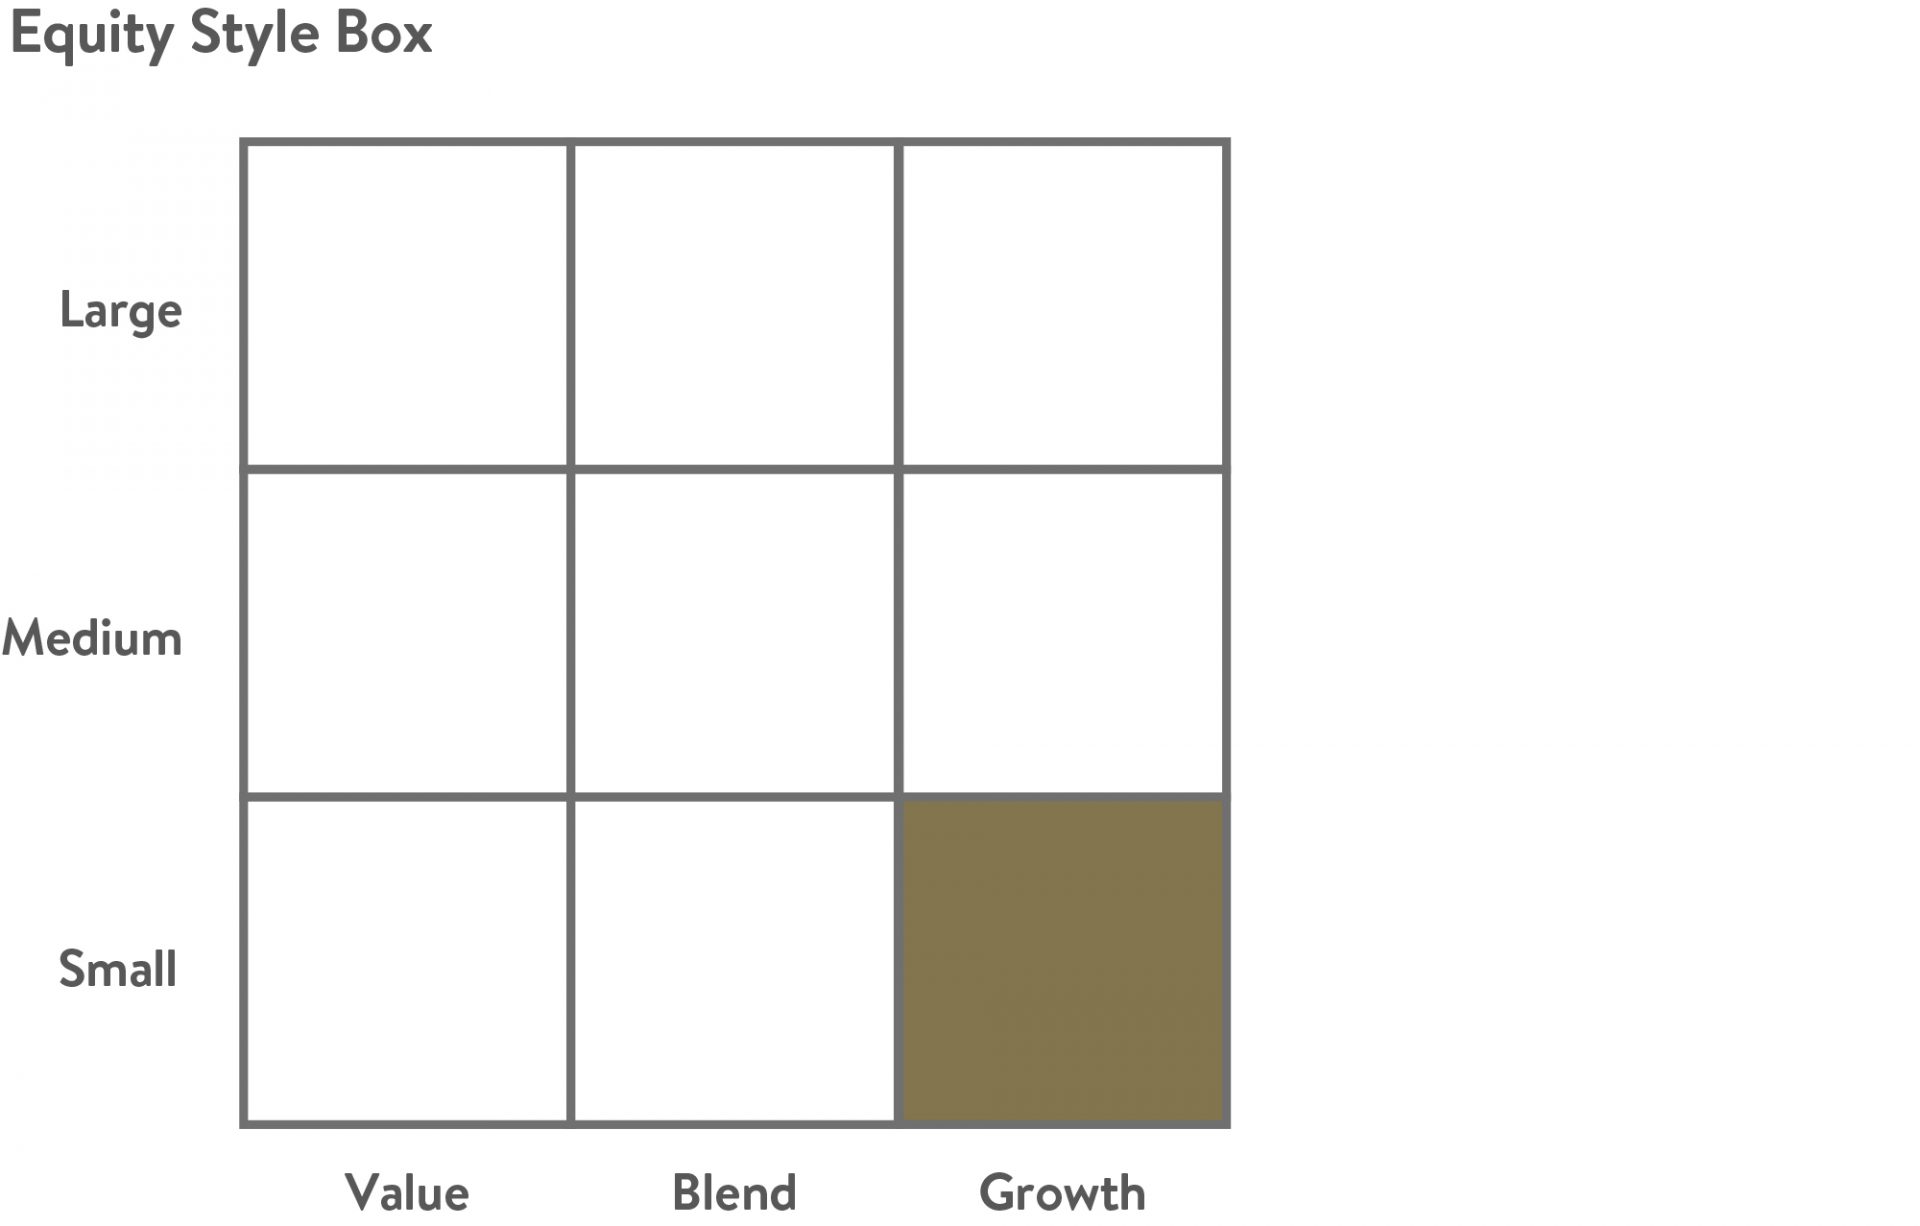
Source: Morningstar
Most professional investment consultants would put Ophir’s style in the “Small Cap Growth” box on the above chart.
It is vital that our investors deeply understand how our investment style – and styles of other fund managers — performs during various stages of the business cycle.
Understanding style, and building it into expectations, can help prepare investors for when it eventually occurs. It can also raise red flags when underperformance occurs at points in the cycle that weren’t expected.
Defining the business cycle
There are many ways to define the business cycle, but below is one of the more common. As illustrated in the chart below, all economies typically go through the Expansion-Peak-Recession-Depression-Trough-Recovery cycle to one degree or another through time.
It used to be thought this cycle would generally last around 7-10 years on average between recessions. But really this is a very rough rule of thumb.
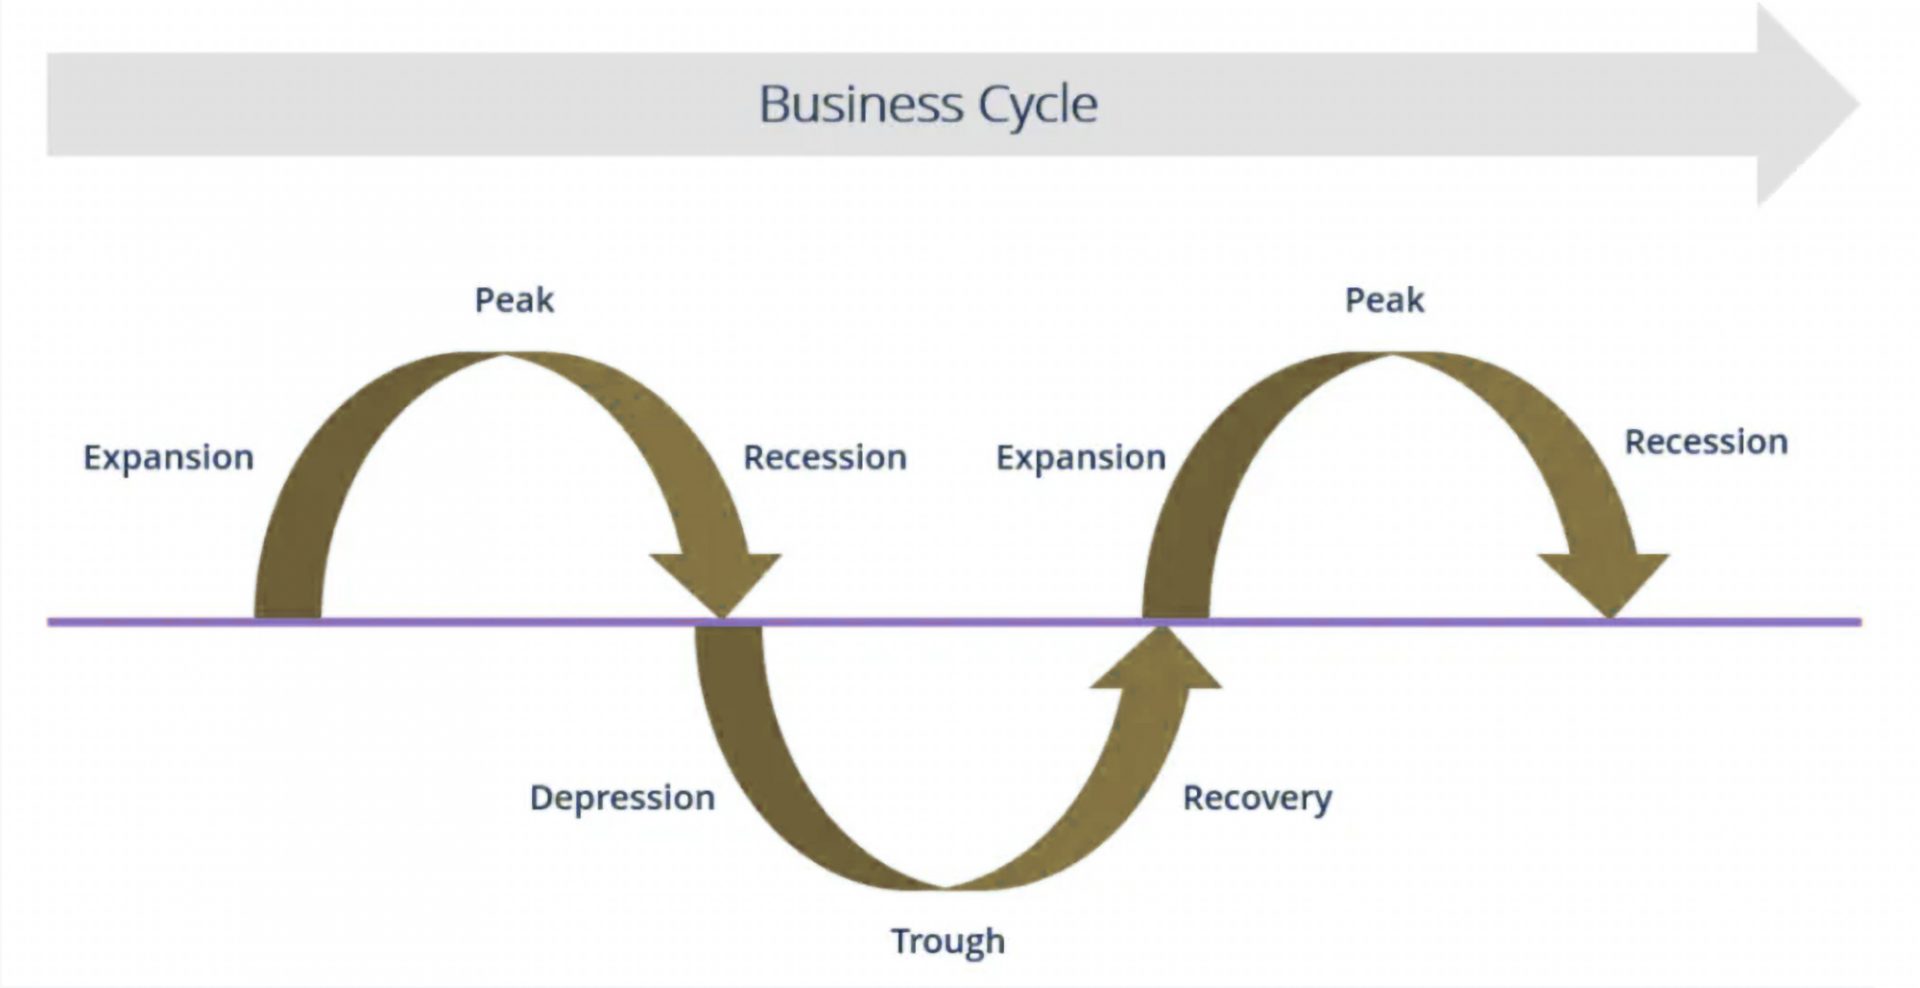
Source: Corporate Finance Institute
As an example of which styles tend to perform better at different parts of the cycle:
- You tend to see small cap managers underperform large cap ones through the Recession-Depression-Trough part of the cycle as investors become more risk averse and have a higher liquidity preference.
- You also tend to see value style managers outperform in the early stages of the Recovery phase as strong economic growth provides a tailwind for more cyclical orientated sectors such as Energy and Materials.
When it comes to using the business cycle for investing, there are a few caveats.
Firstly, while it is relatively easy to determine which part of the business cycle you’re in now, determining how long it will last before transitioning to the next stage is very difficult if not impossible. (Prior to Australia’s COVID-19 induced recession in 2020, its previous one was nearly 30 years ago in the early 1990s.)
Even if you could as an investor, that would still likely not be enough to materially help you. Why? Because it’s not the actual transition from one business cycle stage to the next that matters for investing, but instead the market’s recognition of when that change occurs. A few weeks too early or too late with your positioning before the market recognises the transition in cycle stages can make all the difference to performance.
Secondly, while varying styles generally perform differently at each stage of the cycle, each fund is unique. At Ophir, we tend to invest in the smaller end of the small-cap spectrum because of the less efficient pricing of companies in that part of the market. We also have a very strict ‘valuation’ focus to ensure we are not overpaying for those businesses.
One of the more frequent questions we have received recently is: “We understand Ophir has historically tended to outperform when markets have fallen. Markets have been falling recently and you have underperformed. Why is this the case?”
This is an excellent question. It allows us to reveal more about our investment process, the types of down markets we have tended to outperform in, and why we haven’t so far in this down market.
Let’s look at 3 key observations about when Ophir funds do and don’t outperform historically.
Observation 1: Overall, Ophir funds have outperformed during market sell-offs
Yes, it is true that for our two longer-running Australian equity funds that have been in operation for almost 7 and 10 years respectively they have tended to protect on the downside – that is outperform when markets are down.
Downmarket Performance
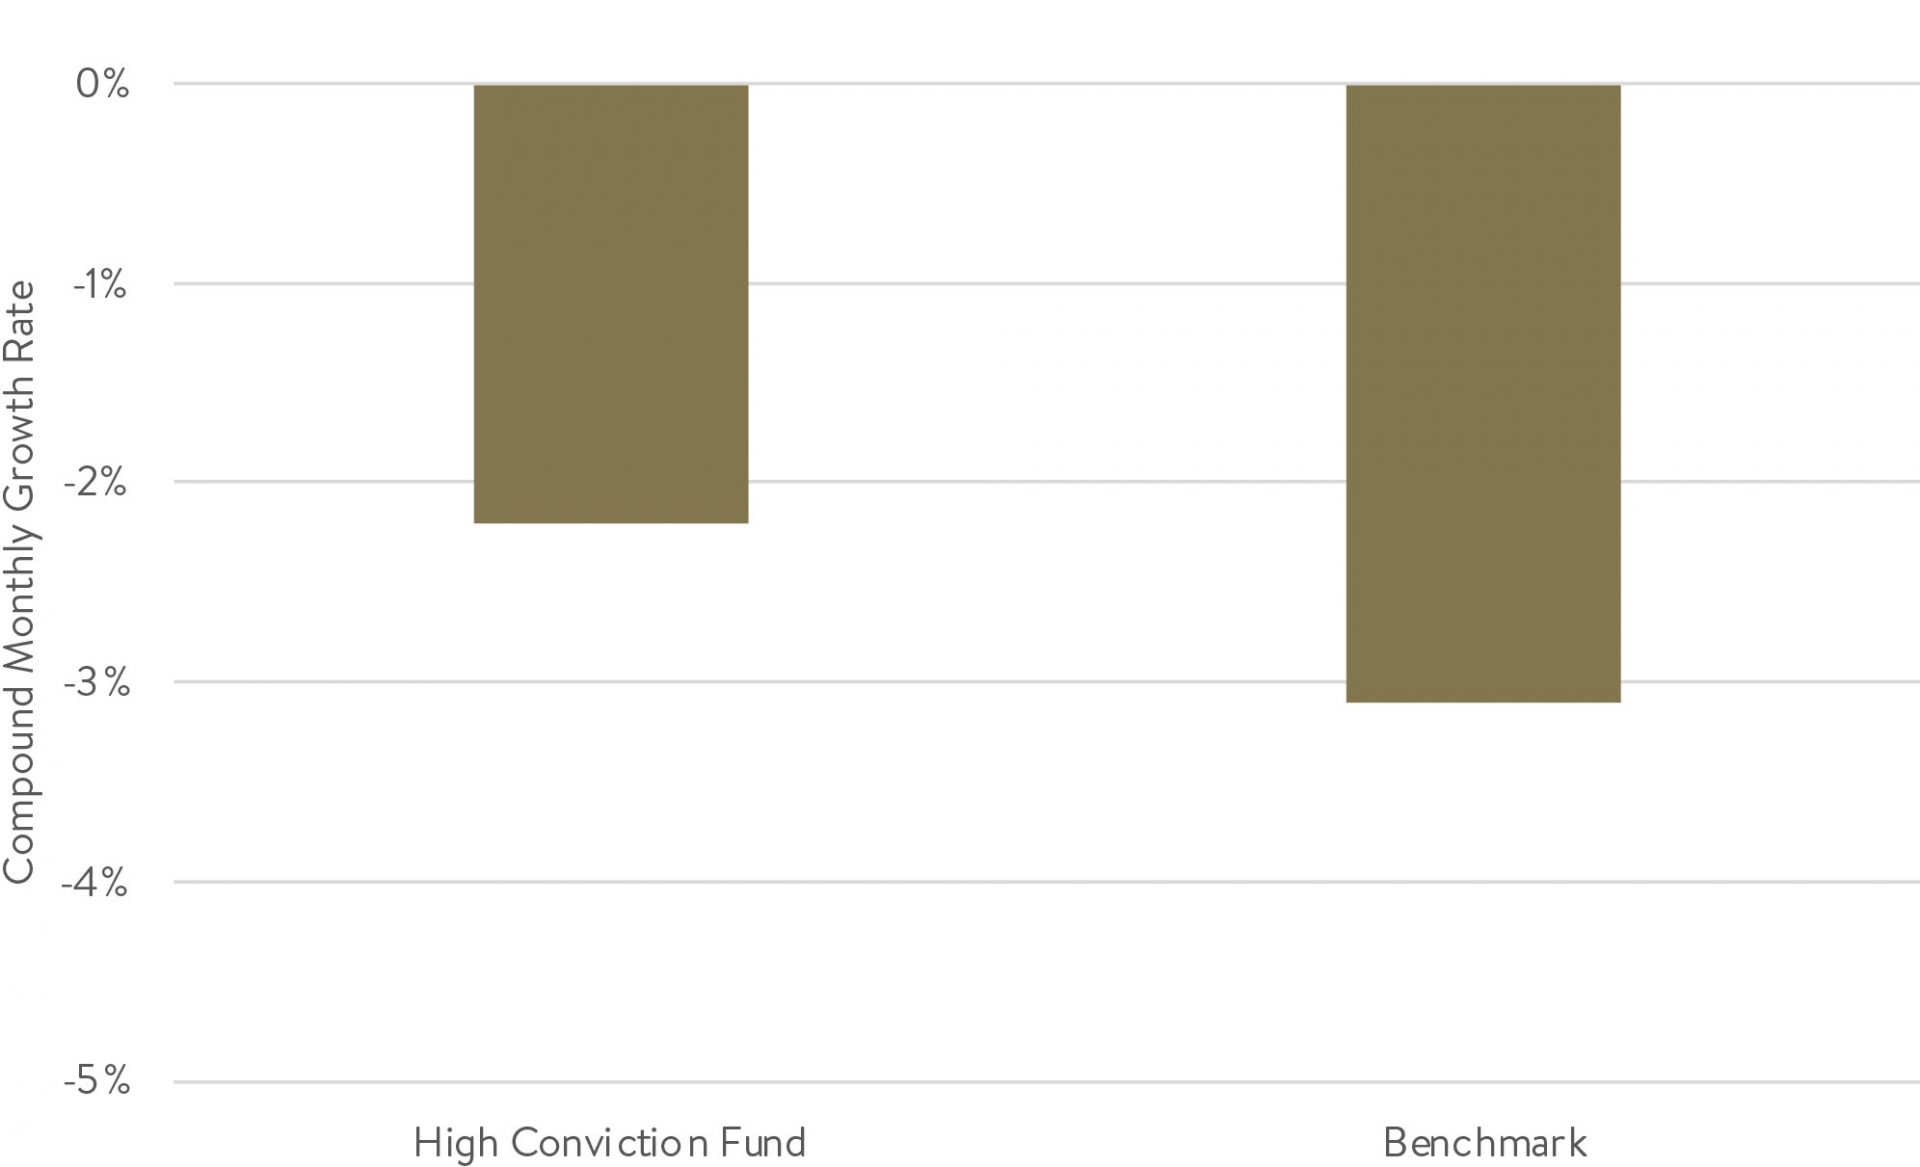
Source: Ophir. Data to 30 April 2022
You can see this above where the benchmark (ASX SMID Index) has been down on average -3.1% in down market months, whilst in those same months the Ophir High Conviction Fund has only been down on average -2.2%. This is known as a ‘downside capture ratio’ and is 71%. That means our fund has only fallen 71% of the markets fall on average during down market months. (Usually, anything lower than about 80% is quite good.)
These same stats for our original Ophir Opportunities Fund show an even better 47% downside capture ratio – so this fund has fallen less than half the amount of the benchmark during down market months, on average.
Observation 2: Ophir funds have tended to outperform when markets sell off during economic downturns
But it is important to understand that downmarket outperformance has occurred historically during economic slowdowns.
As you can see in the drawdown chart for the Ophir High Conviction Fund below, the biggest outperformance in a downmarket occurred during COVID-19 when the domestic economy went into recession. We also saw outperformance in our global equity funds during this same period.
Drawdown from Peak
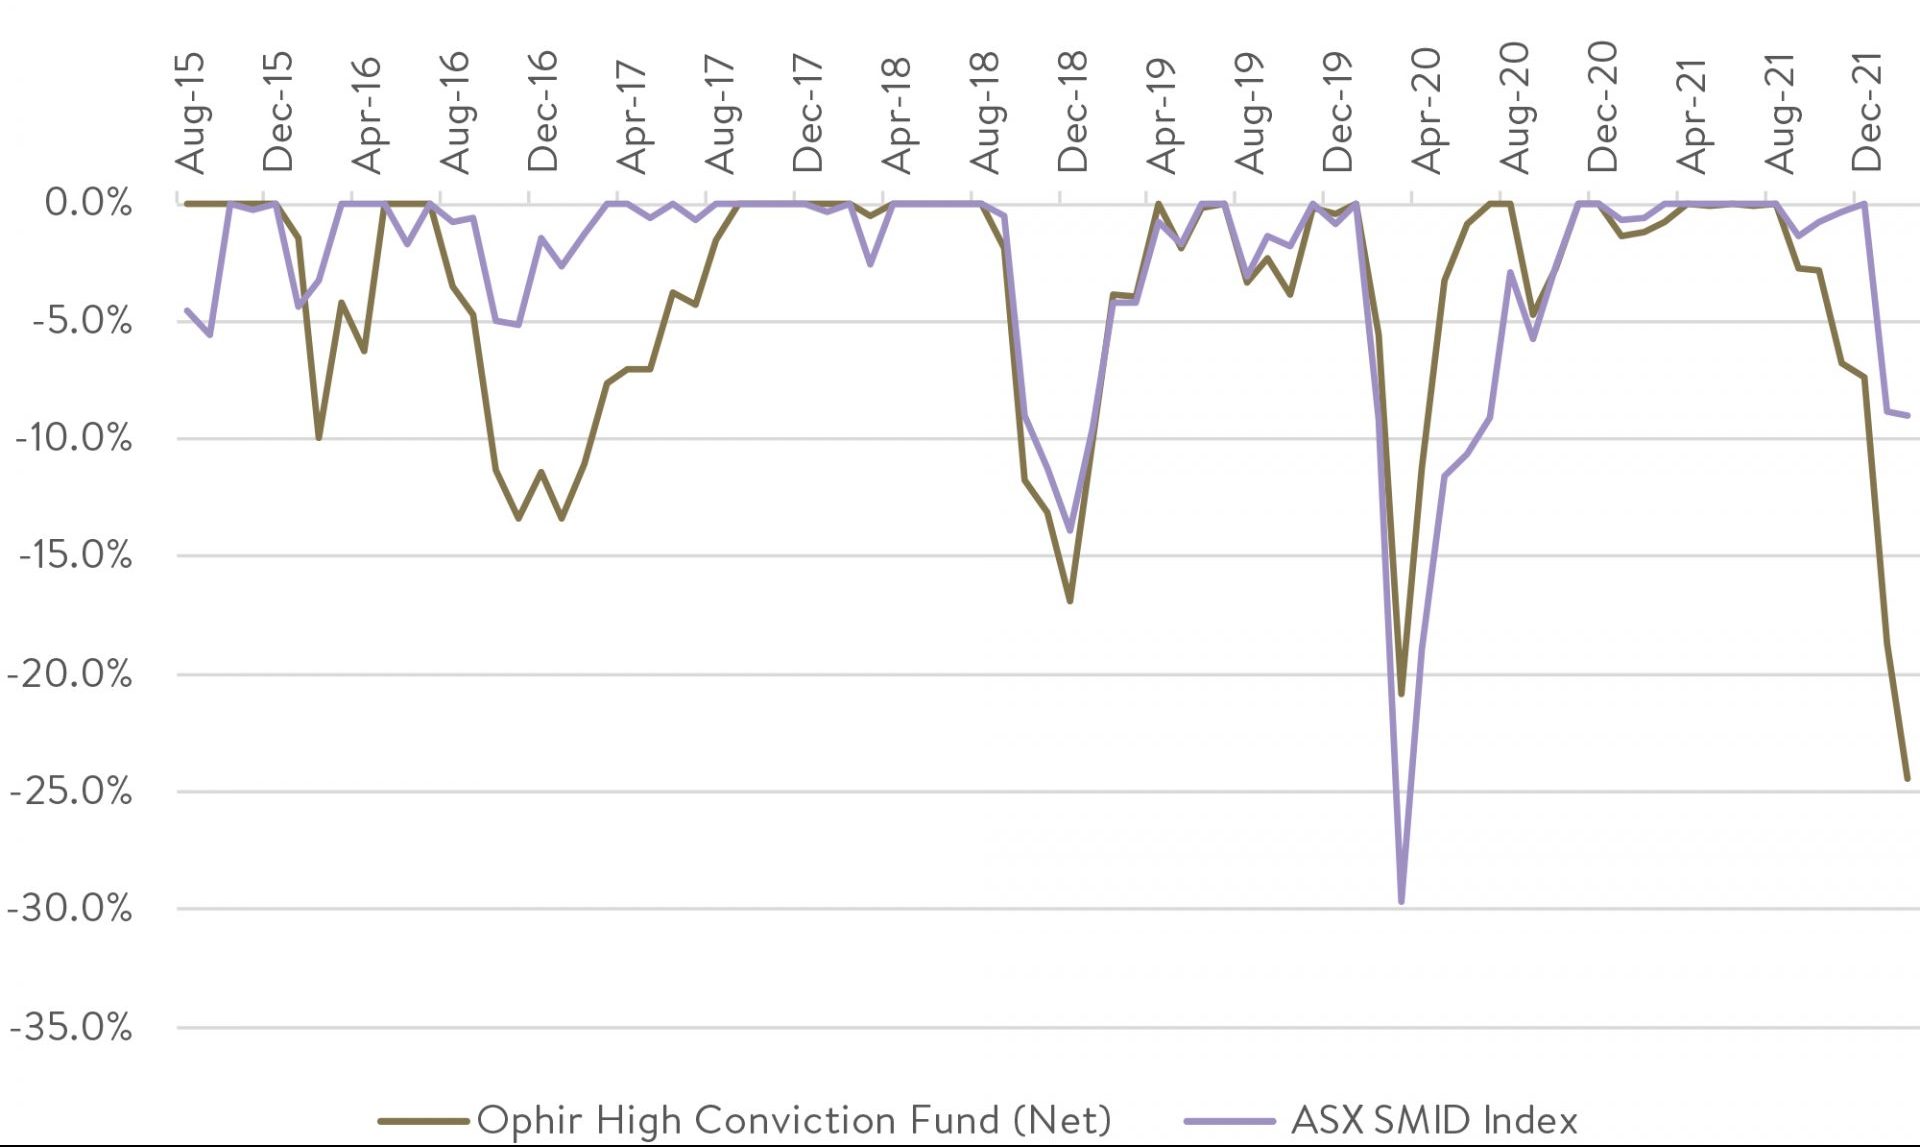
Source: Ophir. Data to 30 April 2022.
Why have our funds outperformed historically during economic slowdowns?
A core part of the risk management approach at Ophir focusses on analysing how companies are likely to perform during an economic ‘meltdown’ or recession. We calculate a ‘Meltdown score’ for each business across a multitude of metrics including correlation of revenue and earnings to GDP, as well as balance sheet strength.
We developed this meltdown scorecard during the GFC, and it reviews all the key factors we believe cause certain businesses to be sold off more during these environments that typically see the biggest falls in equity markets. It is one of the reasons we believe we were able to significantly outperform during the GFC with our previous employer, prior to founding Ophir.
This has been very important in helping us outperform in down markets that are caused by economic meltdowns or slowdowns.
Observation 3: Ophir funds may not, and are less likely to outperform during some stages of strong economic expansions
By contrast, we have underperformed historically when markets sell off when the economy is expanding and central banks have pivoted to increasing interest rates.
In the chart above, the two standout periods where we underperformed were the late 2016/early 2017 period and today’s current down market.
These periods shared something in common: The corrections were started by the opposite of an economic meltdown – that is, by strong economic expansion, increasing inflation, and fears that central banks, particularly the US Federal Reserve, would start to meaningfully increase interest rates.
That’s when value investing styles tend to outperform as growth is no longer scarce and cyclical sectors (which often comprise larger allocations in value managers’ portfolios) get a boost from the upswing in economic growth.
Unfortunately, our Meltdown score doesn’t protect against the opposite of meltdowns!
What part of the cycle are we in?
So that leaves us with the question: where are we now in the business cycle?
As the Australian share market chart below shows, following the COVID-19-induced recession, we have gone through the ‘Trough’ and ‘Recovery’ phases. We are now in the ‘Expansion’ phase.
ASX 200 EPS & price for current cycle
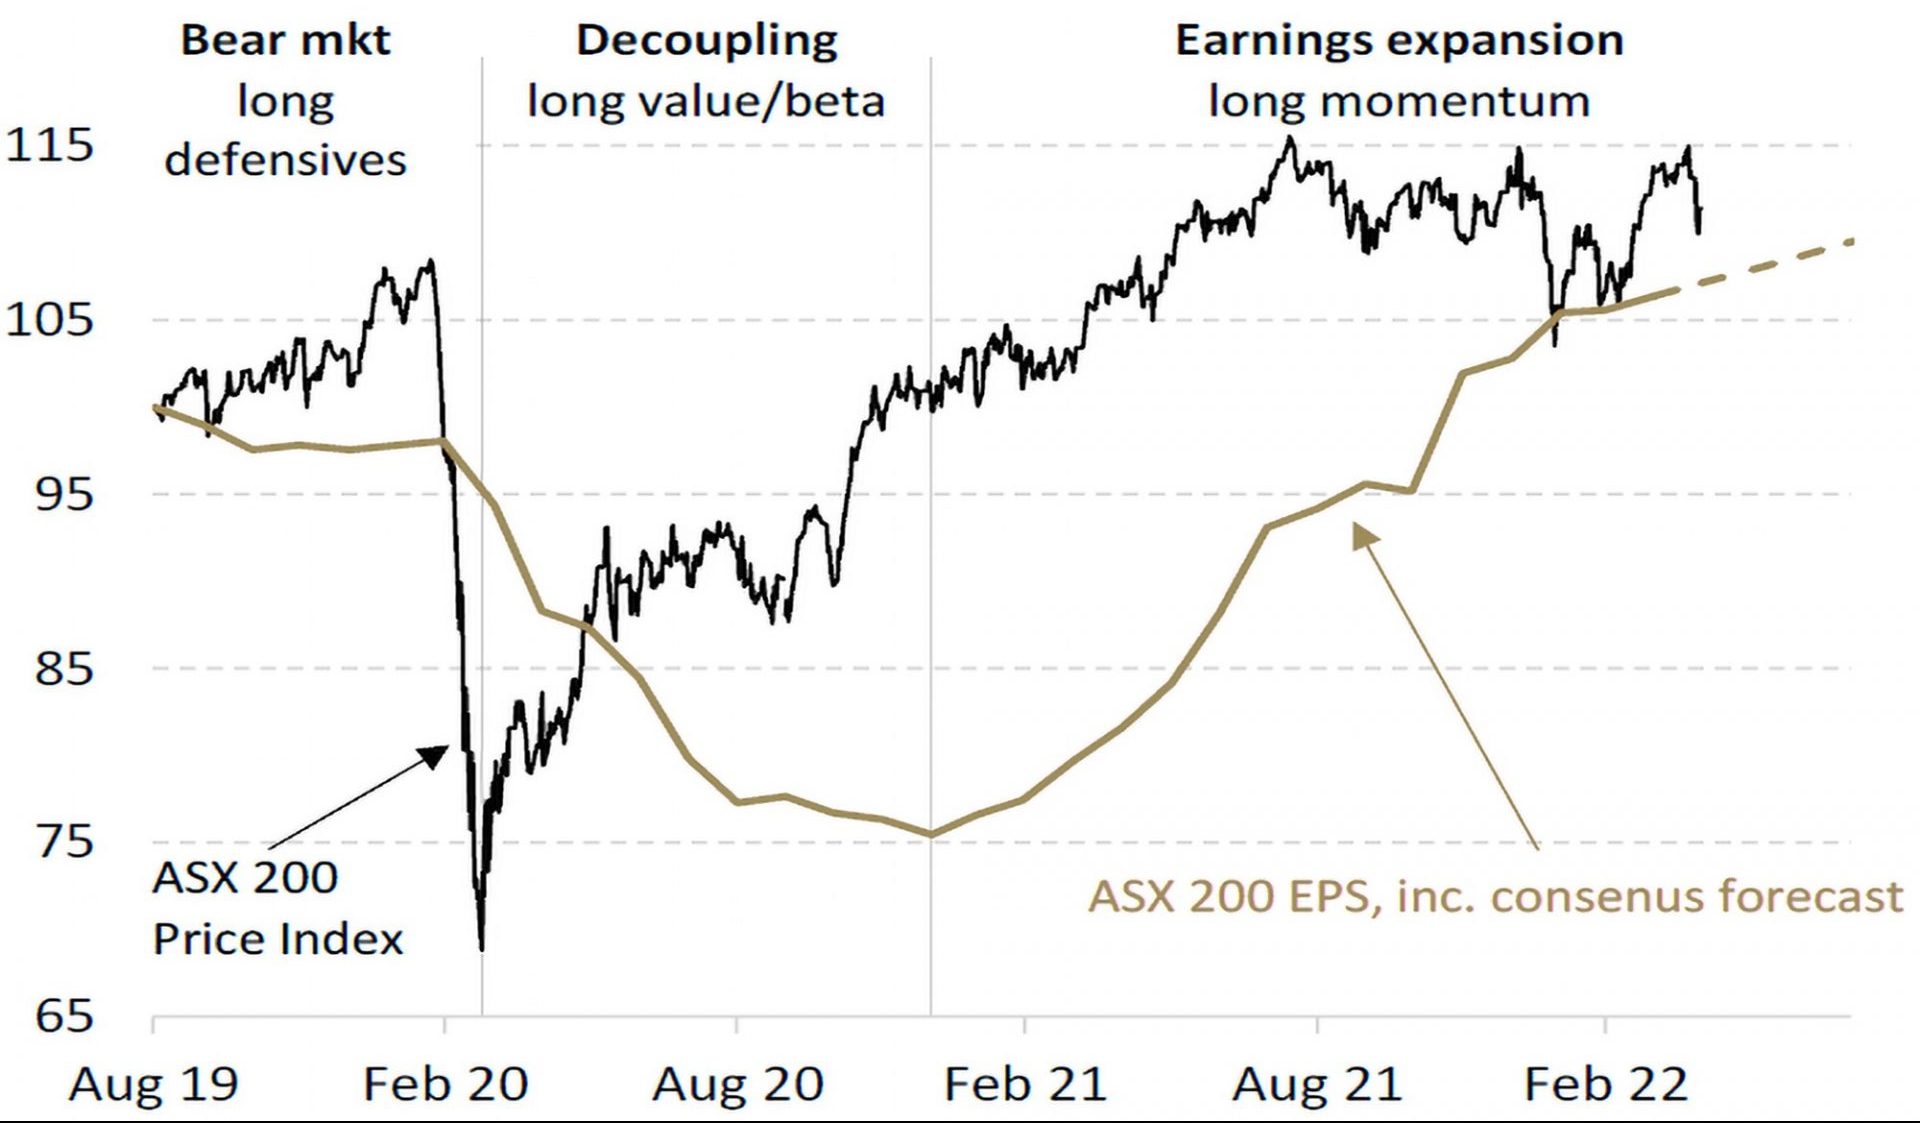
Source: MST Marquee
Earnings per share (EPS) for corporate Australia has bottomed, had a very strong recovery, and it is now growing but at a much slower rate. This description could fit most other advanced economies including the United States and Europe.
As mentioned, the recovery and expansion phases often include periods where your more value style and cyclical sectors, such as materials, energy and financials, tend to outperform.
But we are structurally underweight these sectors at Ophir because they are less fertile hunting grounds for growth businesses globally.
Hope on the horizon
But this expansion cycle could be ending, or at least slowing materially.
The market, and the Fed themselves, are forecasting aggressive interest rate hikes over this year, and our own RBA has just joined the rate hiking party. This likely means the business cycle is getting longer in the tooth and we see two core outcomes as most likely over the next year or two:
- Slower global growth with a soft economic landing and no recession in the US.
- A more significant global slowdown with a hard economic landing and ensuing US recession.
Economists are putting a higher probability on the first outcome but are still putting a material 30-40% probability on the second more perilous scenario.
What we do know is that both of these outcomes entail a slower overall growth environment. One where the rising tide that has lift all boats, but especially the value investing style and cyclical sectors that we don’t meaningfully participate in, may be making way for times where investors may be willing to pay up for companies with scarce growth.
That is actually good news for our funds and their ability to outperform.
While it might mean overall corporate earnings growth slows and market returns are more muted over the next year or so, it also means that markets will get back to focusing on company fundamentals and those wonderful businesses that are showing superior growth.
That would be music to our ears. As that is where we believe our skill lies, in seeking out and identifying those leaders of tomorrow before the masses do.